
Stock Returns May Not Be What They Seem
Buyer beware when investment marketers give performance comparisons.
/s3.amazonaws.com/arc-authors/morningstar/1aafbfcc-e9cb-40cc-afaa-43cada43a932.jpg)
Two Beats One
For the 19-year time period of 1997-2015, gold almost exactly kept pace with the Dow Jones. Ten thousand dollars invested in the Standard & Poor’s Spot Gold Index in January 1997 had become $28,716 by year-end 2015. The comparable figure for the Dow Jones Industrial Average was $28,905. Of course, while the two indexes ended near the same place, their paths were quite different; ‘twas merely by accident that they finished together. This is what their paths looked like.
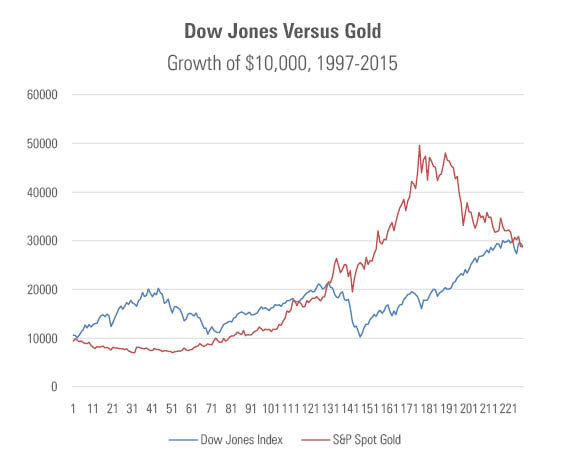
Dow Jones, S&P, Morningstar
Per the basics of investment math, if two assets have the same rate of return and are imperfectly correlated (or better yet, perfectly negatively correlated), then it makes sense to hold both in a portfolio, rather than one or the other.
The common cited reason is risk reduction; the vendor who sells both sunscreen and umbrellas won't ever go home having sold her entire inventory, as might those who hawk only sunny- or rainy-day products, but unlike the specialists she will always go home with something. Holding two assets rather than one improves peace of mind--over time, the profits for the specialists might be similar, but they will have endured more rotten days along the way.
But that perspective can be flipped. Just the tactic of combining assets can be thought of as reducing risk for a given level of return, it also can be regarded as increasing returns for a given level of risk. In other words, diversification does more than soothe frayed nerves. It puts extra money on the table.
For Example A simple example: Oddball Corporation's stock gains 15% in odd-numbered years and loses 5% in even-numbered years, while Evenhanded's stock does the opposite. A $10,000 investment in Oddball thus grows to $11,500 in 2017, then shrinks to $10,925 by December 2018. For its part, Evenhanded initially drops to $9,500, then improves to $10,925. (The commutative property works!) The savvy investor, however, puts 50% of her money into each stock, and rebalances annually. Her two-stock portfolio gains 5% each and every year, so that she has $10,500 at the end of 2017, and $11,025 one year later.
Less risk, more profits. Sign me up, please.
The Dow Jones and gold indexes don’t operate as neatly as do Oddball and Evenhanded, or the finance professors’ vendor metaphor (to which, yes, I was subjected in business school). When Dow Jones zigs, gold does not consistently zag. Nonetheless, over that time period--and such analyses are always time-period dependent, as there are no guarantees about future returns and correlations--there was a clear benefit from combining the two. The next chart updates the first graphic, adding a portfolio that consists 80% of Dow Jones, 20% of spot gold. The end point is a bit difficult to make out, but rest assured, it is higher than each of the individual assets, finishing at $31,246. The sum is indeed greater than the parts.
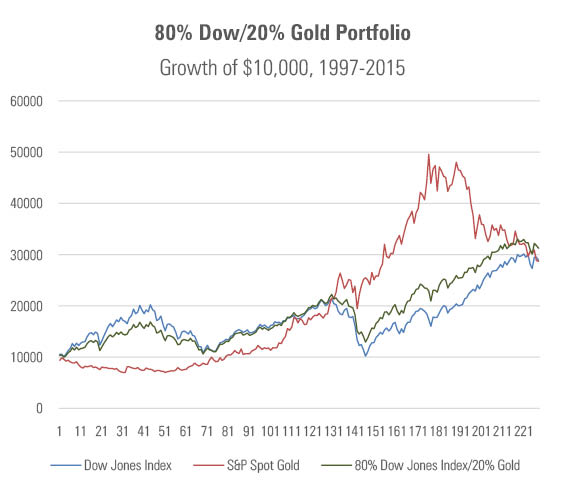
Dow Jones, S&P, Morningstar
I did not invent this portfolio. It comes from the website of the "Precious Metals Leaders," Lear Capital. The company's "Portfolio Comparison Calculator" defaults to a start date of 1997, an initial amount of $10,000, and a blended portfolio that consists of 20% gold, 80% Dow Jones. I generated my figures to confirm the company's findings. As shown in the following diagram, taken from Lear's site, our numbers match. (Although the pictures initially appear to be quite different--design choices dramatically affect how information is perceived.)
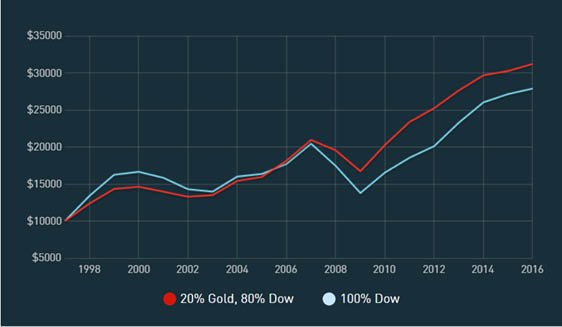
- source: Lear Capital
The Catch However, there is a big problem. Can you guess it? Robert Heubscher did. This example comes from an article on his excellent Advisor Perspectives site. As Bob notes, Lear uses the Dow Jones Price Index, but stock investors don't own prices. They own prices plus dividends. It is not possible to purchase a fund that replicates the Dow Jones Industrial Average's price index--and if such a fund did exist, you would not wish to own it. That fund would be leaving money on the table. Thus, Lear's calculator understates stocks' performance, thereby overstating gold's benefits.
Indeed, when swapping the banana of price returns for the apple of total returns, the case for gold coins largely disappears. As shown below, the realistic performance of the Dow Jones stocks--that is, the performance that one would receive from owning an exchange-traded fund, for example iShares Dow Jones U.S.--swamps that of the blended portfolio. The stock-only basket grows to just over $40,000. Only the very risk-intolerant would prefer the slightly less volatile path of the blended portfolio, with its $31,000 payoff.
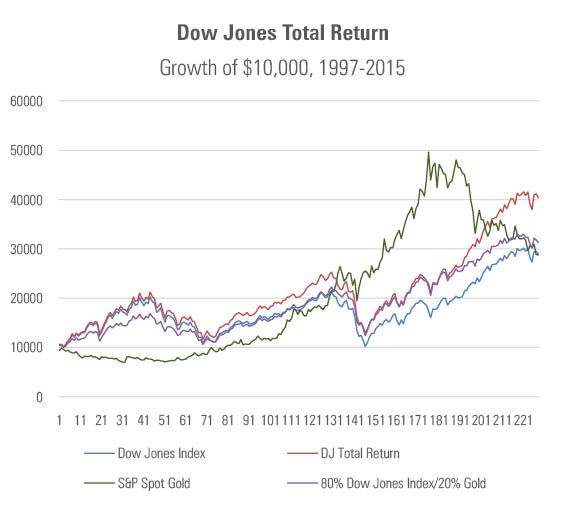
Dow Jones, S&P, Morningstar
Caveat Emptor Bob draws the lesson that Lear Capital specifically, and those who sell gold and silver coins more generally, should be avoided, because they sell too aggressively and not always truthfully. True enough. However, I will add a sobering coda: It's not at all clear to me that Lear erred on purpose. Most investment marketers don't have much clue when making performance comparisons. They understand what their own investments did, but not about potential problems with outside data.
The disclaimer for Lear's calculator cites as data sources Yahoo Finance and Kitco, a precious-metals researcher. That would seem to indicate that Lear pulled its information from Yahoo Let's take a look … yes, sure enough, Yahoo Finance provides the Dow's price history. That's all you need to create your own graph of the performance of the Dow Jones Industrial Average. But it's not all that is required to calculate that which truly matters: how much money Dow Jones stocks made for their investors.
This sort of error happens frequently, in many places. A mutual fund’s performance will almost always be stated correctly, because fund returns are normally calculated by including the fund’s dividends and capital gains. But stock performances, whether of an individual company or an overall market, will often be price returns, not total returns. And, as shown by the Lear case, the disclaimers are often insufficient. When investment marketers give performance comparisons, in tables or calculators, they might well be wrong. Buyers, very much beware.
John Rekenthaler has been researching the fund industry since 1988. He is now a columnist for Morningstar.com and a member of Morningstar's investment research department. John is quick to point out that while Morningstar typically agrees with the views of the Rekenthaler Report, his views are his own.
The opinions expressed here are the author’s. Morningstar values diversity of thought and publishes a broad range of viewpoints.
/cloudfront-us-east-1.images.arcpublishing.com/morningstar/GJMQNPFPOFHUHHT3UABTAMBTZM.png)
/cloudfront-us-east-1.images.arcpublishing.com/morningstar/ZYJVMA34ANHZZDT5KOPPUVFLPE.png)
/cloudfront-us-east-1.images.arcpublishing.com/morningstar/LDGHWJAL2NFZJBVDHSFFNEULHE.jpg)
:quality(80)/s3.amazonaws.com/arc-authors/morningstar/1aafbfcc-e9cb-40cc-afaa-43cada43a932.jpg)