
Stark Differences in Housing Data
Inventory levels explain most of the gap between this week's strong new-home sales and tired existing-home sales data.

Markets held up better than we might have expected this week given the continued hawkish tone from Federal Reserve governors and weaker oil prices. In the past, either of these would generally have been enough to sink world markets. But this week, U.S. and European markets were each down less than 1%, and emerging markets fared slightly worse, falling over 2%.
Commodities were down on higher oil inventory and lack of any production agreement among major producers. A stronger dollar on Friday really did not help matters. Interest rates were up, and bonds were down for the week. The 10-year U.S. Treasury bond yield increased to 1.63% from 1.59% for the week, with rates moving higher after Federal Reserve Board Chair Janet Yellen's speech on Friday along with another governor's comments that there could still be as many as two rate hikes this year.
Not much really mattered this week except the expected speeches out of Jackson Hole, Wyoming, where the Fed governors were attending the annual economics symposium sponsored by the Federal Reserve Bank of Kansas City. The comments coming out of the meeting were a bit more hawkish than expected. But even the hawks noted that their decisions would continue to be data-driven and that nothing was guaranteed.
That is especially true given how a lot of the economic data continues to give mixed signals. This week, new-home sales looked stunningly strong in July, making an eight-year high. This is in direct contradiction to permits for new single-family homes that faltered last week. The data was clearer-cut for the sales of existing homes that continued to drift lower.
Back on the bright side, durable goods orders improved sharply in July, which was welcome news for this beleaguered sector. Markit purchasing manager data suggested that manufacturing was still growing modestly, but not as fast as it was a month ago. While the housing and manufacturing data is important, next week's news on auto sales, consumer spending, and employment will be far more influential on market activity.
Unfortunately, August employment data has been exceptionally volatile and subject to a lot of revisions. And it will be the last employment report before the Fed's September report. A strong report, over 250,000 jobs added, would likely force the Fed's hand into a rate increase. However, less than 125,000 jobs added and all bets are off. The consensus forecast is for about 180,000 jobs. If that forecast is right, other economic data, including consumption and inflation data as well as world events, will take on greater significance.
New-Home Sales Paint a Better Picture Than Last Week's Permits Report Last week, we admitted to being confounded by a government report that showed a decline in the rate of growth of single-family housing permits. Given lower rates and higher builder sentiment, the slowdown was quite surprising.
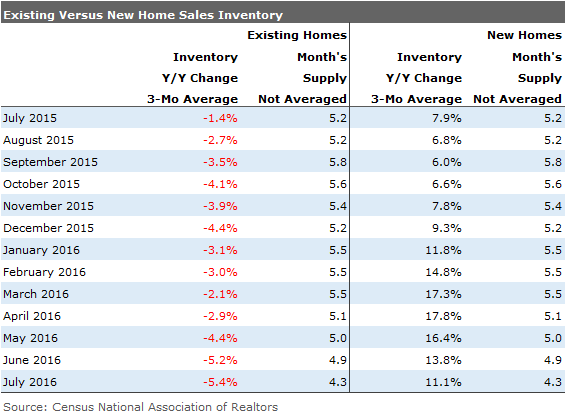
This week, strong new-home sales, which generally move slightly ahead of or concurrent with new permits, showed very strong month-to-month growth. At 654,000 units, the monthly seasonally adjusted total was an eight-year high. Even our year-over-year averaged data looked strong, with even more potential for improved data later in the year. Still, the new-home sales data smells a little too good to be true. Probably the truth lies between the exceptionally good new-home sales report and the surprisingly bleak permits data last week.
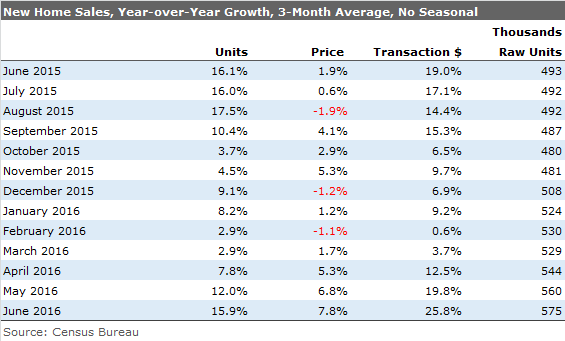
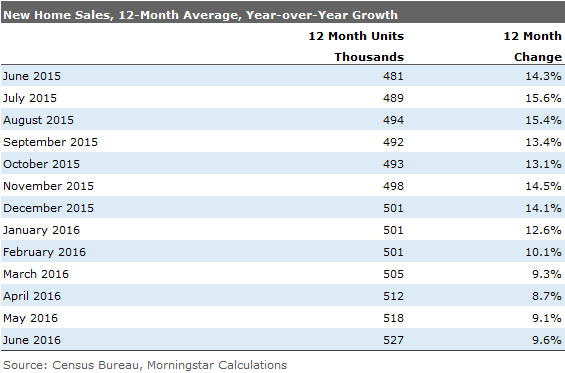
Also, using 12 months of sales data, which removes more of the effects of weather and transaction-processing delays, shows growth in new-home sales that is lower and more consistent. We believe that a 10% growth rate is a more realistic target for new-home sales.
Rolling 12-Month New-Home Data Presents a More Realistic View
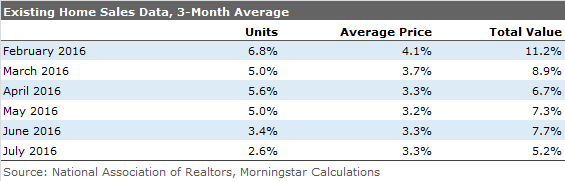
Existing-Home Sales Looking Tired Existing-home sales are going in the other direction of new-home sales. Year-over-year existing-home sales growth rates have fallen from close to 7% earlier this year to under 3%. Falling average prices also seems to indicate that more transactions are happening in the lower end of the price spectrum and that higher-priced homes are not moving.
Side by Side, the Contrast Between New and Existing Homes Is Stunning Even using our rolling 12-month methodology, the difference between new and used homes is stark.
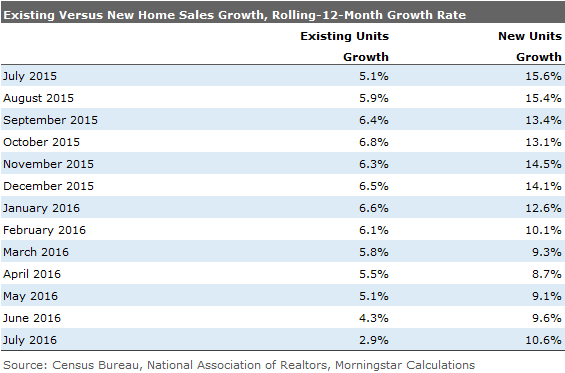
Inventory Levels Explain Most of the Difference Inventories of existing homes continue to dwindle and are down year over year. New-home inventories are up about 11% as homebuilders have stepped up to the plate. However, because of accelerating sales, months of supply data, which compares inventories with sales levels, are relatively similar in both markets. And it is why I suspect that the permit data is wrong and why builders will have to step up the pace even more in the months ahead.
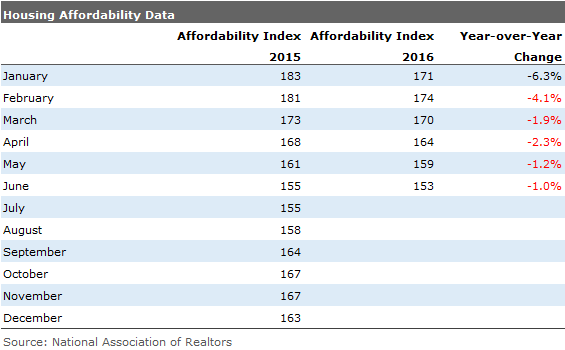
And Affordability Issues in New and Existing Homes Could Have Hurt Sales Earlier This Year Affordability, which compares required mortgage payments to income, declined significantly at the beginning of the year, down over 6% in January. That was a function of higher home prices and higher interest rates. Home-price growth has slowed modestly, and interest rates are now lower and incomes are moving higher. That combination has brought affordability back to where it was a year ago. Improved affordability generally helps sales increase, with a several-month lag. Better yet, we suspect that affordability will improve more dramatically in July, when rates moved sharply lower.
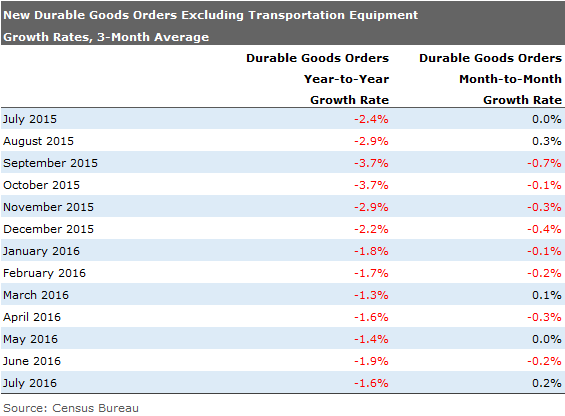
Durable Goods Orders Show Meaningful Monthly Improvement, but Year-Over-Year Data Still in the Dump While the manufacturing sector is not out of the woods, we were very pleased to see strong month-to-month growth in durable goods orders. The 1.5% growth rate, excluding transportation equipment, surprised just about everyone. Not only was the headline growth rate great, but the breadth of the improvement was unusual. Six of the seven major sector categories were up. This is not like some of the past months when data looked good but was driven by strong growth in just one or two categories. Even the hard-hit machinery sector was up.
However, we shouldn't get too carried away with just one month's worth of data: Orders are still down year over year. The rates of year-over-year declines continue their very irregular pattern of improvement. The good news is that the year-over-year comparison gets much, much easier after August. Manufacturing started reducing production activities more dramatically last fall when it became clear that oil prices were sinking again. Nevertheless, we need to first get through August, when auto factory shutdowns wreak havoc with manufacturing in general. With auto sales slowing, we worry that the shutdowns could be more extensive than in the recent past.
/cloudfront-us-east-1.images.arcpublishing.com/morningstar/GJMQNPFPOFHUHHT3UABTAMBTZM.png)
/cloudfront-us-east-1.images.arcpublishing.com/morningstar/ZYJVMA34ANHZZDT5KOPPUVFLPE.png)
/cloudfront-us-east-1.images.arcpublishing.com/morningstar/LDGHWJAL2NFZJBVDHSFFNEULHE.jpg)