
Employment Data Casts Doubt on Dire GDP Report
When the two reports diverge, it's often the employment report that gets it right.

There was a lot of data this week but the employment report was all that really mattered. The U.S. market had slipped in seven of the past eight sessions through Thursday as slowing GDP growth weighed on investors' minds. However, the market rallied about 1% on Friday as the second exceptionally strong employment report in a row cast some doubt on the glum second-quarter GDP report. When the two reports diverge it is often the employment report that gets it right. That's why most of this week's report is focused on employment data.
Employment Data Tells Two Different Stories, Depending on Your Time Perspective
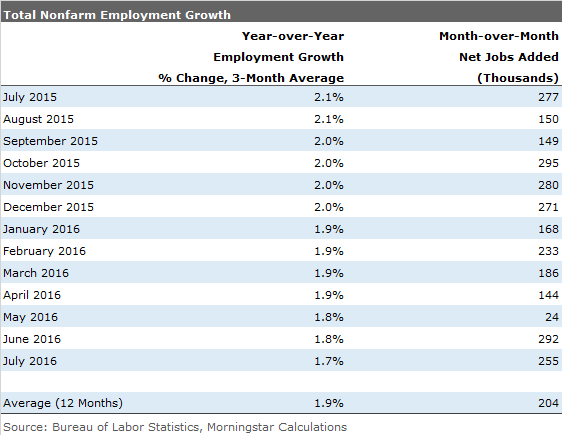
Comparing the July employment report to the June employment report, there was a lot to like. With 255,000 jobs added in July, the report was well above the consensus of 185,000 jobs and the 12-month average of 204,000. Furthermore, adjusting for the
The breadth of improvements across sectors was also unusually good, with only for-profit education losing much ground relative to recent trends. The mix of jobs added was biased to high-paying jobs that combined with underlying worker shortages and a bump in some state minimum wages drove average weekly wages up by 0.3% month to month and 2.6% year over year. Adding to the good news, employment growth was revised modestly higher for May and June. The recent good news is shown in the last column of the table below.
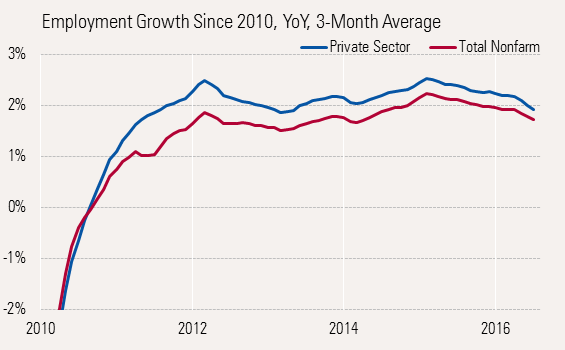
Year-Over-Year Data Continues to Slow With GDP Growth
- source: BLS, Morningstar calculations
Employment Growth Slows With GDP Despite the good news of the past two months, the trend is toward continued slowing in employment growth, as shown in the first data column in the table and the graph above. In a world of limited growth, a move from 2.1% employment growth last July to 1.7% is nothing to sneeze at. And given the tough comparisons with a year ago (when payroll growth was inexplicably soft), some further deterioration in the year-over-year growth rate might be possible. Over the same time frame GDP grew 2.9% to 1.7%, which explains why employment growth has slowed, far above the recovery average of 0.3%. With the new revised GDP data, it appears that GDP growth exceeded employment growth by a wider-than-average spread in 2015, approaching 1% at one point. That spread has currently all but disappeared. We suspect that spread will stabilize around low current levels in the short run, until the unusually high readings of 2015 are balanced out.
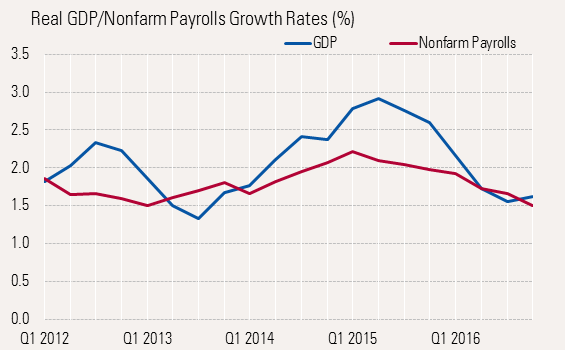
- source: BEA, BLS, and Morningstar calculations
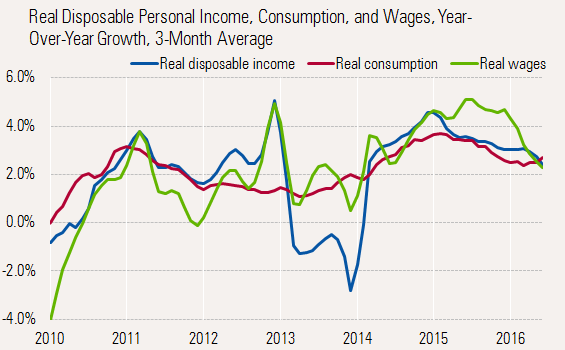
From the consumers' point of view, slowing in employment growth is being offset by faster hourly wage growth.
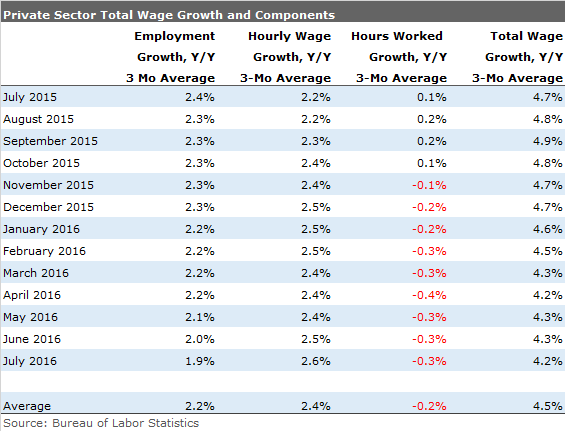
The table above (which shows the faster-growing but still slowing private sector employment data) demonstrates that while employment growth has slowed from 2.4% last July to 1.9% currently while wages growth has accelerated from 2.2% to 2.6%, offsetting most of the damage to consumer wages. However, hours worked are still behind the year-ago rate, holding back total wage growth. I think this data answers a key question: Is job growth and GDP growth being held back by a lack of workers, or a lack of jobs? With wages accelerating at a time fewer workers are being hired, the answer is clear to us. Most telling to us is that manufacturing employment is basically flat with year-ago levels and manufacturing hourly wages are up 3%, more than the average hourly wage growth rate of 2.6%, indicating scarcity worries.
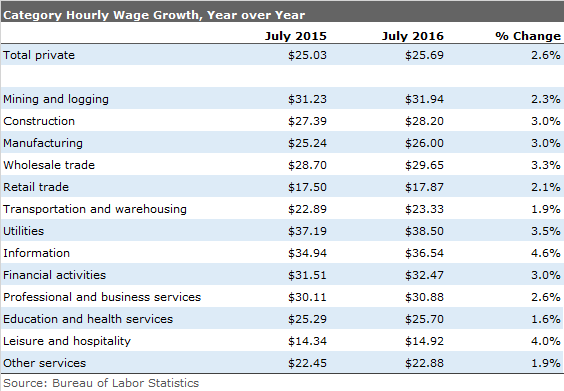
However, not all of the wage growth is necessarily due to shortages. Higher minimum wages are maybe at work, too. The second-best performing wage was the leisure and hospitality sector, which employs a large number of minimum-wage employees. That higher wage has enticed more people to enter the work force as the participation rate has increased again recently. It also appears that with higher wages, employers are finding ways to cut back on hours. For example, weekly wages in the leisure and hospitality sector were up only 3.2% even as wage rates went up 4% because of fewer hours worked.
Wage Rate May Be a Bigger Issue/Help Than the 2.6% Annual Wage Rate Growth Suggests Wage growth has been accelerating modestly but is still quite high by recent standards and considering very modest inflation rates (mainly due to energy prices and imported hard good prices). Still, that modest growth may appear much less modest to many employers. Slow wage growth in the retail sector and the mining sector and a quirk in the education and health growth rate (the increasing ratio of lower-skilled health workers to highly skilled, highly paid workers is holding back the "average" wage) may be suppressing the overall average. Without these special factors the wage growth rates may have been closer to 3%. Again, this is great news for the consumer and consumer spending, but not such great news for business and corporate profits and inflation. Seven of the 13 industry categories, shown above, featured wage rate growth of 3% or higher.
The Solutions to Growing the Economy Faster Are Clear, and Central Bankers Are Not One of Them We believe that a shortage of properly trained and located workers is what is holding back the economy. A combination of accelerating wage growth, low unemployment rates, near-record levels of job openings, and the record number of unfilled positions reported at small business leads us to that conclusion. It appears that higher wages are one solution as higher wages and better prospects seem to be luring more workers back into the work force. Participation rates have stabilized or moved higher as wage rates have increased. Recent wage growth may explain why consumption was the bright spot in an otherwise bleak GDP report.
We are not sure that higher minimum wages are the best way to accomplish that, but businesses have been too focused on lower wage rates. Unlike Henry Ford, who realized he needed to pay workers at a rate high enough to afford the purchase of the cars they manufactured, many businesses were ruthless in pursuit of lower wages. That may have hurt productivity and morale more than it helped profits.
Better training for workers could also be part of the solution. We hope that training might come from the private sector, but some targeted programs from the government might not hurt, either. Also, business or government incentives to encourage employees to stay in the work force longer may alleviate some of the labor issues today. These--and not easier monetary policy--seem to be what the economy needs now.
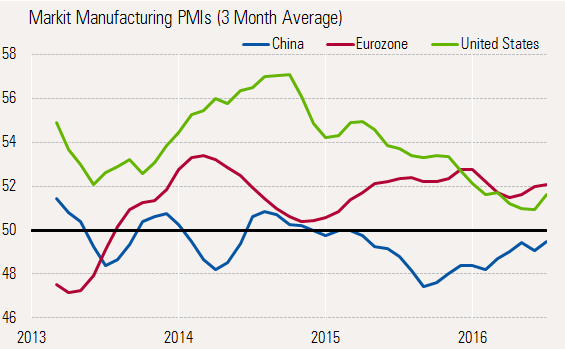
World Manufacturing on the Mend? Monthly data from purchasing managers compiled by Markit suggested that the largest of the declines in the manufacturing sector may be behind us. Reports for the three major regions were in growth mode (readings above 50) in July. Numbers in China and the U.S. showed accelerating trends in July, while Europe continued to grow, though at a slightly slower rate in July. Given all the worries at Brexit, the improving results for July were impressive.
- source: Markit
Very Short-Term Brexit Impact Seems Muted To highlight the Brexit effects, we are also showing the tabular data. As one might suspect, it seemed to have no effect on the U.S. and China and only modestly hurt Europe.
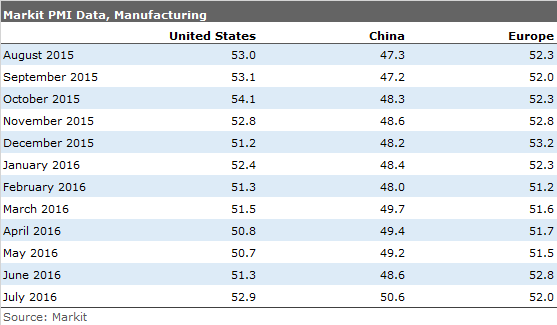
Europe's PMI reading fell just modestly from June's unusually strong 52.8 reading to 51.9, which was more in line with readings earlier in the year. New order growth and poor results from France and Greece seemed to be the biggest factors in the decline. Germany did exceptionally well, helping offset those weaknesses elsewhere, but raising the issue of a lopsided European economy leaning toward Germany. However, French labor actions and terrorism may have weighed on the French data. Positively, the employment section remained unusually strong, still very near a five-year high. Better employment could help strengthen internal demand in Europe.
China saw its first reading above 50 for the first time since February 2015, which is very welcome news. Like Europe, the best of improvements were from internal demand, likely stemming from supportive fiscal and monetary policies. New order growth suggests that more improvement could come in the months ahead.
According to Markit, the U.S. also picked up steam in July, moving from 51.3 to 52.9. Orders, employment, and production were all up. New orders made a nine-month high. Even export orders looked better, according to Markit. These new orders led to higher backlogs, which should also help in the months ahead.
ISM Version of U.S. Manufacturing Showed Slower but Acceptable Growth The purchasing manager report from the ISM, our preferred metric in the U.S., was not as bullish in July, posting a decline from 53.2 to 52.6. The absolute reading isn't much different from Markit's (52.9), however, the ISM picked up on the improving trend earlier than Markit, with a definitive bottom in April. So after some divergence both indicators are saying about the same thing. Lower inventories are the prime item holding back both reports. In the case of the ISM, inventories have now shrunk for 10 months in a row. However, the reading was less bad in July with a reading of 49.5; that's an improvement from June and from the 45 level reached in May. This will be good news for the GDP growth calculation, which was cut in half in the second quarter (from 2.4% to 1.2%) by shrinking inventories. New orders also still looked strong, suggesting more good months ahead.
The ISM also did a great survey on Brexit. As we suspected, most participants had some level of concern but saw little if any impact on their own business. Most seemed worried that others might be worried, which seems to characterize a lot of what we are hearing. “I'm fine, but worried about what everyone else might do.” The one legitimate concern raised by about a third of the participants was that a stronger dollar resulting from Brexit wouldn't help already weak exports.
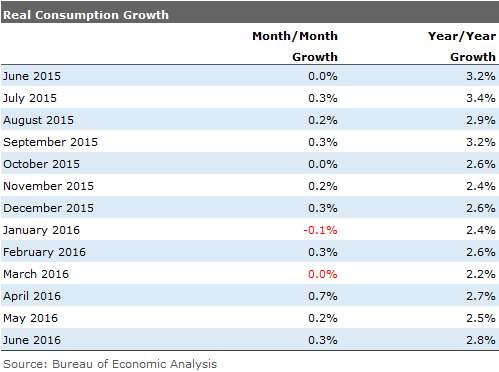
Consumers Pick Up the Pace Even as Incomes Slow a Bit The one real bright spot of the second-quarter GDP report was consumption growth, which was reported as 4.2% sequential growth, a remarkably high level. Though, the year-over-year growth rate was a more modest 2.7% as shown by the orange line below. Year-over-year data has slowed some over the last 18 months with slowing employment growth. Consumption also got a bit of an artificial boost in 2015 from a very easy comparison with weather addled data from the horrible winter of 2013-14. Likewise a shift from unfavorable to favorable weather conditions in the second quarter helped the June and second quarter consumption reports. Given the strong employment report for July (both hours and wages) we suspect the sharply slowing wage growth line will turn on a dime in the third quarter. (Second quarter wage and income growth was depressed by the flaky May employment report that showed almost no employment growth, which has been quickly reversed and then some in June and July. That will likely keep consumption growth rolling in the months ahead. And with a lot of the potential income growth coming from the lower income quartiles, we suspect a greater percentage of overall income will get spent.
- source: U.S. Bureau of Economic Analysis
Pattern of Sequential Quarterly Consumption Growth May Be Hard to Maintain We do think year-over-year income and consumption data will rebound soon on a year-over-year basis. Still, those year-over-year rates aren't likely to get too much over 3%, likely making it difficult to sustain sequential annualized growth rates of 4% for consumption. So consumption, while still the key driver of economic activity in the second half, is likely to be more muted than in the second quarter.
Despite July Rebound, Year-Over-Year Sales Growth in Plateau Mode
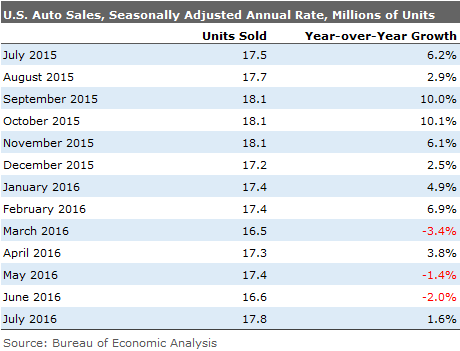
As we had suspected for some time, auto sales growth continues to plateau as sales have returned to prerecession highs, likely limiting auto sector growth to population growth and market share that can be stolen from foreign-made autos. The July data was somewhat better than expected and certainly the prior two months that witnessed year-over-year declines, as shown above. Though, the July data was helped along by the inclusion of five Sundays in the monthly report, which tends to give the data an artificial boost. Year-to-date auto sales are up just about 1%, well below the 5% level of the past two years. Given the strong second half last year, the industry will count itself fortunate if it can hold sales flat for the entire year. We had hoped for 2%-3% growth, but that now looks to be a stretch. Unfortunately, that nonexistent growth will likely hold back consumption, investment and GDP growth. Over the past four years GDP growth has contributed between 0.14 and 0.31% to GDP. Though auto sales won't be much help to the calculation, slower recent results are more an issue of saturation than consumer sentiment. The one exception being high-end buyers who continue to see poor investment results and slower profit growth. Almost all luxury brands had a bad month, with Lexus down over 6%.
/cloudfront-us-east-1.images.arcpublishing.com/morningstar/GJMQNPFPOFHUHHT3UABTAMBTZM.png)
/cloudfront-us-east-1.images.arcpublishing.com/morningstar/ZYJVMA34ANHZZDT5KOPPUVFLPE.png)
/cloudfront-us-east-1.images.arcpublishing.com/morningstar/LDGHWJAL2NFZJBVDHSFFNEULHE.jpg)