
Will China's Malaise Spread to the U.S. Economy?
Strong U.S. employment growth stands in stark contrast to Chinese market woes.

This week's market action was really all about China. The pain was widespread, as most equity markets were down 6%-9% since Dec. 31, 2015--drops that look more like monthly or even annual data.
As one might guess, China problems had the most knock-on effect on other emerging markets, which were down 9%. Europe and the U.S. were both down about 6%. With new fears out of the Middle East and colder weather in the central U.S., commodities did the best of a very bad lot, falling "just" 4%. Of course, safe-haven bets and slower world growth outlooks drove the interest rate on 10-year U.S. Treasuries down from 2.27% to 2.13% since the end of 2015, making bonds the only real winner this week.
Data out of China indicated that the Chinese economic malaise hasn't been broken. And like the oil industry, the China issue will probably be modestly worse than expected and last longer than thought just a few months ago. There's no quick rebound in the cards, either. That fact was driven home by a pair of purchasing manager reports that resumed their declines in December after a couple of more promising months.
Fears of lifting the ban on large institutional selling in China, which was scheduled for this week, didn't help stock market matters. Worries over the impending lifting of the ban caused some investors to begin precautionary selling in front of a potential large wave of institutional selling at the end of the week. The flood of precautionary selling prompted authorities to reverse themselves as they severely limited how much stock could be sold by later in the week when the old ban was set to expire. So much for open markets.
Speaking literally of open markets, Chinese market circuit breakers, which closed markets after certain percentage declines, amplified declines early in the week. Here too, authorities reversed course and abandoned the circuit breakers and the closings. Regulators, who could do no wrong, now looked like the gang that couldn't shoot straight. Falling confidence is never a good thing and certainly was behind a good deal of the decline, in our opinion.
While the Chinese economic news this week wasn't great, it wasn't terribly different from what it has been for most of the past year. However, the large market declines forced occasionally oblivious investors to look at core fundamentals that haven't been wonderful for some time.
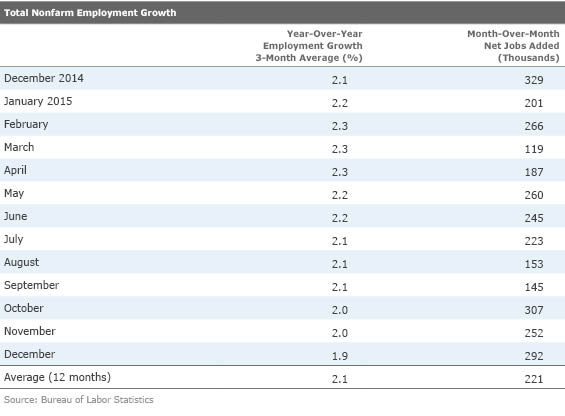
U.S. economic news took a back seat to China. That is too bad because the news--especially the employment news--closed out the year on a very impressive note, with 292,000 jobs added in December and hefty revisions to the two prior months that placed those two months close to the 300,000 mark. That is way above the 223,000 12-month average.
Seasonal factors haven't yet caught up with the shifting seasonality pattern, so the back part of the year has looked better in recent years. Therefore, we suspect job growth will drop back to the 220,000-240,000 level over the next several months. A couple of special factors explained below may have helped the numbers a bit, too. Nevertheless, the Chinese malaise doesn't appear to have spread to the U.S. just yet.
The trade deficit for November looked better (smaller than expected), and trade doesn't look like it will detract much, if anything, from the fourth-quarter GDP report with two months of the quarter behind us. Unfortunately, the composition of the report wasn't great, as the improvement was a result of imports falling faster than exports. That certainly isn't good news for either U.S. trading partners or U.S. manufacturers.
The monthly construction report, while modestly down month to month, saw a lot of past data revised surprisingly higher. Apparently a population model shift caused a large error in calculating home remodel expenditures. Though the impact in 2015 isn't likely to be too large, overall GDP growth for 2014 should eventually be restated up by at least 0.2% from the previously estimated 2.4%, a very healthy adjustment at this late date. Exactly when that adjustment will be made wasn't clear, though.
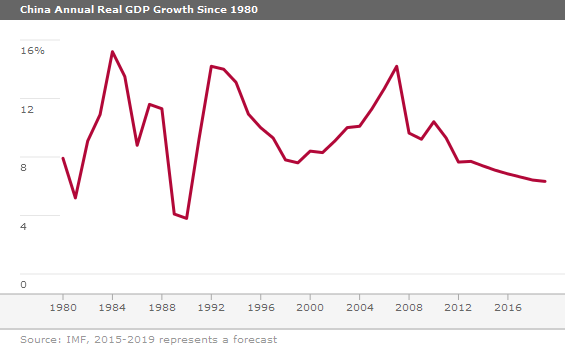
China Fears Take Hold, but the U.S. Impact May Be Small China has been struggling for the past couple of years as growth has slowed dramatically, falling from 10%-12% GDP growth rates after the Great Recession to 6%-7% currently. The low of large numbers (years of high growth have made China the world's second-largest economy, behind the U.S.), slowing population growth, and a shift to a more consumption-based economy have combined to reduce the long-term growth outlook.
It is far easier to grow infrastructure and investment spending via edict and the use of extensive debt. The debt, which is normally widely available for long-term investment projects with identifiable returns, amplifies a country's growth rate. However, it's trickier to convince Chinese consumers to lever up and buy when the social safety net is still relatively weak. The Chinese are prodigious savers, and making them spend those savings is a tough sell.
The volatile stock market of the past year, in addition to a lackluster housing market, probably isn't making the consumer feel any better about spending. Given the relative overexpansion and excess capacity in some industries, high corporate debt levels, and environmental concerns, it will be hard to return to a faster-growth investment-oriented economy. There really is no going back to a fixed-investment high-growth-oriented economy.
Over the longer term, the moves toward a more streamlined industrial economy and a better balance among consumption, investment, and exports are good things, as is slower, more sustainable growth. That said, the market is exceptionally fearful that the government might not perfectly engineer the transition, and China's economy could have a hard landing. It doesn't help that a lot of investors don't trust Chinese economic statistics.
Yet, even those Chinese government statistics didn't look so good this month, setting off another round of stock market declines. Circuit breakers, which closed markets when certain loss percentages were incurred, seemed to compound and not help the markets as everyone raced to sell stocks early before markets closed for the day. That also raised doubt that Chinese authorities could control markets at will.
The particular data set that sparked this week's panic in China and around the world was yet another decrease in the Caixin Purchasing Manager Index. The index hadn't been doing very well for the past year and a half, as shown below. A reading below 50 means more managers are seeing slowing in their businesses rather than expansion. However, investors seemed hopeful as the index began to stabilize in September and improve in both October and November. Europe seemed to be picking up steam and the U.S. economy was looking good, so investors felt that things were on the mend. Therefore, a renewed decline, though small, was similar to being hit by a very unexpected bucket of cold water.
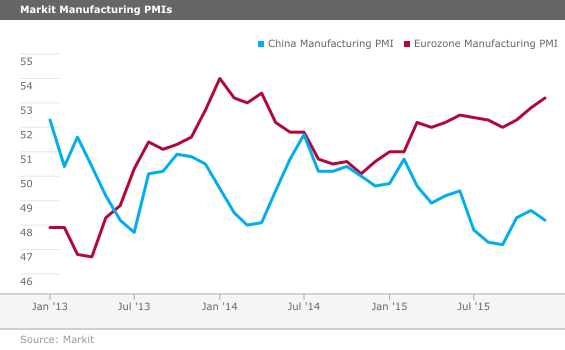
Adding fuel to the fire, the services version of the Purchasing Manager Index fell even more rapidly than the manufacturing data, setting off more declines just a couple of days after the release of the manufacturing data. At a minimum we can say China's economy is not thriving like it once was, and that certainly means slower world growth given China's position as the world's second-largest economy.
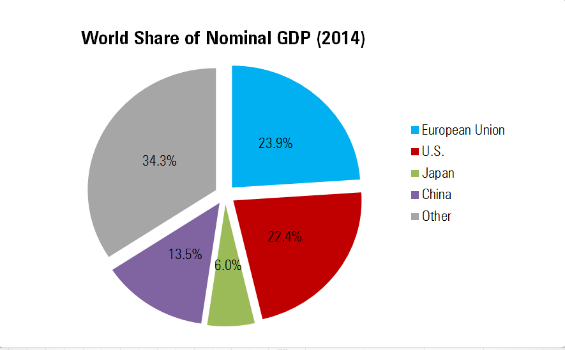
Conversely, China's direct impact on the U.S. economy is minimal. Just as China boomed after the Great Recession while the U.S. languished, we suspect that the U.S. will not have a bust, even if China does. Exports to China represents less than 1% of U.S. GDP. Mexico, Canada, and even Europe are bigger importers of U.S. goods. That said, there could be second-order effects as the Brazils and Canadas of the world are affected by China. And these economies have importance to the U.S.
Lower prices resulting from slower Chinese demand are a mixed bag. They are a boon to the U.S. consumer but not great news for anyone dependent on the commodity complex. Certainly this has hurt a lot of companies that process and ship commodities (railroads,
We also note that a weakening China and commodity complex have been an ongoing theme for at least a couple of years. Meanwhile, Europe, even in the manufacturing sector, has seen improvement over the same time frame. The broader European economy has lifted out of a recession, too. Meanwhile, the U.S. has seen relatively stable annual GDP growth rates since 2010 even in the face of big ups and downs in China. In fact, 2011, one of China's best years for GDP growth (9.3%), was one of the worst for the U.S. (1.5%). The past three months of employment data suggest China hasn't ruined things for the U.S. or Europe. The greater impact will be on other emerging-markets economies that are more dependent on China.
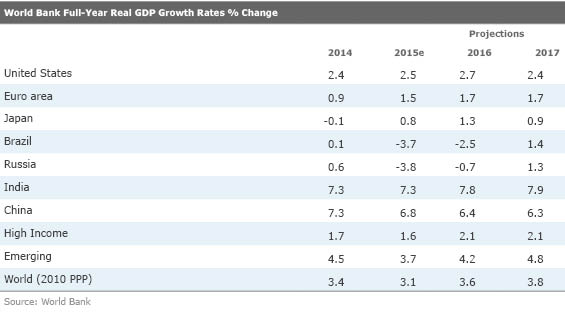
Indeed, the World Bank reduced its world growth outlook for 2015 by 0.3% and 2016 by 0.4% just this week. Emerging-markets projections were cut a larger 0.5% and 0.7%, respectively. Meanwhile, high-income countries' rates were cut by a more modest 0.2% and 0.3% for 2015 and 2016. Its table of world growth projections appears below.
Great December Employment Growth Not Sustainable Over the Longer Term The headline employment figures for December were excellent with 292,000 nonfarm payroll jobs added compared with expectations for just 215,000 jobs. Furthermore, October and November were revised up by over 50,000 jobs. Job growth for the past three months of the year averaged 284,000 versus the full-year average of just 223,000.
Not wanting to be a killjoy, but we still believe a portion of the heady growth of the past three months of the year is likely a result of some faulty seasonal factors, warm weather, and a few events that are unlikely to recur (15,000 motion picture jobs, 45,000 construction jobs, and 25,000 courier jobs). We also note that both November and December job growth was below the levels of a year ago. Still, the great year-end close makes us feel more comfortable with our job growth forecast of 220,000-240,000 (that's 1.9% growth, nearly identical to the growth rate in 2015) that is in turn consistent with our GDP growth rate of 2.0%-2.5% for 2016. In other words, the report is not a sign that the economy has reached some kind of escape velocity that is likely to panic the Fed into faster rate hikes. Nor should investors expect job growth of close to 300,000 workers in the months ahead--that would imply almost 3% GDP growth, which doesn't seem in the cards to us.
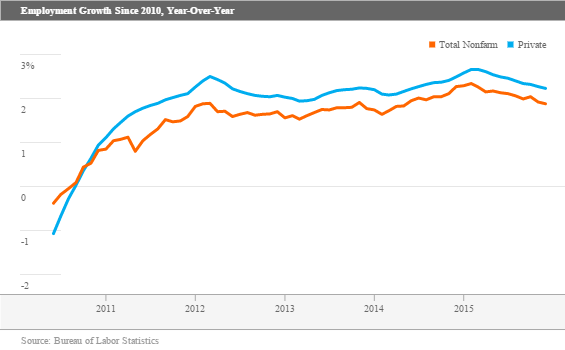
Monthly Employment Trends Remain Volatile, Year-Over-Year Data Rock Steady We also would like to remind readers that monthly jobs are highly volatile, and the volatility works both ways. Right now, it's working in employees' favor. By the middle of the year and certainly by August, the volatility typically works in the other direction, even as broad, annual growth remains stuck at 2% or so.
Wage Growth Data a Mixed Bag as We Lose Faith in This Metric Despite the basically unchanged hourly wages between November and December, the three-month averaged, year-over-year data continues at a very healthy 2.4% pace with little inflation. Our guess is that rate could move higher in 2016 as labor shortages from a shrinking labor pool move wages higher, though most likely higher inflation will eat up a lot of the gains by the middle of the year.
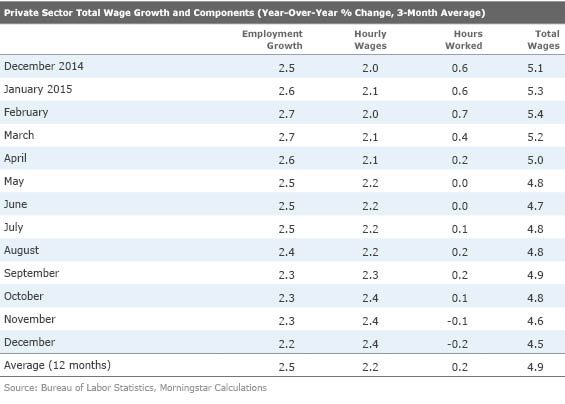
We are beginning to have some doubts that this hourly wage data is really the best indicator of "true wages." As baby boomers retire, they are being replaced by younger workers who generally don't make the same amount of money as an older person doing relatively similar work (many pay systems are still time-of-service based). We also worry about the impact of year-end bonuses replacing hourly wage hikes. The signing bonuses in the recent auto industry settlements were quite large, and other industries are seeing some of the same trend. And there are mix issues as more job growth is generated in the lower-wage services sector. Again, from a total economy standpoint, the current measure is just fine for determining weekly cash available for consumption spending. Still, it's not a great indicator of wage trends in the short run or individual employee bargaining power.
Employment Sector Data Confirm Primary Economic Themes Sometimes the sector employment data leads and lags the real world, making sector trends hard to determine. However, this month the employment data matched anecdotal evidence and other economic metrics to paint an extremely coherent picture.
Manufacturing added a measly 8,000 jobs in December and virtually no jobs for the entire year. That is consistent with manufacturing industrial production increasing about 1% on the year. While things in manufacturing aren't great, there aren't mass layoffs or any efforts to shed employees, indicating that manufacturing is not in some horrible free-fall. In fact, manufacturing employment, like a lot of other manufacturing data, bottomed in August and has shown small improvements ever since.
However, the headline category data for manufacturing for the year hides some dismal news for more export-related categories (machinery and most metals-related categories). News of some categories with a more domestic focus (plastics, chemicals, and perennial overachiever autos) making some nice gains offset the grim news in the more export-oriented categories. The food industry also had a nice rebound right at the end of the year, most likely driven by the lower prices for commodity inputs. Surprisingly, the food industry is the second-largest employer in the manufacturing sector, neck and neck with the transportation sector.
Of course, the mining sector had another terrible month, losing 8,000 jobs for the month and a more grim 131,000 jobs for the year. The declines were broad-based and not limited to oil and gas extraction but spread to coal and mined metals.
As one might suspect from all the news about poor holiday sales, retail jobs data was one of the big disappointments of December, gaining just 4,000 jobs versus monthly averages that are closer to 30,000. Warm weather shellacked clothing retailers, which lost 17,000 jobs in the month. Department stores shed 5,000 jobs, probably for similar reasons plus online competition. Auto dealers, specialty retailers, and online retail employment saved the day with healthy gains to offset all of the other retail job losses and then some. Reinforcing the online sales trends was the fact that courier employment jumped by 25,000 jobs in December, an event that is not likely to be repeated in January.
On the other extreme, construction also had both a nice December and full year, with employment increases of 45,000 and 273,000, respectively. Warm weather certainly hasn't hurt the data, but both November and December of a year ago were also unusually warm months. Although volatility in a lot of construction data has made it more difficult to discern trends, relatively steady gains in employment across both residential and nonresidential construction seem to indicate a relatively healthy construction market that is still going strong.
Government also had a good year and a good month, adding 17,000 jobs in December and 110,000 jobs for the year. We say good because the sector lost jobs for every single year between 2009 and 2013 and just 74,000 jobs in 2014. Nevertheless, the 0.5% year-over-year government growth rate is pathetic compared with long-term averages in the 2.0%-2.5% range. As a point of reference, private-sector growth was greater than 2%. Government outsourcing, slower housing market growth, and fewer students to educate as well as more pension-related spending growth have all hit this category hard.
Auto Sales Better Than They Look Normally, a 17.2 million seasonally adjusted annual sales report for the auto industry would be something to celebrate, but after three months of reports showing sales over 18 million, the December report seemed a bit disappointing. However, those annoying seasonal factors may be playing some role here, helping some months and hurting others. Increased sales of light trucks (vans, SUVs, and crossovers) at the expense of conventional autos certainly hit the December data hard, but helped earlier months. The seasonal factor for autos is about one, while light truck sales are reduced by 20% from reported figures because trucks historically sell better than cars in December. (This is because of a combination of bad-weather influence and small-business owners taking advantage of tax credits right at the end of the year.) With a lot of the sales growth in December coming from crossovers, which are more like normal autos, those seasonal factors were likely overblown.
Selling day issues (few in November and a lot in December) also weighed on the data. One of those extra days was Jan. 3, the Monday after New Year's (yes, the December sales month ends in January), which probably didn't see many vehicle sales but still counts as selling day, reducing the daily sales rate and the SAAR.
The slower December SAAR will potentially weigh on retail sales next week. However, a favorable mix shift in December to retail (versus fleet vehicles) could limit the damage to the sequential retail sales report. Additionally, a shift to more expensive light trucks away from autos and relatively low incentives could cushion the blow of a SAAR that will move from 18.1 million units to 17.2 million units. Remember, this is a seasonal factor effect, and the reality is that October and November weren't as strong as they looked, statistically, and December was not a fall off some proverbial cliff. The full-year sales data probably provides a more realistic picture of the auto industry than the messed-up monthly numbers
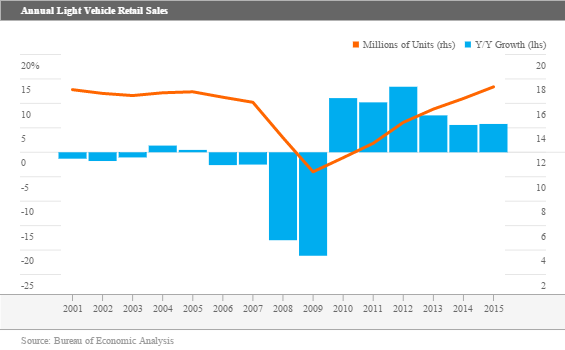
Auto sales increased about 6% for the year, outpacing growth in 2014. We began the year thinking sales would grow only 2%-3%. Sales for the year were at the best annual rate since 2000 aided by low gas prices, aging vehicles, and attractive financing deals. Neither crazy-high incentives nor big sales to rental companies artificially inflated the 2015 data set, as they often have in the past.
On Tap for Next Week: Retail Sales and Industrial Production (by Roland Czerniawski)
Next week will give us a closer look at how consumers handled the year-end holiday season. Based on the employment report and reports from major retailers such as
The retail sales report is tricky to analyze because it is not adjusted for changes in prices. Price fluctuations, which tend to vary from one holiday season to another, could distort the picture. Also, gasoline prices were down again in December, which will definitely bring down the headline number by some margin. The consensus calls for negative 0.3% (headline) retail sales change in December, and 0.2% improvement excluding autos. Those numbers don't seem far off from our views--the sharp price declines could cause the headline number to be lower than expected. To make any firm conclusion, we will have to wait for the CPI report the following week. Retail sales are not adjusted for inflation, but the consumption report that is due even later in the month is.
Furthermore, next Friday we will get the latest data for industrial production. The consensus calls for a 0.3% decline due to expected poor performance from utilities (warmer weather) and the continued mining sector slowdown. Based on employment report data, though, it appears the manufacturing component of industrial production should stay flat in December.
/cloudfront-us-east-1.images.arcpublishing.com/morningstar/T5MECJUE65CADONYJ7GARN2A3E.jpeg)
/cloudfront-us-east-1.images.arcpublishing.com/morningstar/VUWQI723Q5E43P5QRTRHGLJ7TI.png)
/d10o6nnig0wrdw.cloudfront.net/04-22-2024/t_ffc6e675543a4913a5312be02f5c571a_name_file_960x540_1600_v4_.jpg)