
Economic Outlook: Escape Velocity Not in the Cards for U.S. Growth
Slowing population growth rates and an aging population make it unlikely that the U.S. or any developed market can ever again reach sustained 3%-plus growth rates.

- We are forecasting 2.0%-2.5% GDP growth for 2016, lower than most other economists predict, mostly driven by the consumer with little help from other areas of the economy.
- As we lap some of the biggest energy price declines, we suspect headline inflation could easily approach 2.5% by the end of 2016.
- We think analysts are overestimating starts and underestimating home-price appreciation again for 2016.
- U.S. population growth has collapsed from 1.8% in the 1950s and 1960s to 0.7% currently, which is closely correlated with slower GDP growth rates.
- At just over 3.4% year-over-year, slow credit growth is continuing to hold the economy back.
Our economic forecast for the year ahead isn't much different than our forecasts for the prior three years, namely 2.0% to 2.5% real GDP growth for the U.S. economy. That growth will again be driven by the consumer, with not a lot of help from the other major components of GDP. Government spending will be limited by extreme pressures not to raise taxes and being forced to spend more money on transfer payments and less on goods and services that more directly benefit growth.
Shifts away from brick-and-mortar stores and the rethinking of office space, as well ongoing issues in oil drilling, mean business investment spending won't provide much help, either. Net exports will likely remain a small negative as slow world growth, ongoing issues in the commodity complex, and a strong dollar will all hurt exports, while consumers are likely to snap up ever-cheaper imported goods. Residential spending should continue to add a few tenths of a percent to GDP growth, but our belief is housing growth will not accelerate from current levels.
All in, our 2.0%-2.5% growth rate is lower than the 2.5%-3.0% growth that the Fed and most economists are estimating. Over the past few years, most forecasters have believed that growth would accelerate in the year ahead, with the economy reaching some type of escape velocity and eventually a 3.0%-3.5% growth rate, if not more. However, both slowing population growth rates and an aging population make it extremely unlikely that the U.S. or any developed market can ever reach those types of growth rates on anything but a very short-term basis. That is part of the reason that economists have had to scale back their cheery December forecasts, often as soon as the following March.
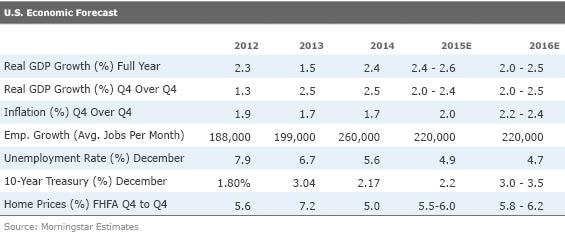
Most of our other forecasts fall out of our low GDP growth predictions and the aging population dynamic. For example, employment growth generally trails GDP growth as office and factory workers become more productive. Looking ahead to 2016, we expect employment to grow at 1.9%, which is slower than our 2.25% central tendency GDP forecast for 2016, because of that productivity factor. That percentage converts to the more commonly reported 220,000 jobs per month, or 2.6 million per year. That growth is likely to favor services jobs over manufacturing and government in the year ahead.
Interestingly, because of the dynamics of a shrinking working-age population, the rate of unemployment fell much faster than expected in 2015 to 4.9%, even though most forecasters overestimated the number of jobs per month that would be added. A combination of retiring baby boomers, teens staying in school longer, and skills or wage mismatches have caused some potential workers to drop out of the job market. Those same phenomena are likely to drive unemployment even lower in 2016, even though overall economic and employment growth rates are unlikely to get much better next year.
Core inflation has been relatively tame over the past three years (excluding food and energy), at just under 1.7%, with some pick-up in 2015 to 2.0%, due to rising rents and increased healthcare costs. Those same dynamics, plus increased shortages of workers, could push core inflation even higher in 2016, to the 2.2%-2.4% range.
Falling oil prices have largely masked the steady increases in services inflation in 2015. However, as we lap some of the biggest energy price declines, we suspect headline inflation (food, energy, and everything else) could easily approach 2.5% by the end of 2016. A geopolitical event or OPEC clamping down on production could push overall inflation closer to 3%.
The demographics of spenders and slow growth overall should keep inflation from getting out of hand. Still, 3% inflation could be a bit of shock to some. All in, 4% inflation is usually when big economic problems set it in. Hopefully, things won't get that bad in the short term.
The housing market, though improved, was a disappointment in 2015, with housing starts falling almost 100,000 below the consensus forecasts of 1.2 million units. Weather, worker shortages, and a lack of available land all weighed heavily on housing starts. Lower-than-expected housing starts are why most GDP forecasts were too aggressive for 2015.
The shortage of new homes caused the prices of existing homes to go up almost 6% in 2015, handily outpacing the consensus forecast of under 4% price appreciation. We think analysts are overestimating starts and underestimating home-price appreciation again for 2016. Ramping up housing production is not easy. And where housing demand is high, there are few available lots to build on. That problem is particularly visible in California and New York City.
Although we've had three years of good GDP forecasts, our calls on interest rates have not been as accurate. We have always believed bond yields would be some type of spread above inflation. For example, we believe that the 10-year U.S. Treasury rate should be about 2% above inflation. We thought inflation would be about 1.5% in 2015, for a total forecast of 3.5%. Instead, headline inflation for 2015 will be well under 1%, due to falling energy prices. And the Fed delayed starting interest rate normalization until the very end of the year (versus March or June expectations) because of an economic slowdown in China and other commodity-related emerging markets. Easy monetary policies in other world economies also kept U.S. rates lower than they would have been otherwise. With the normalization now started (and we expect several more Fed rate increases in 2016), and inflation moving modestly higher, we continue to expect the 10-year Treasury rate to be at 3.0%-3.5% by the end of 2016.
Population Growth Slowing Not Just in the U.S. But Around the World (by Roland Czerniawski) We have previously produced a lot of charts showing how dramatically population growth has slowed in the U.S. through a combination of slower immigration rates and lower fertility rates. U.S. population growth has collapsed from 1.8% in the 1950s and 1960s to 0.7% currently. That diminishing population growth is closely correlated with slower GDP growth rates. Unfortunately, the U.S. is not alone. Population growth globally has slowed just as dramatically.
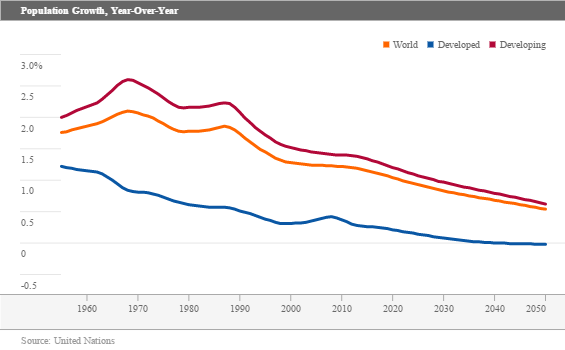
Going back to 1955, developing economies (also known as emerging markets) were in the midst of a population boom that culminated in a peak population growth rate of around 2.5% in the late 1960s. At the same time, developed economies were already experiencing a decline from a modest 1.2% rate. It is worth mentioning that in the 1950s, developed economies accounted for about 30% of the world population, while emerging markets comprised the remaining 70%.
The following decades have seen a gradual decline in population growth rates in both developed and emerging economies, caused by gradually declining fertility rates. The average number of children per woman declined from a world average of 5 in the 1950s to 2.5 in 2015. As a result, today's world population growth rate stands at around 1.2%. Current population growth for developed economies is even lower, as fertility rates in many European countries and Japan have declined dramatically.
Developed economies make up only 16% of today's world population, no longer the 30% of the 1950s. The United States accounts for about a quarter of the developed-world population, and among those nations, it has above-average population growth, which today stands at around 0.7%. This makes the U.S. long-term economic outlook more favorable compared with most developed economies.
Going forward, fertility rates are expected to decline further, and world population growth is expected to fall to 0.5%, while population growth for the developed economies is expected to dip into negative territory in the late 2040s. This already has and will continue to be a long-term headwind to global growth. Without much help from population growth, the world will have to rely on increased productivity in order to maintain current growth rates.
Slow Credit Growth Is Continuing to Hold the Economy Back While one can argue about the virtues of debt, without debt to amplify incomes, overall economic growth is considerably lower than it would be if debt were growing at a sensible level. Although debt levels that get out of hand are damaging, shrinking debt levels aren't all they are cracked up to be, either, because that means the economy will generally grow more slowly than incomes if debt is falling.
The Federal Reserve provides aggregate debt data that includes household debt, business debt, and even government debt. Business, federal government, and consumer debt levels are approximately equal, and the state and local government sector is 80% lower than the other three sectors.
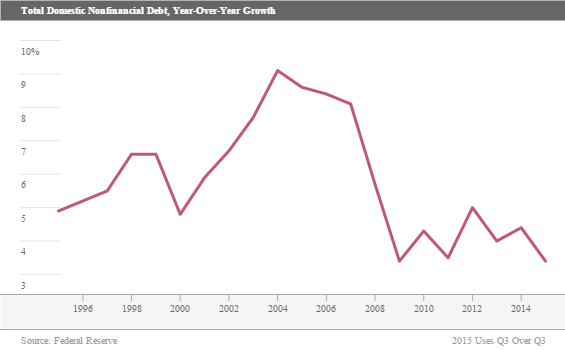
Clearly the 9% debt growth recorded in the early 2000s was not sustainable or healthy. Those high debt growth rates at least partially explain why overall GDP and consumption growth looked relatively healthy, despite very poor wage gains. Now things have swung in the other direction, with recent debt growth at just 3.4% year over year.
Of the four major segments, only business debt is growing at its long-term average rate (about 7%). Combined, governments (federal, state, and local) are growing at under 2%, below long-term averages that are closer to 6%. Even household debt growth is running at only 2.1% currently, as the mortgage debt growth portion remains nonexistent. (Some other consumer debt is beginning to increase at more normal levels.) Even some of the business debt growth is suspect, because many of the proceeds from bond offerings, made opportunistically to take advantage of favorable exchange rates and interest rates, are still sitting on corporate balance sheets doing little to support economic growth.
Again, we are cognizant that too much credit and debt is not a good thing, but nonetheless it looks as if slow credit growth is continuing to hold the economy back. The annual 3.4% credit growth appears to be below the combined total of real GDP growth of 2.5% and inflation of 2% for a total of 4.5%, which seems to be a fair approximation of how fast debt should grow if it were at optimal levels.
Anecdotally, some areas of the economy have had easy access to credit and are returning to normal (autos), while tight credit has kept the housing industry running at only half of its all-time high. A modest easing of credit terms could prove to be a big help for the economy, if not taken to extremes.
Sector Reports Highlight Commodity Complex Issues, Extreme M&A Activity, Emerging Markets Many of our quarter-end sector reports highlight the effects of a slowing commodity complex--much of that stemming from a slower-growing China. Unfortunately many countries and companies are seeing the unexpected side effects of cheaper oil and cheaper goods in the form of fewer exports and a softer manufacturing sector. Consumer savings haven't yet fully offset some of these negative effects.
Many of the sector reports indicate that emerging markets and commodities could get a little worse before they get better, but dirt-cheap commodities can't last indefinitely. China is still a land with a lot of growth potential. In addition, while a lot of commodity-oriented emerging markets are doing poorly, many others are net commodity importers and could potentially do better going forward, including India. One label for all emerging markets doesn't help investors very much anymore.
Our analysts also continue to discuss all the mergers and acquisitions as well as stock buybacks. Corporations continue to generate a lot of cash and have ample borrowing facilities. Unfortunately, low growth rates and more interest in services than manufacturing are causing businesses to limit (or not need to make) capital expenditures. Instead they are deploying that cash buying competitors or their own stock. With such low interest rates, those activities can quickly enhance short-term earnings without all the risks of a new greenfield plant. However, that doesn't do much for GDP and employment growth.
More Quarter-End Insights
Market Outlook: Late-Cycle Behavior?
Credit Markets: Volatility and Spreads to Remain Elevated
Basic Materials: Fates Tied to Faltering China
Consumer Cyclical: Consumer Volatility Creates Investment Opportunities
Consumer Defensive: Bargains Harder to Come By
Energy: Pain Persists as OPEC Refuses to Play White Knight
Financial Services and Real Estate: Fiduciary Standard Rule Could Have Drastic Impact
Healthcare: Even After Uptick, Some Great Values Remain
Industrials: Unsettled Global Economy Serves Up Individual Stock Bargains
Tech & Telecom: Cord-Cutting and Programmatic Advertising Trends Continue
Utilities: Don't Fear the Fed--Yield and Growth Still Look Good After 2015 Slump
/cloudfront-us-east-1.images.arcpublishing.com/morningstar/AGAGH4NDF5FCRKXQANXPYS6TBQ.png)
/cloudfront-us-east-1.images.arcpublishing.com/morningstar/ZYJVMA34ANHZZDT5KOPPUVFLPE.png)
/cloudfront-us-east-1.images.arcpublishing.com/morningstar/QFQHXAHS7NCLFPIIBXZZZWXMXA.jpg)