
The Demise of Consumer Spending Was Greatly Exaggerated
Investors got the Goldilocks retail sales report that they had hoped for--not too weak and not too strong.

Although there were volatile days, most world markets barely budged this week, with a slight bias to the upside--at least until a relatively poor Friday performance. Most world equity markets were up less than 1% for the week as a whole. Bond rates were tame this week with little change after rates soared over the previous several weeks.
A flight to quality related to an unsettled Greek situation pushed both German and U.S. 10-year bond rates back down this week even as Greek and Spanish yields moved higher. Despite a sloppy oil market, commodities were up a little for the week, too. With earnings season all but over and the Fed meeting scheduled for next week, markets had little to move them other than the ongoing Greek circus.
Although U.S. economic news was on the light side, most of the news was surprisingly bullish. Retail sales came out of their funk, increasing by 1.2% month to month and several previous months were revised higher, so the consumer is indeed still breathing. Expectations were for an even bigger increase in retail sales, but bond and stock markets didn't have a big reaction to these unusually large gains. Nor were the retail gains big enough to scare the Fed into action at its meeting next week, in our opinion.
Employment data from the NFIB Small Business Sentiment Report and Job Openings report confirmed that May's strong employment report was no accident. Both reports also suggested brewing labor shortages, which the mainstream financial media now seem to be picking up on. The Wall Street Journal focused on construction workers this week with the catchy headline of Worker Shortage Hammers Builders.
Besides a better job outlook, consumers, especially wealthy ones, saw yet another nice increase in their net worth during the first quarter. Total net worth was about $84.9 trillion or over 6 times consumer incomes. That represented an increase of $1.3 trillion from the previous quarter. That should in turn fuel even more spending for the rest of the year. Consumers remained incredibly cautious with their finances as total consumer debt increased just 2.2% as mortgage debt showed an outright decline for the quarter.
Retail Shows That Consumers Aren't So Scared After All With a lot of mixed economic data recently, investors were focused on the retail sales report for May that was released on Thursday. Investors got the Goldilocks report that they had hoped for: not too strong and not too weak. Poor retail sales might have indicated that the U.S. economy was losing steam, while too strong a report would have spooked bond investors, worried that the Fed might raise interest rates sooner than expected.
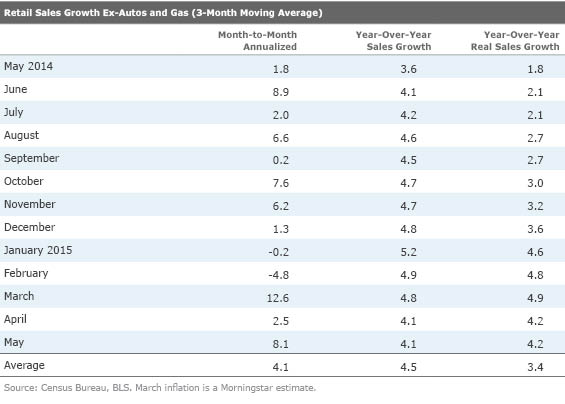
The headline growth rate of May retail sales was 1.2% and was 1.0% excluding auto sales (14% and 12% annualized). While these numbers may look to be on the too-high side, one must remember that some of the winter months showed outright declines, and May's data represented a weather-related bounce.
The year-over-year data shows that noninflation-adjusted retail sales growth continued to track in the 4%-5% range (excluding autos and gasoline). Even excluding gasoline and autos, as we always do, the month-to-month numbers still are on a yo-yo, despite the near straight-line performance of the year-over-year numbers. Given the relative stability of the year-over-year growth numbers, we never panicked over the data in January, February, and April, nor did we pull out the Champagne in March or now in May.
The low month-to-month growth in April (from the prior report) still remains a bit of a puzzle, but we think exceptionally high tax bills (investors had to dish out a lot of cash in April to pay their 2014 capital gains and bonus-related taxes) are part of the explanation. In addition, sky-high utility bills for energy used in February were also probably due in April, depressing retail sales as well.
The strong headline retail sales data excited at least a few investors and convinced them that a new wave of growth is just around the corner. However, we caution that the data shows the same slow and consistent growth on a year-over-year basis as it has for several years. If anything, the year-over-year retail data suggests that things might be slowing just a little. That and the fact that the headline retail sales number was just below consensus estimates (1.2% versus 1.5%) kept the bond bears from being more punishing than they were earlier in the week, when the remarkably strong Job Openings Report was released.
Revisions to March and April Data Suggest the Economy Was Stronger Than Expected in the First Quarter Besides the strong May sales, March sales were revised sharply upward, now showing month-to-month growth of 1.5% (up from 1.1%). This is likely to mean a modest (probably less than 0.1%) upward revision to first-quarter GDP. April was revised less dramatically to 0.2% from 0.0%, but nevertheless gets the second quarter off to a better-than-expected start. In fact, the two revisions should enable GDP growth in the second quarter to exceed our 2.5%-3.0% estimate. All that hand wringing over the consumers' new-found thriftiness might have been overdone after all.
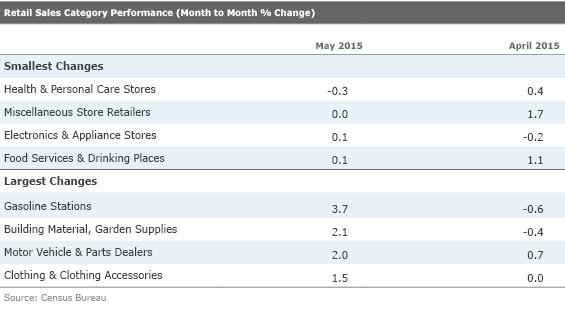
Retail Sector Data Suggest the Bad Did Better and the Good Did Poorly As is often the case, the sector data is even more volatile than the headline number (and more dramatically revised in subsequent months). In one unusual case, the furniture category was moved from a big loss to a big gain, changing the overall storyline for the past few months. Nevertheless, we are showing the monthly winners and losers to demonstrate how winners from one month can turn into pigs the very next month. For instance, drugstores swung from a 0.4% gain in April to 0.3% shrinkage in May. The swing in restaurants was even more violent. Meanwhile, building materials swayed even more violently in the other direction.
One category that seems to be a persistent loser isn't a failure, on closer examination. Electronics, which shrank 0.2% in April on an unadjusted basis, likely grew by close to 1% when one adjusts for the constantly falling prices of electronic gear, making it one of the better and not one of the worst categories for April. This category generally sees price declines of 10% every year, so it often turns up on the losers list.
The fact that a lot of retail goods come in from overseas also weighed on the retail sales reports this winter and are now likely to be helping reported results. On top of consumers' well-documented inability to get to the stores this winter, especially in New England, they may not have found much to buy when they got there. A lot of goods that normally would have been available for sale were stuck on the docks. And because supply was restricted, prices of goods went up, further depressing consumer interest. Apparel prices, which were down in each of the past three months of 2014, were up in January, February, and March, when the port actions delays were at their worst. Then clothing prices fell dramatically in April when goods became more available. Apparel sales were one of the best sales performers in May, even as low prices affected the retail sales calculation.
Federal Budget Situation Continues to Improve April was a great month for federal tax collections, which significantly improved the budget outlook for fiscal year 2015 (ending in September). We had been a little fearful that the April numbers were a little too good to be true, and that April's great number would be followed by a problematic number in May. Our worries proved unfounded. The deficit for the single month of May declined from $94 billion in 2014 to just $83 billion in 2015. For the year to date (the first eight months of the fiscal year) the budget deficit has declined from $401 billion to $368 billion.
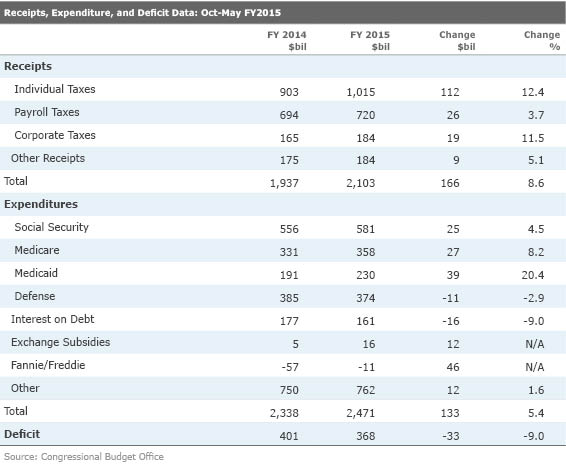
If current patterns hold, the deficit could drop into the $420 billion-$450 billion range compared with $487 billion for fiscal year 2014. The improvement comes from higher taxes that are a result of an improved economy, with more jobs and more wages, more capital gains, and bonus-related income and new taxes under the Affordable Care Act.
Overall taxes and other revenue have increased by 8.6% while expenses are growing more modestly at 5.6%. Lower defense spending plus limited growth in the "Other" category have really kept overall expenditures down, despite some very large increases in the Medicaid program (related to extending Medicaid eligibility under the Affordable Care Act). The overall deficit progress has been quite remarkable, as shown below.
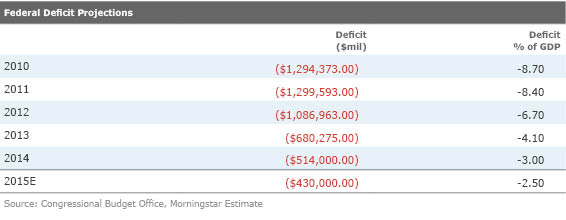
Perhaps as remarkable is that the official government forecast for 2015 was for a deficit of $478 billion as recently as February. Now something in the neighborhood of $430 billion seems like a real possibility. My biggest worry is that the suddenly better data causes both political parties to rethink some of their thriftiness. I am a little afraid that the politicians will find a way to split the current windfall (with the Democrats getting more money in social programs in return for defense spending dollars for Republicans) rather than keeping the austerity programs going.
Small Businesses Remain Optimistic Normally, we are not huge fans of sentiment-based surveys, and the Small Business Sentiment Report from the NFIB report is no exception. Sometimes these opinion-based reports reflect more about recent headlines than actual results.
Nevertheless, with small-business improvement increasingly driving the economy again, it's hard to ignore this report. Businesses with fewer than 50 employees comprised 46% of all job growth over the past 12 months versus just 35% for the prior 12 months.
Furthermore, some of the more data-driven sector questions from the NFIB have proven to be quite insightful, especially those related to the labor market.
First, the headline sentiment figure came in at 98.3 this month, an increase of 1.4 points and just ahead of its long-term average of 98. (The record low is about 80 and the all-time high is just under 110.) Six of the 10 categories used to compile the composite showed improvement in May.
Turning to some of the employment metrics, 47% of business owners trying to hire someone found few or no qualified applicants. That's tied for the best level of the current recovery and is the highest reading since 2008. These high numbers support our thesis of rapidly increasing labor shortages. This has forced small businesses to be more generous than they had planned to be. About 25% of all businesses have handed out a raise in the past three months, versus just 14% that intended to, according to the February report. Both of these numbers are close to recovery highs and not all that far off of highs dating to the 1980s.
Job Openings Skyrocket | by Roland Czerniawski The latest Job Openings and Labor Turnover Survey has showed that employers' appetite for hiring has reached an all-time high (data goes back to December 2000), while the pace of hiring has not picked up as meaningfully.
There were nearly 5.4 million job openings available in April, up from 5.1 million in March, and way above the 12-month average of 4.8 million. The ratio of unemployed workers per job opening is now slightly below 1.6, the lowest level since August 2007. The level of new hires was down in April at 5.0 million. The number of quits, a metric that gauges the overall level of workers' confidence in the current labor market, has gone down as well, from 2.8 million in March to 2.7 million in April.
The latest JOLTS report indicates that the labor market continues tightening, as more unemployed workers find jobs while new openings continue to surge. It also seems to indicate that employers might be having a hard time filling those newly opened positions, as workers are not so quick to quit their current jobs to pursue new opportunities.
This report reaffirms that the labor market is as strong as indicated by the exceptionally strong May employment report (288,000 jobs added) and that the unusually low 85,000 jobs added, according to the March employment report, were just a blip. It also suggests that continued hourly wage increases should continue to quicken as the labor market tightens. We've already seen better-than-average wage growth in the latest employment report and, given the latest JOLTS data, this trend should continue.
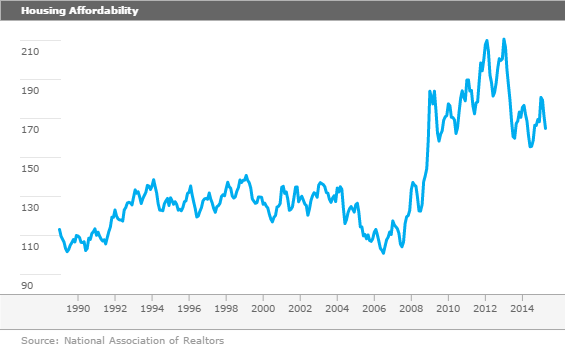
Housing Affordability Slips in April | by Roland Czerniawski According to the National Association of Realtors, the Housing Affordability Index continued to decline for a third consecutive month, and was down to 164.9 in April. On one hand, the news is a little bit troublesome considering that affordability is now back to the mid-2014 levels, and at those levels, last year was a bad year for existing-home sales. It is also troubling that while incomes grew at a fairly slow pace, interest rates are now on the rise, moving mortgage payments higher at a much faster pace.
It is difficult to say with certainty whether this lower affordability will have a big impact on the housing market. Although the current affordability level is much lower than it was in the beginning of 2015 or even two years ago, it is still much higher than levels that prevailed for more than a decade (around 130 then versus 165 currently). Also, in the very short run, panic over potentially higher rates (which reduce affordability) could temporarily drive existing-home sales up as fence-sitting potential buyers feel forced to act, as they did in 2013. Then the reality of lower affordability set in during 2014.
The decline in affordability of existing homes (and the lack of really cheap foreclosures) partially explains the renewed strength in the newly built single-family home sales. Overall, the current affordability reading does not immediately raise red flags; however, further developments in this metric could prove to be crucial and could have a huge impact on the future course of this housing recovery.
Housing Data, Manufacturing, CPI, and Fed Rate Decision Coming Up The manufacturing sector has been in a minor decline since last fall, driven by weak commodity markets, a strong dollar, and a declining energy sector. That in turn has kept manufacturing employment growth in check. Depending on one's preferred metric, manufacturing accounts for 10%-12% of all employment. Recent durable goods orders and a higher reading from the ISM purchasing managers' survey suggest that the worst may be behind the manufacturing sector. A better housing industry and more aerospace activity as well as a better performing consumer and lack of port strike actions should all help manufacturing in the second half of the year.
The headline industrial production number, due on Monday, is expected to increase by 0.2% following a 0.3% decline in April. Again, volatility in the mining sector and utility usage could weigh on the headline number. We will be focused on the year-over-year growth rate in the manufacturing-only component, which could remain in growth territory but at a lower rate than in April. We will also be checking the dispersion of the number of sectors doing well.
With the increased importance of the housing industry, economists will be looking closely at both the builders' sentiment report as well as the government's official housing starts and permits report. The sentiment report is expected to show a small uptick in June from 54 to 55. We think results could be a little better. Housing starts are expected to drift back a bit from 1.14 million units to 1.10 million annualized units for May after a big surge in April. Given that the same strength was evidenced in the permit data and a very strong new homes report (with the sale of a lot of homes that had not been started), we think the consensus is too conservative. I suspect that starts could come in at 1.15 million units or more for May. Anything above 1.05 million starts would keep me happy, especially if permits are strong. Also, we tend to ignore big ups and downs in the apartment market and will be more focused on the single family portion of the report.
Consumer prices are expected to increase by 0.5% in May following a 0.1% increase in April. A 10% surge in gasoline prices in May will add 0.4% to the CPI after having almost no impact in April. The avian flu also likely added to poultry and grocery prices in May. On the other side of the inflation equation, the greater availability of goods after the new West Coast port contract may keep a lid on some other price categories such as clothing, cars, and electronics. All in, the 0.5% inflation forecast seems a bit low to us. Either way (us or the consensus) it looks like the year-over-year, total inflation rate is likely to show a 0.1% or 0.2% increase, following four months of outright deflation on a year-over-year basis.
We are hoping the Fed Open Markets Committee meeting next week will prove uneventful. This is one of the bigger meetings of the year with a full press conference and new economic forecasts in addition to the usual statement on rates and conditions. The Fed correctly anticipated that the first-quarter weakness was most likely artificial and temporary. However, we (and just about everyone) believe the spring rebound has not been strong enough or long enough to cause the Fed to change its interest rate stance. And the pressure is on from both the IMF and the World Bank, which both have indicated that they don't want to see a U.S. rate increase at all in 2015. That said, I suspect the Fed will sound more bullish on the economy, which could easily throw bond markets into a funk midweek even if it doesn't change rates now--although, this week's surge in rates worldwide may have already anticipated some more hawkish statements from the Fed.
/cloudfront-us-east-1.images.arcpublishing.com/morningstar/GJMQNPFPOFHUHHT3UABTAMBTZM.png)
/cloudfront-us-east-1.images.arcpublishing.com/morningstar/ZYJVMA34ANHZZDT5KOPPUVFLPE.png)
/cloudfront-us-east-1.images.arcpublishing.com/morningstar/LDGHWJAL2NFZJBVDHSFFNEULHE.jpg)