
How Long Will It Take the Market to Recover?
Historical data can be a valuable gut check for worst-case scenarios.
/s3.amazonaws.com/arc-authors/morningstar/360a595b-3706-41f3-862d-b9d4d069160e.jpg)

Investors who suffered through 2022′s dismal market are probably wondering when things will get back to normal. Most major asset classes have posted strong returns for the year to date through Jan. 26, but there’s no guarantee these positive trends will continue. A potential economic recession, the pace of future interest-rate increases, and whether inflation will continue moderating are all wild cards that could cause another series of market drops.
In this article, I’ll explain how investors can use historical times to recovery to set reasonable expectations for how long it might take various asset classes to bounce back, as well as how this data can be used to make sure portfolio holdings line up with the timing of an investor’s goals.
Background on Time to Recovery
Modern Portfolio Theory defines risk in terms of volatility (or the standard deviation of returns), and defines success based on performance relative to a market benchmark. But the reality that individual investors and financial advisors live in is far messier. Most investors have multiple goals, such as setting up an emergency fund, buying a house, funding a child’s college education, making a major purchase such as a car or vacation, and saving for retirement. Each goal has a different time horizon and a different level of importance to the individual investor. And while investors might find volatility unpleasant, the real risk they face is not having enough assets available to meet their goals.
One way to manage this potential shortfall risk is to consider historical recovery times for different types of investments. The longer the time to recovery, the greater the risk that a holding will be in negative territory when the time arrives to liquidate assets to fund a specific goal.
Granted, history is an imperfect guide. There are no guarantees that the future will match the past, and asset classes that once seemed invincible over multiple years (such as gold, bonds, and technology stocks) can later suffer dramatic changes in fortune. That said, historical data is one of the few tools investors have for making decisions. It can also be a valuable gut check for worst-case scenarios. When reviewing the historical data for time to recovery, we focused on the periods with the longest recovery times for each asset class. Although this could be considered overly conservative, it builds in a margin of safety to reduce the risk that investors won’t have enough assets available to fund their goals.
Reviewing the Data on Time to Recovery
To measure historical recovery times, we looked at all periods with negative returns (ranging from one month to however long the downturn lasted) for each Morningstar Category in Morningstar’s fund classification system, with the majority of category return data starting in 1990. We then measured the length of the average time to recovery (defined as when the average fund in the category reached breakeven after a period of decline), as well as the maximum time to recovery. (Note: All the data shown here is based on nominal returns; recovery times would be longer after adjusting for inflation.)
As shown in the table below, most of the average recovery times are relatively short. For the large-blend category (home to widely held broad market index funds such as SPDR S&P 500 Index Trust SPY and Vanguard Total Stock Market Index VTSMX) for example, performance bounced back after about six months, on average. But the maximum recovery times were far worse. For large-blend funds, the longest recovery period spanned more than six years. And after getting pummeled in the dot-com stock correction in March 2000, the large-growth category didn’t fully recover for 13 years (the maximum recovery period shown in the table).
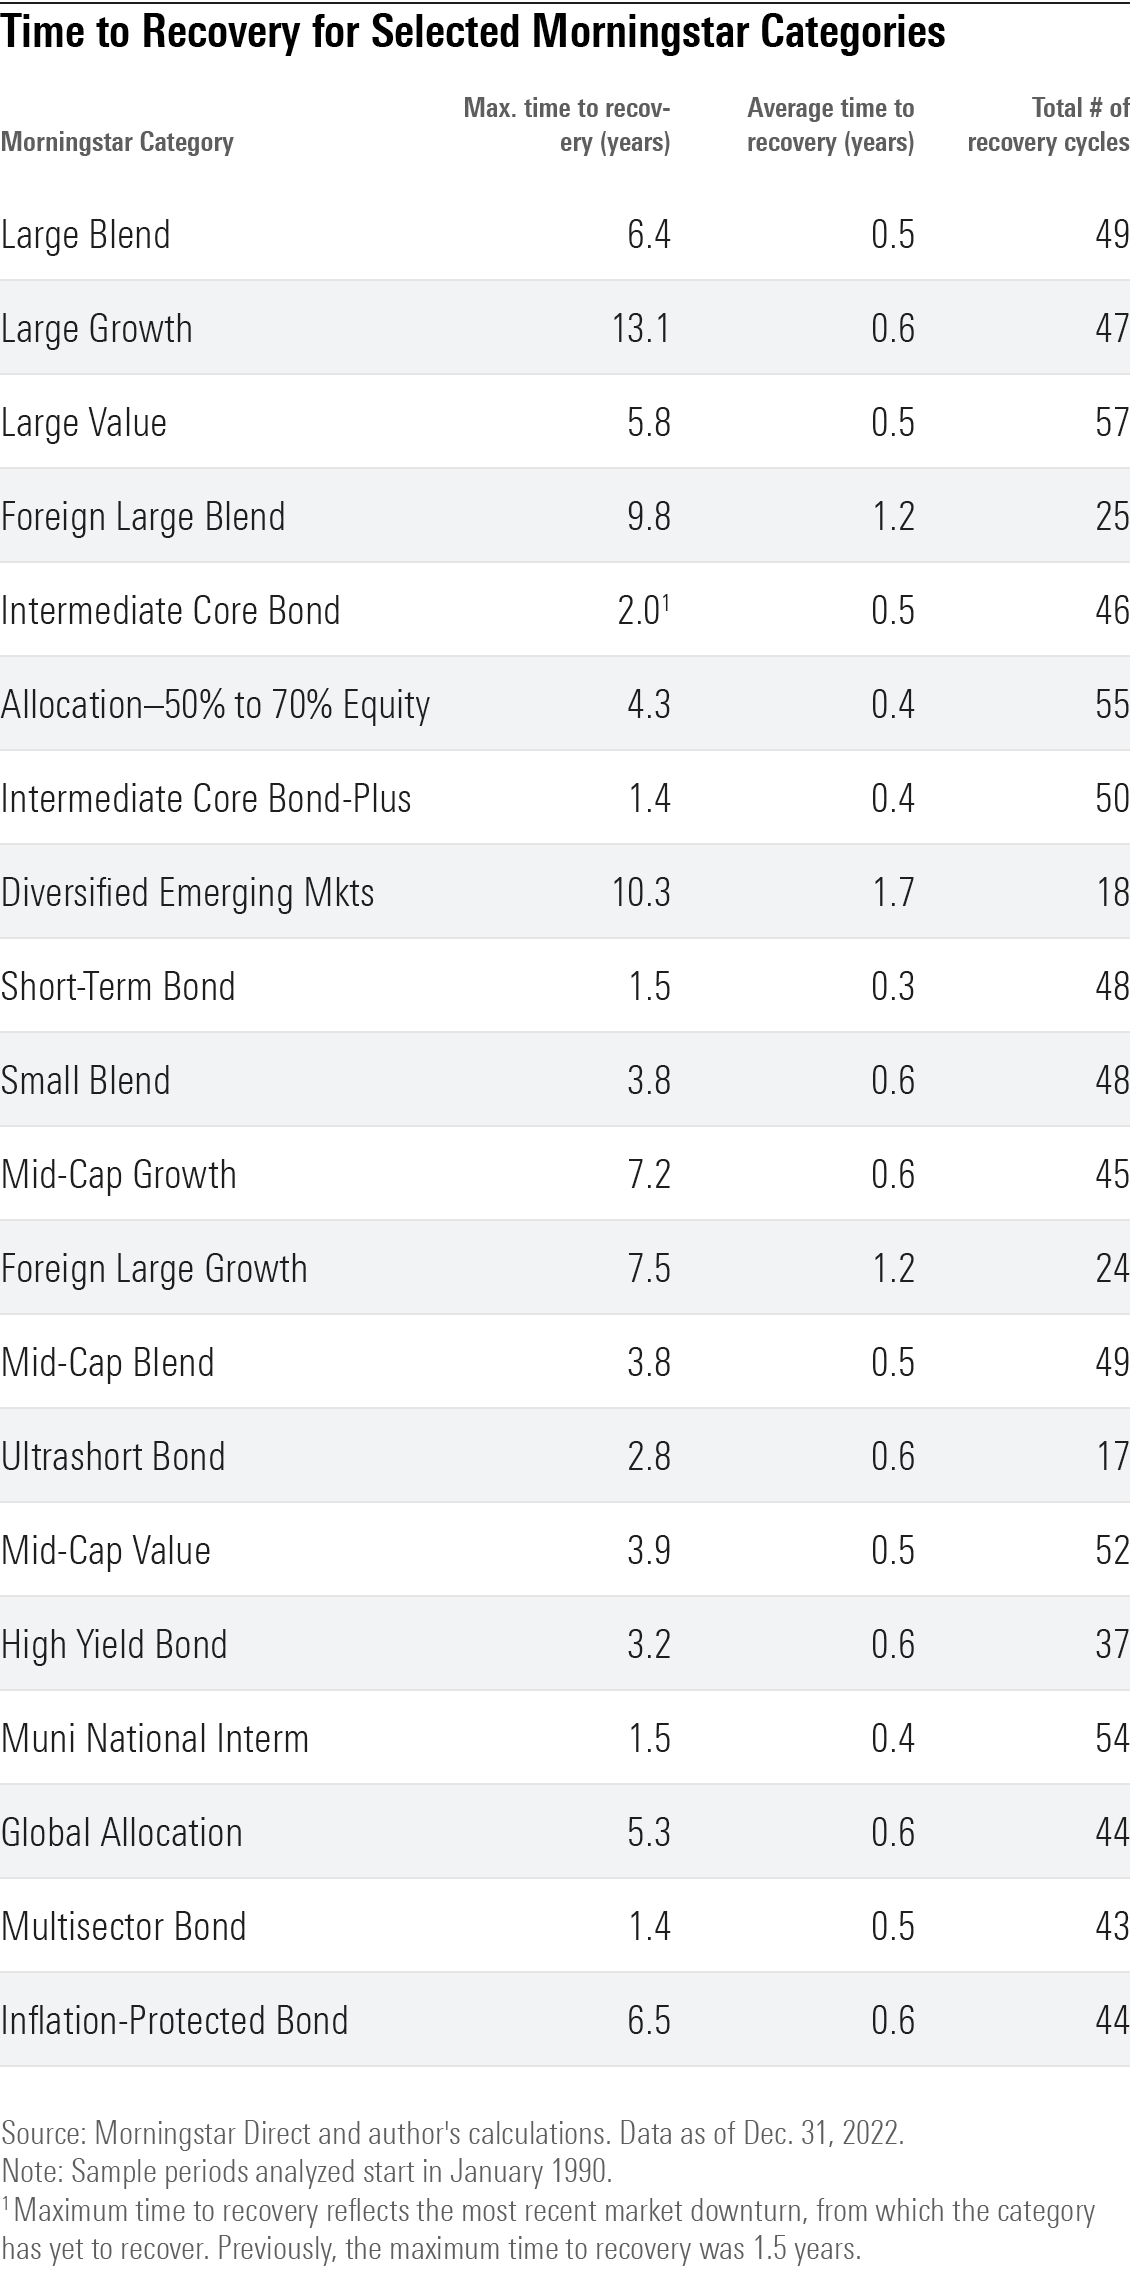
In addition, historical recovery times were longer over some previous periods. To get additional data on worst-case scenarios, we reviewed recovery periods for major asset classes over longer periods, typically starting in 1926 for the broadest asset classes using the IA SBBI indexes and in 1976 for other major asset classes. As shown in the table below, the recovery period for U.S. stocks has been as long as 15 years: In the wake of the 1929 Crash, the IA SBBI US Large Stock Index didn’t fully recover until late 1944. For gold bugs, the longest recovery period spanned more than 26 years (from October 1980 until April 2007). Commodities have yet to recover from the long-term decline that started in 2008, even after their strong showing in 2022.
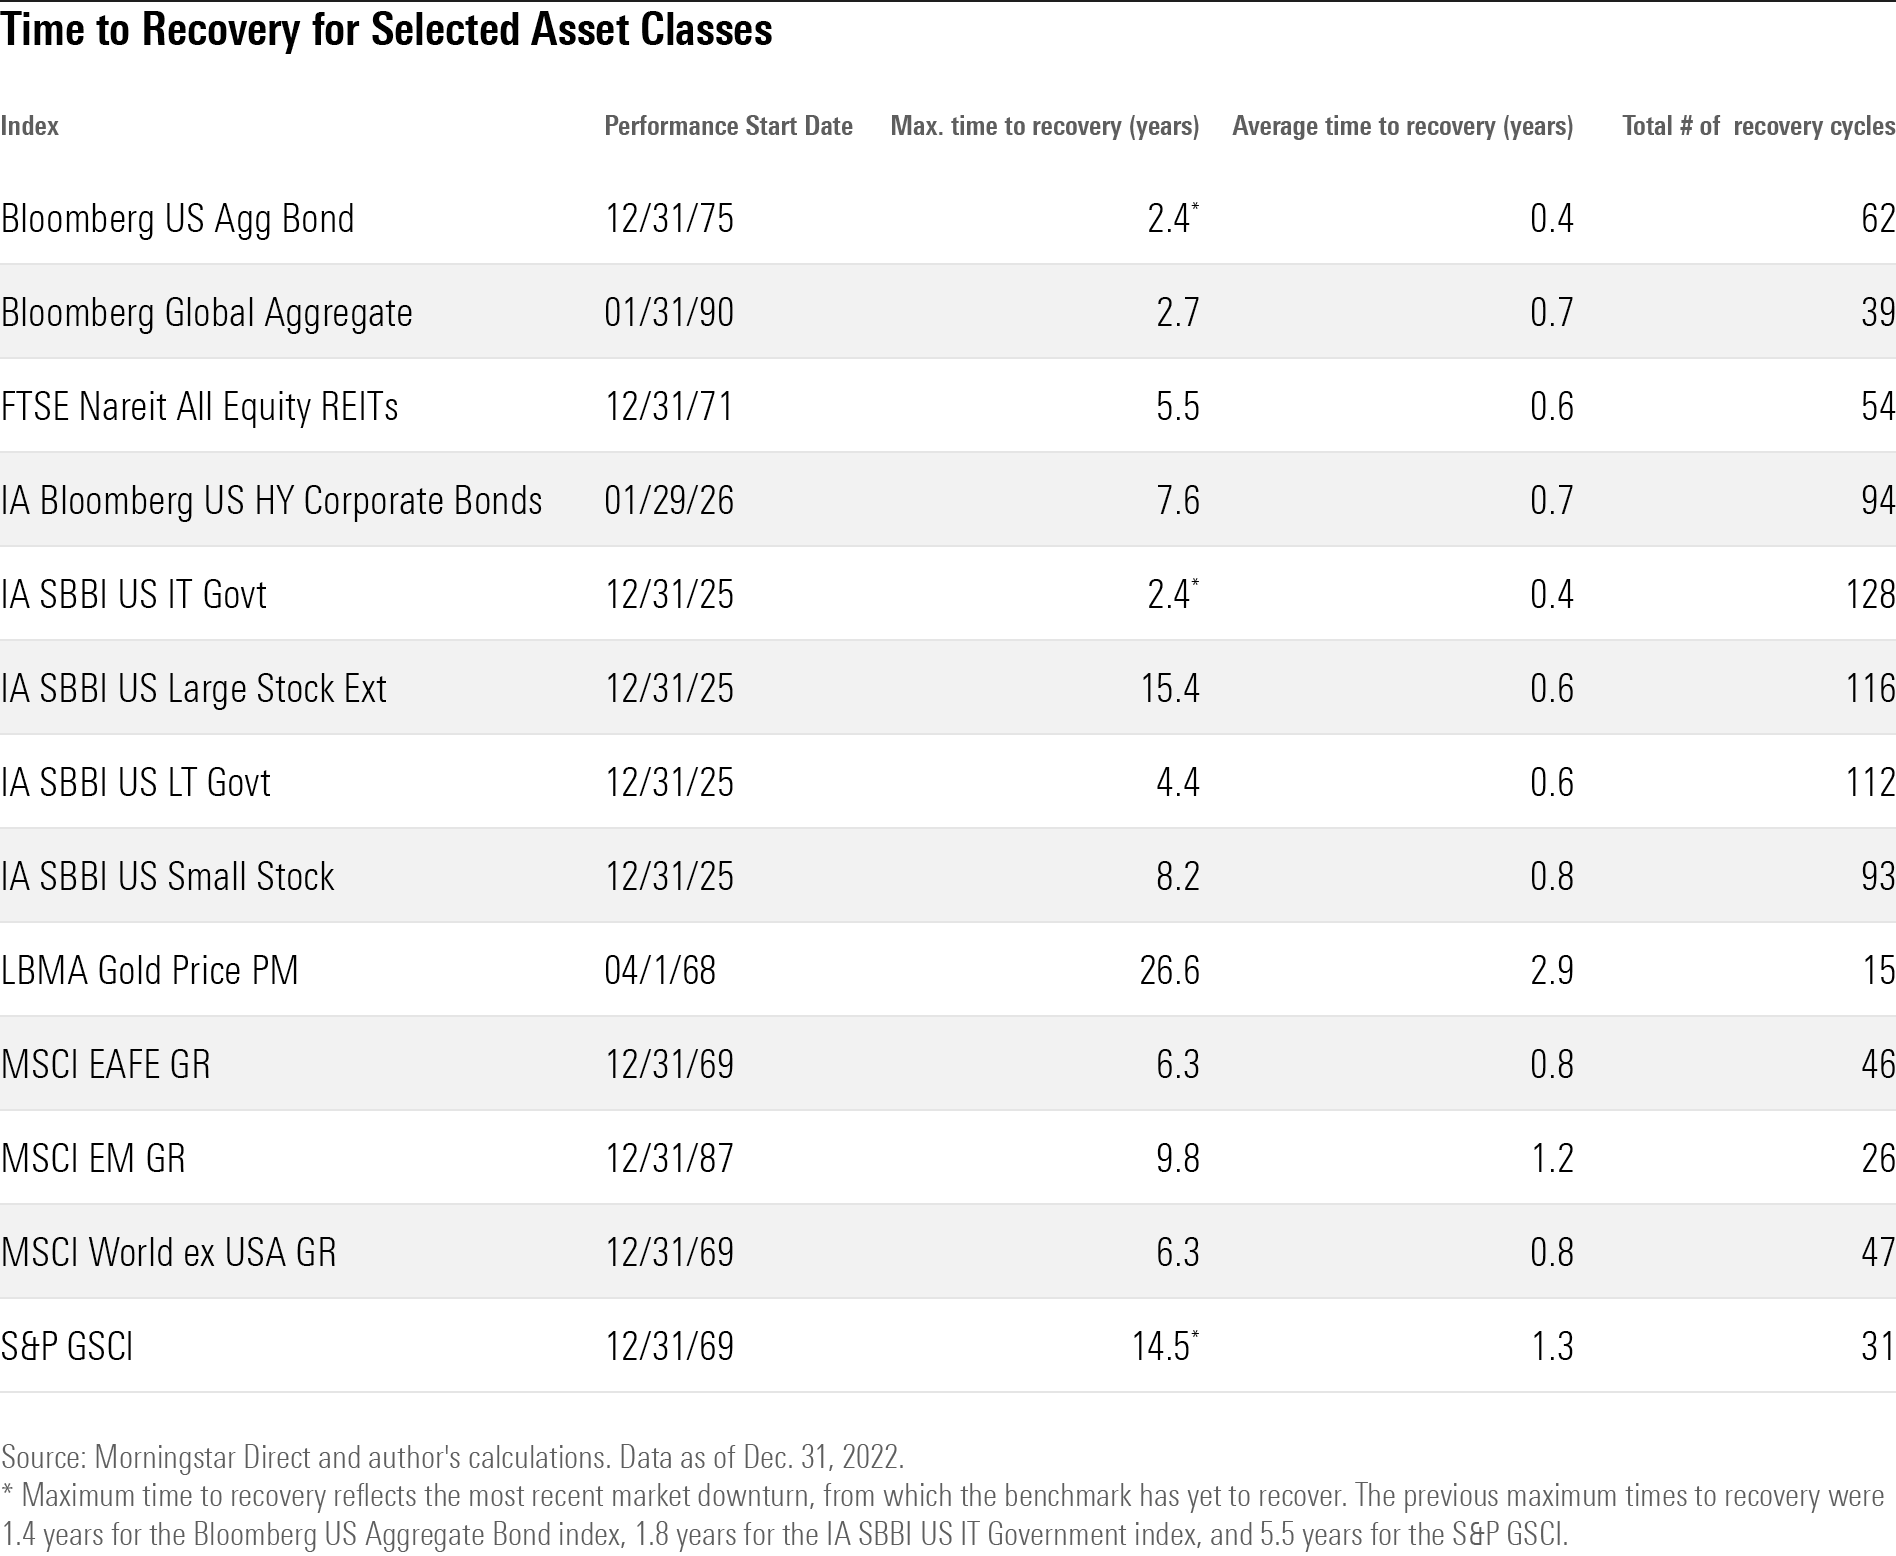
On the bond side, the picture looks more reassuring. Although bonds still haven’t recovered from the historically sharp drawdown that started in late 2020, they typically bounce back in relatively short order. In 1994, for example, the IA SBBI US Intermediate Term Government Index dropped about 5% after multiple interest-rate hikes by an inflation-wary Federal Reserve, but fully recovered within about 15 months. As a result, intermediate-term bonds usually make reasonable holdings for investors with a medium-term time horizon.
To better gauge the risk of loss over various periods, we also looked at returns for different asset classes and Morningstar Categories over rolling periods ranging from 1 to 10 years. As shown in the table below, for stocks, nearly one fourth of all rolling one-year periods landed in negative territory. The frequency of losses generally decreases over longer rolling periods, dropping from about 16% over two-year periods to 8.7% over six-year periods.
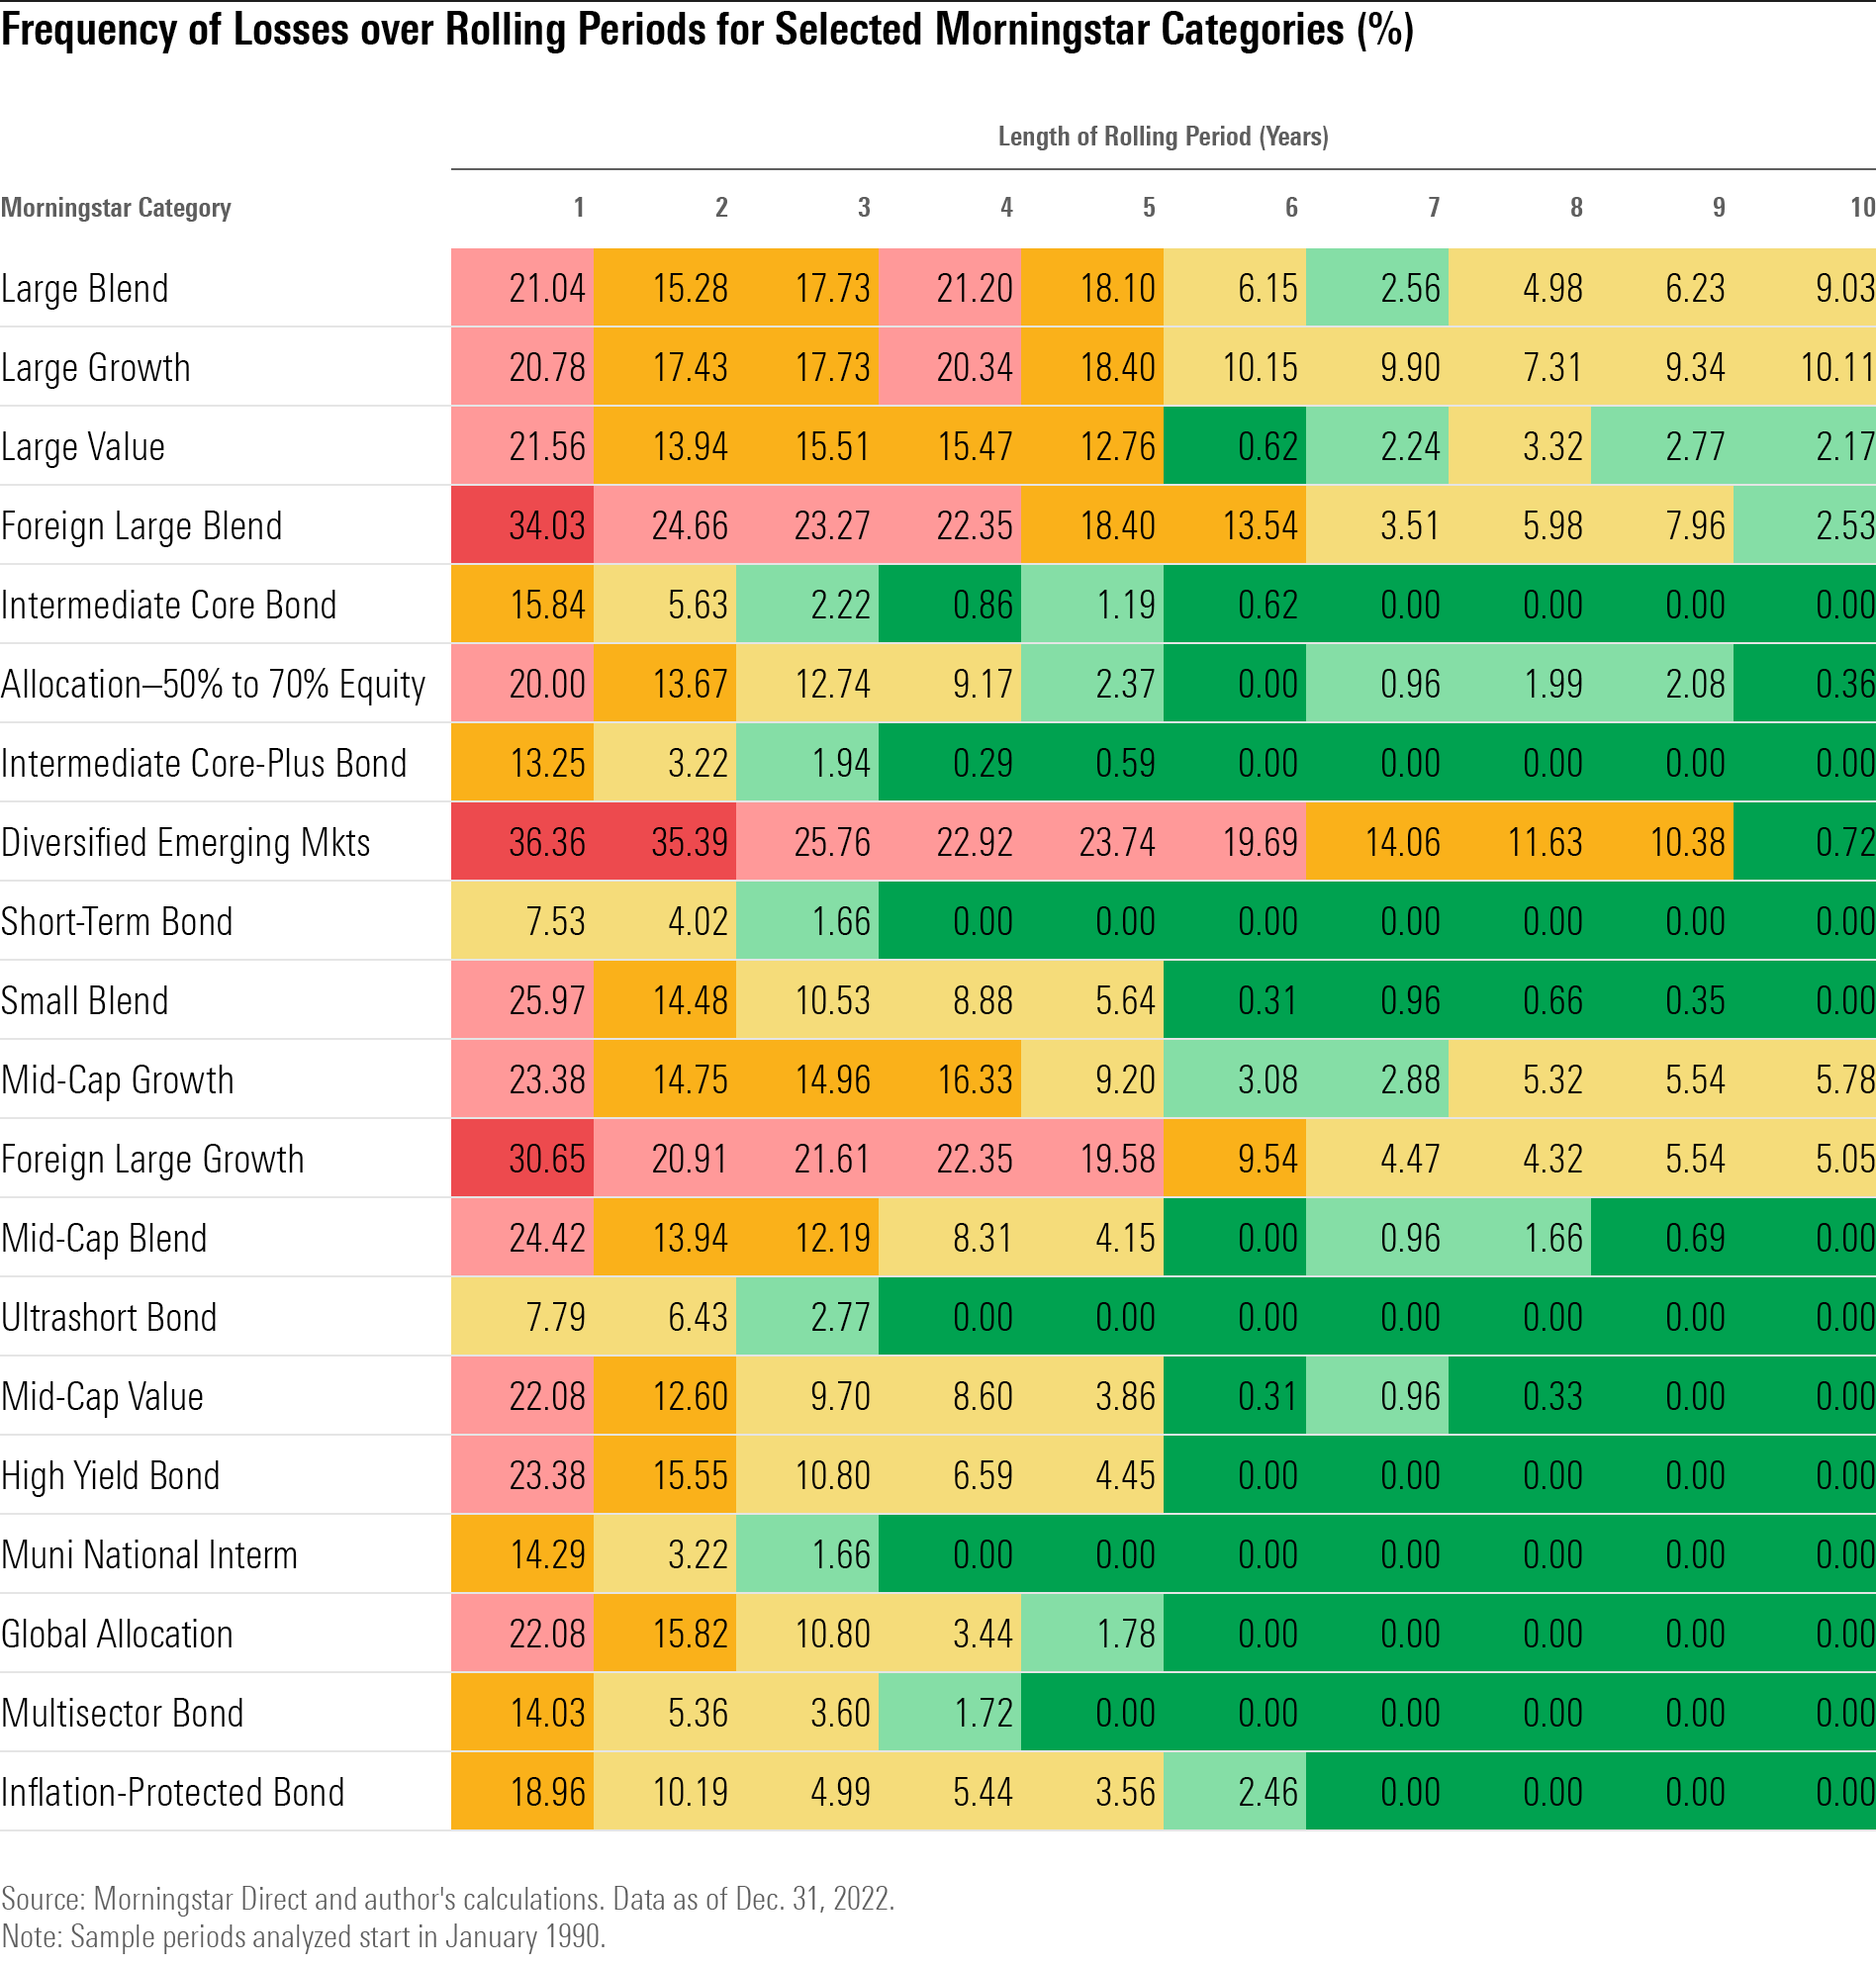
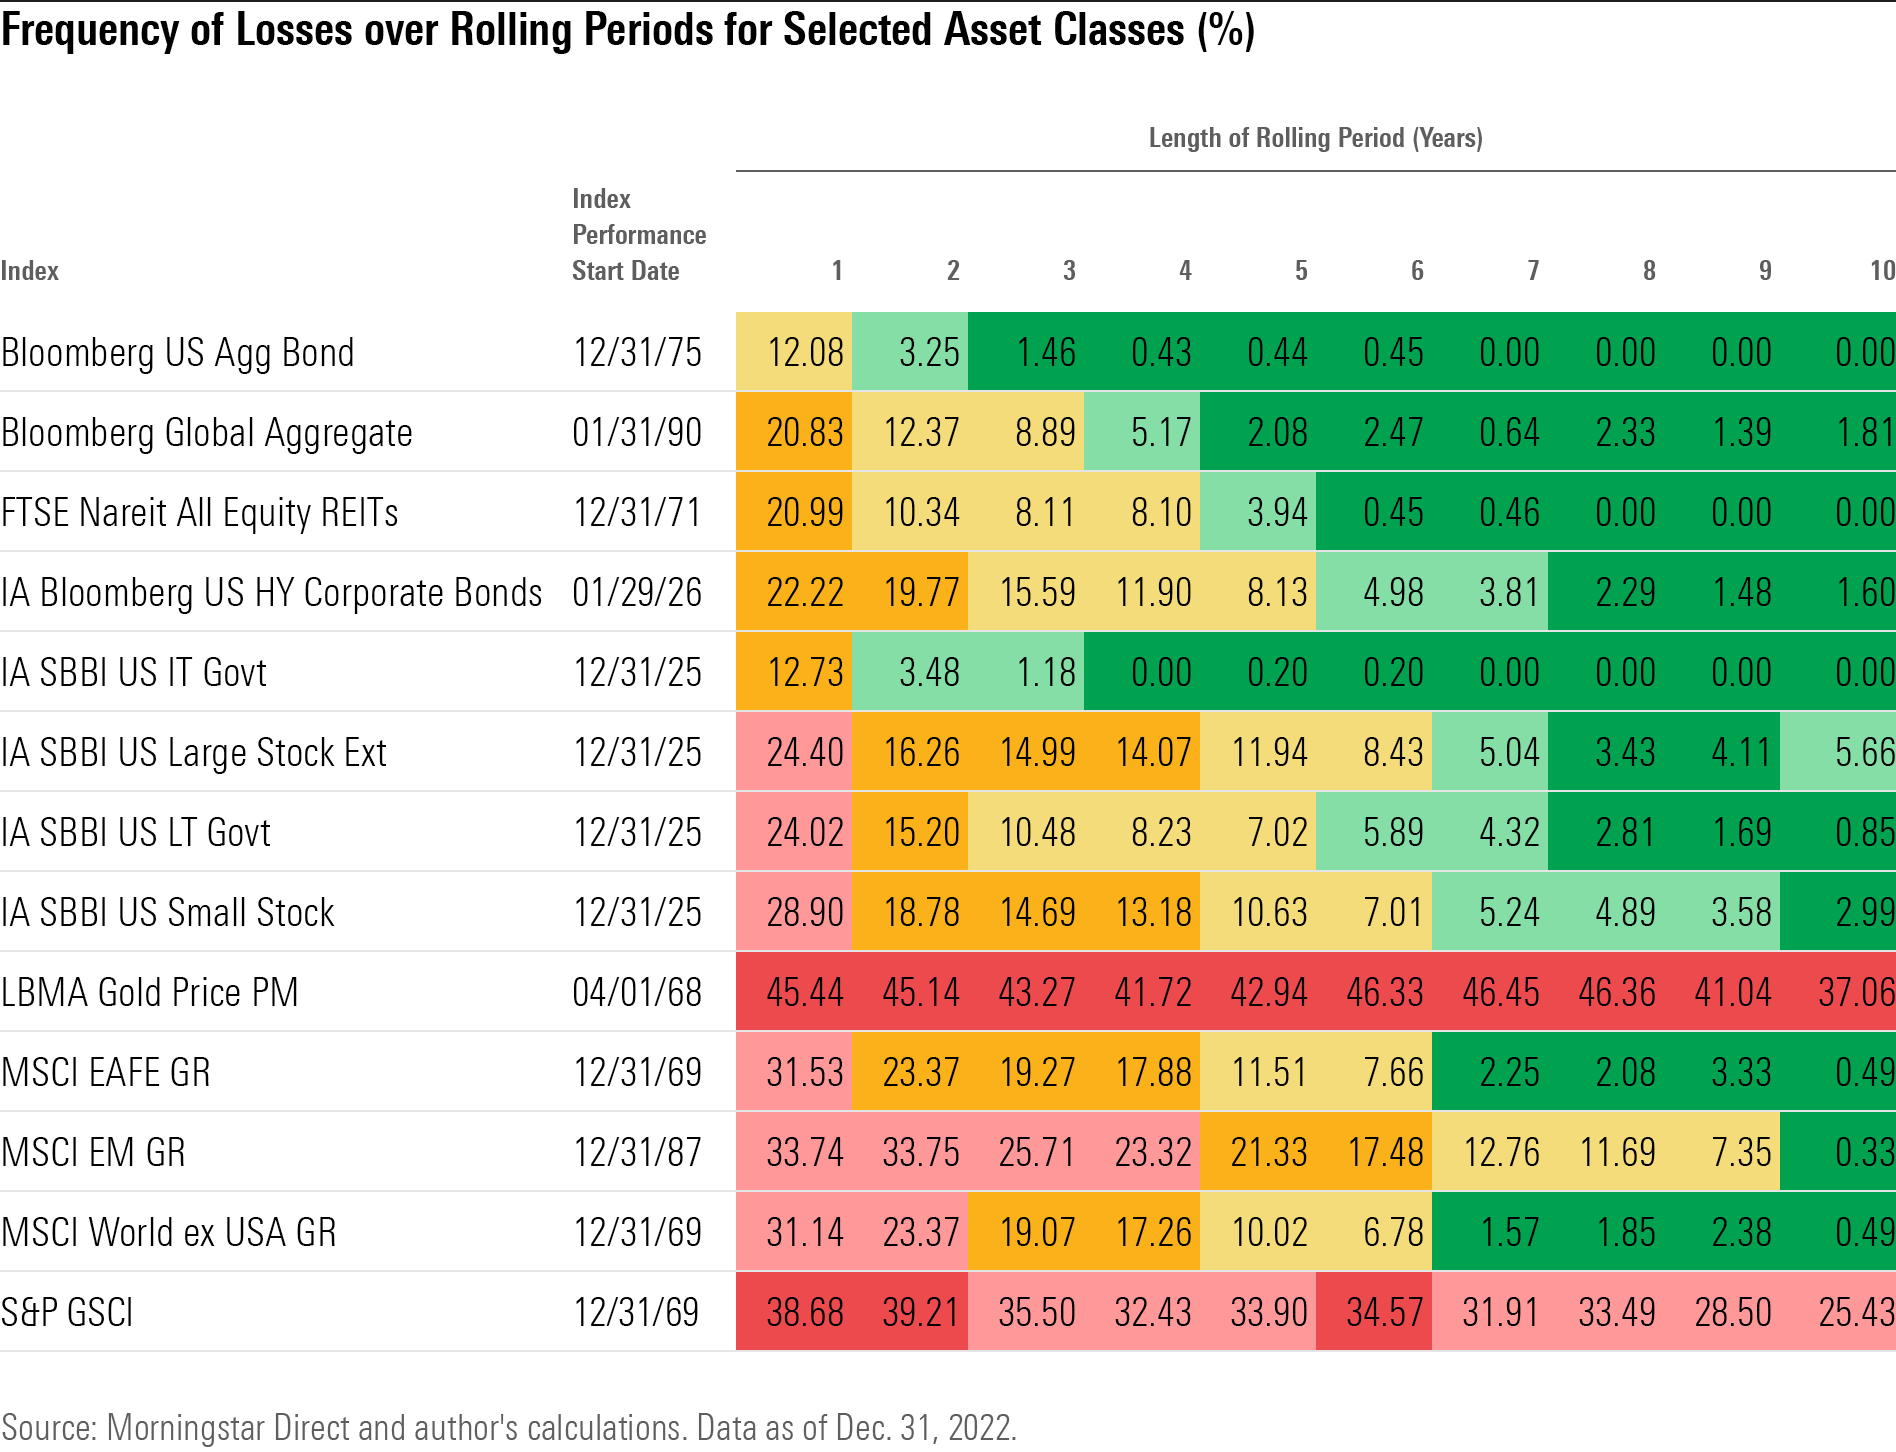
Interestingly, the frequency of losses decreases after seven years but then increases again after 10 years. This reflects a few periods such as the “Lost Decade” of the 2000s. After the implosion in dot-com stocks that started in early 2000, stocks gradually recovered starting in early 2003 and reached parity with their previous levels by September 2006. That recovery proved short-lived, though, as it was quickly followed by the global financial crisis in late 2007, which pushed stocks down again to the tune of more than 40% over a period of about 16 months. As a result, stock returns were negative over numerous rolling 10-year periods that spanned both bear markets.
Conclusion
Reviewing historical times to recovery can help investors determine an appropriate holding period for types of funds. For example, we consider 10 years a reasonable minimum holding period for equity-focused portfolios. While stocks have typically bounced back over much shorter periods, it’s better to err on the side of caution.
Jimmy Cheng contributed to this article.
The author or authors do not own shares in any securities mentioned in this article. Find out about Morningstar’s editorial policies.
/cloudfront-us-east-1.images.arcpublishing.com/morningstar/6ZMXY4RCRNEADPDWYQVTTWALWM.jpg)
/cloudfront-us-east-1.images.arcpublishing.com/morningstar/URSWZ2VN4JCXXALUUYEFYMOBIE.png)
/cloudfront-us-east-1.images.arcpublishing.com/morningstar/CGEMAKSOGVCKBCSH32YM7X5FWI.png)
:quality(80)/s3.amazonaws.com/arc-authors/morningstar/360a595b-3706-41f3-862d-b9d4d069160e.jpg)