
Why Simpler Has Been Better for Portfolio Diversification
Broader asset class exposure doesn’t always pay off.
/s3.amazonaws.com/arc-authors/morningstar/360a595b-3706-41f3-862d-b9d4d069160e.jpg)

In our recently published 2024 Diversification Landscape report, Christine Benz, Karen Zaya, and I took a deep dive into how different asset classes performed in the past couple of years, how correlations have evolved, and what those changes mean for investors and financial advisors trying to build well-diversified portfolios. One key finding: Portfolio diversification didn’t boost returns in 2023’s generally bullish market environment.
To test the value of portfolio diversification, we created a portfolio made up of 11 different asset classes. We allocated 20% of the portfolio to larger-cap domestic stocks; 10% each to developed- and emerging-markets stocks, Treasuries, US core bonds, global bonds, and high-yield bonds; and 5% each to small-cap stocks, commodities, gold, and REITs. We then tested how this “diversified” portfolio fared versus a plain-vanilla version of a 60/40 portfolio (made up of US stocks and US investment-grade bonds).
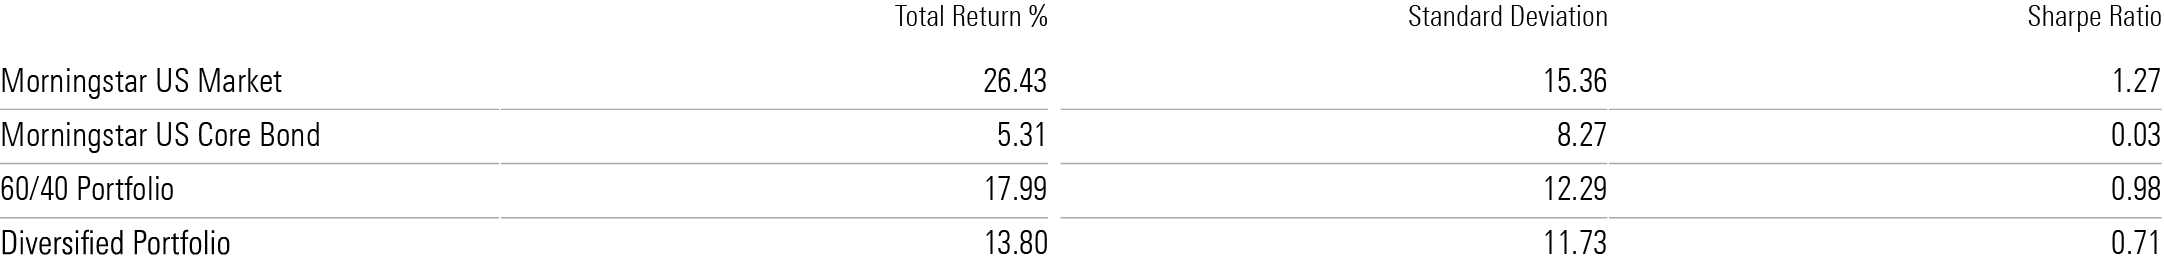
As US stocks bounced back from their losses in 2023, most other asset classes fell behind. In contrast to 2022, when diversification was a net positive, every “diversified” asset class fell behind the Morningstar US Market Index in 2023. As a result, the most basic version of a 60/40 portfolio gained about 18% for the year, but a more diversified version fell roughly 4 percentage points behind.
Thanks to slightly lower correlations for many of the “diversified” asset classes, the diversified portfolio would have done a better job reducing risk, but not enough to result in higher risk-adjusted returns.
How Portfolio Diversification Fared in 2023
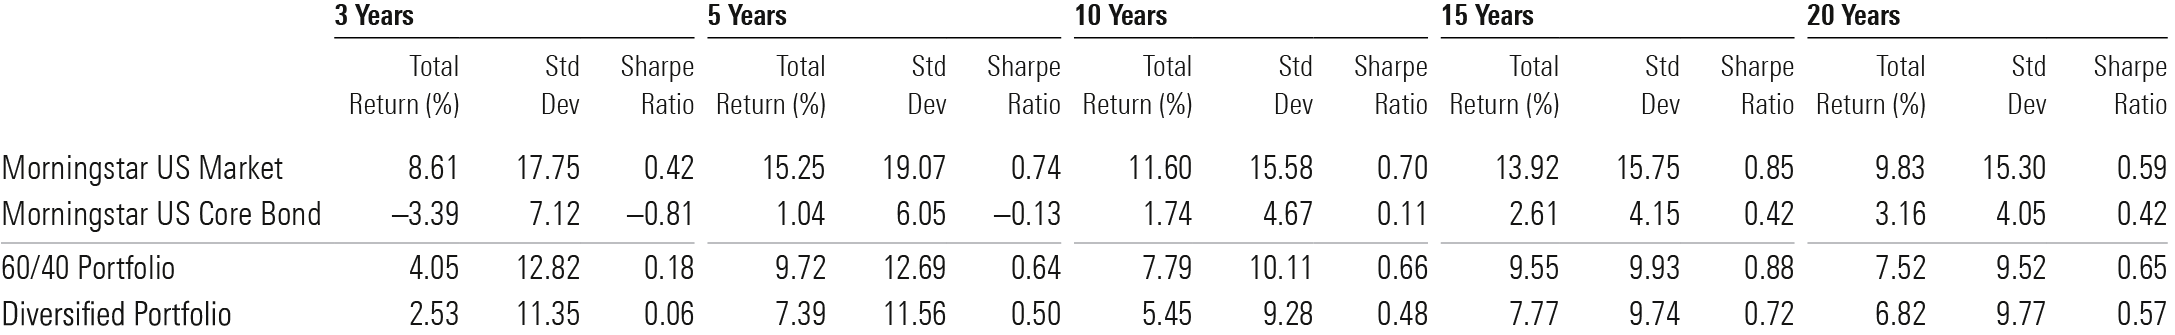
More-diversified portfolio strategies have also struggled over the past two decades. The diversified portfolio reduced risk compared with a plain-vanilla mix of domestic stocks and bonds over most trailing periods but not enough to result in better risk-adjusted returns, as measured by the Sharpe ratio.
How Portfolio Diversification Fared Over Longer Periods
To test the value of diversification over longer periods, we used the IA SBBI US Large Stock and IA SBBI US Intermediate Term Government indexes (which both have longer performance histories) as a baseline for a basic 60/40 portfolio. We used the same asset classes I mentioned above to test the performance of a more diversified portfolio over rolling 10-year periods starting in 1976.
Risk-Adjusted Returns (Sharpe Ratio)
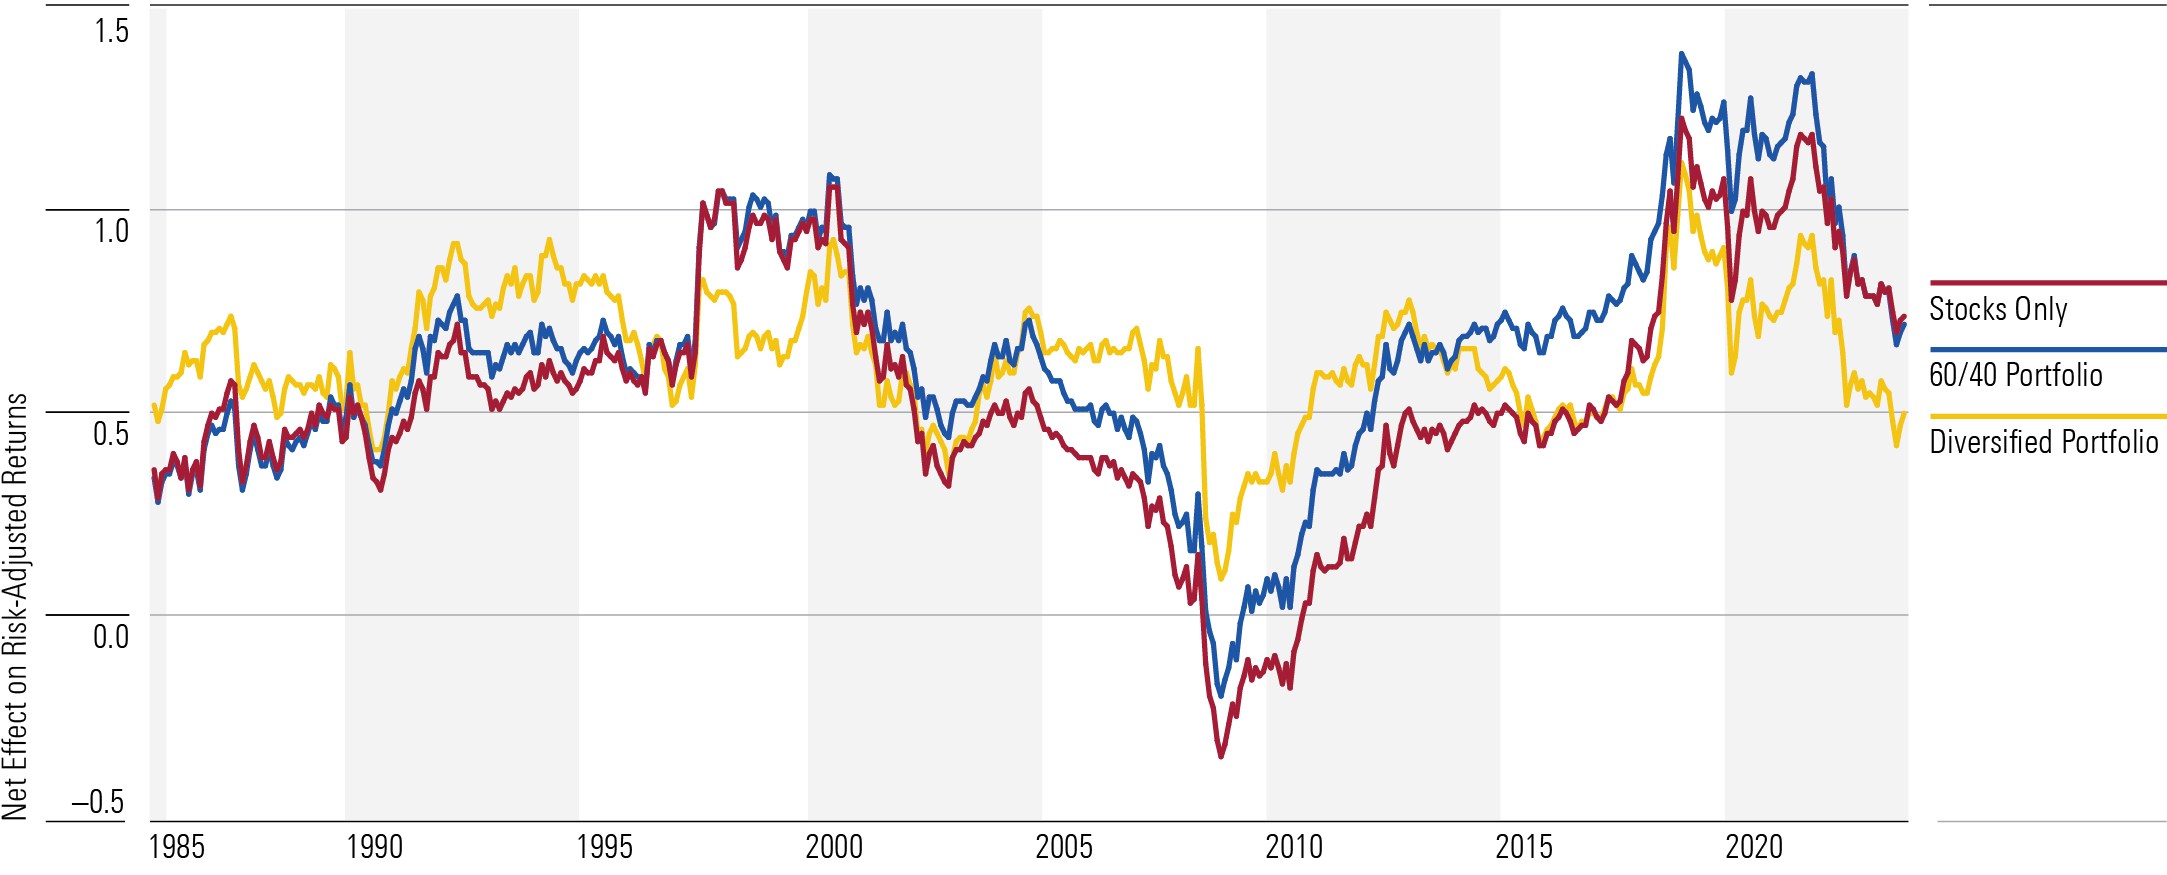
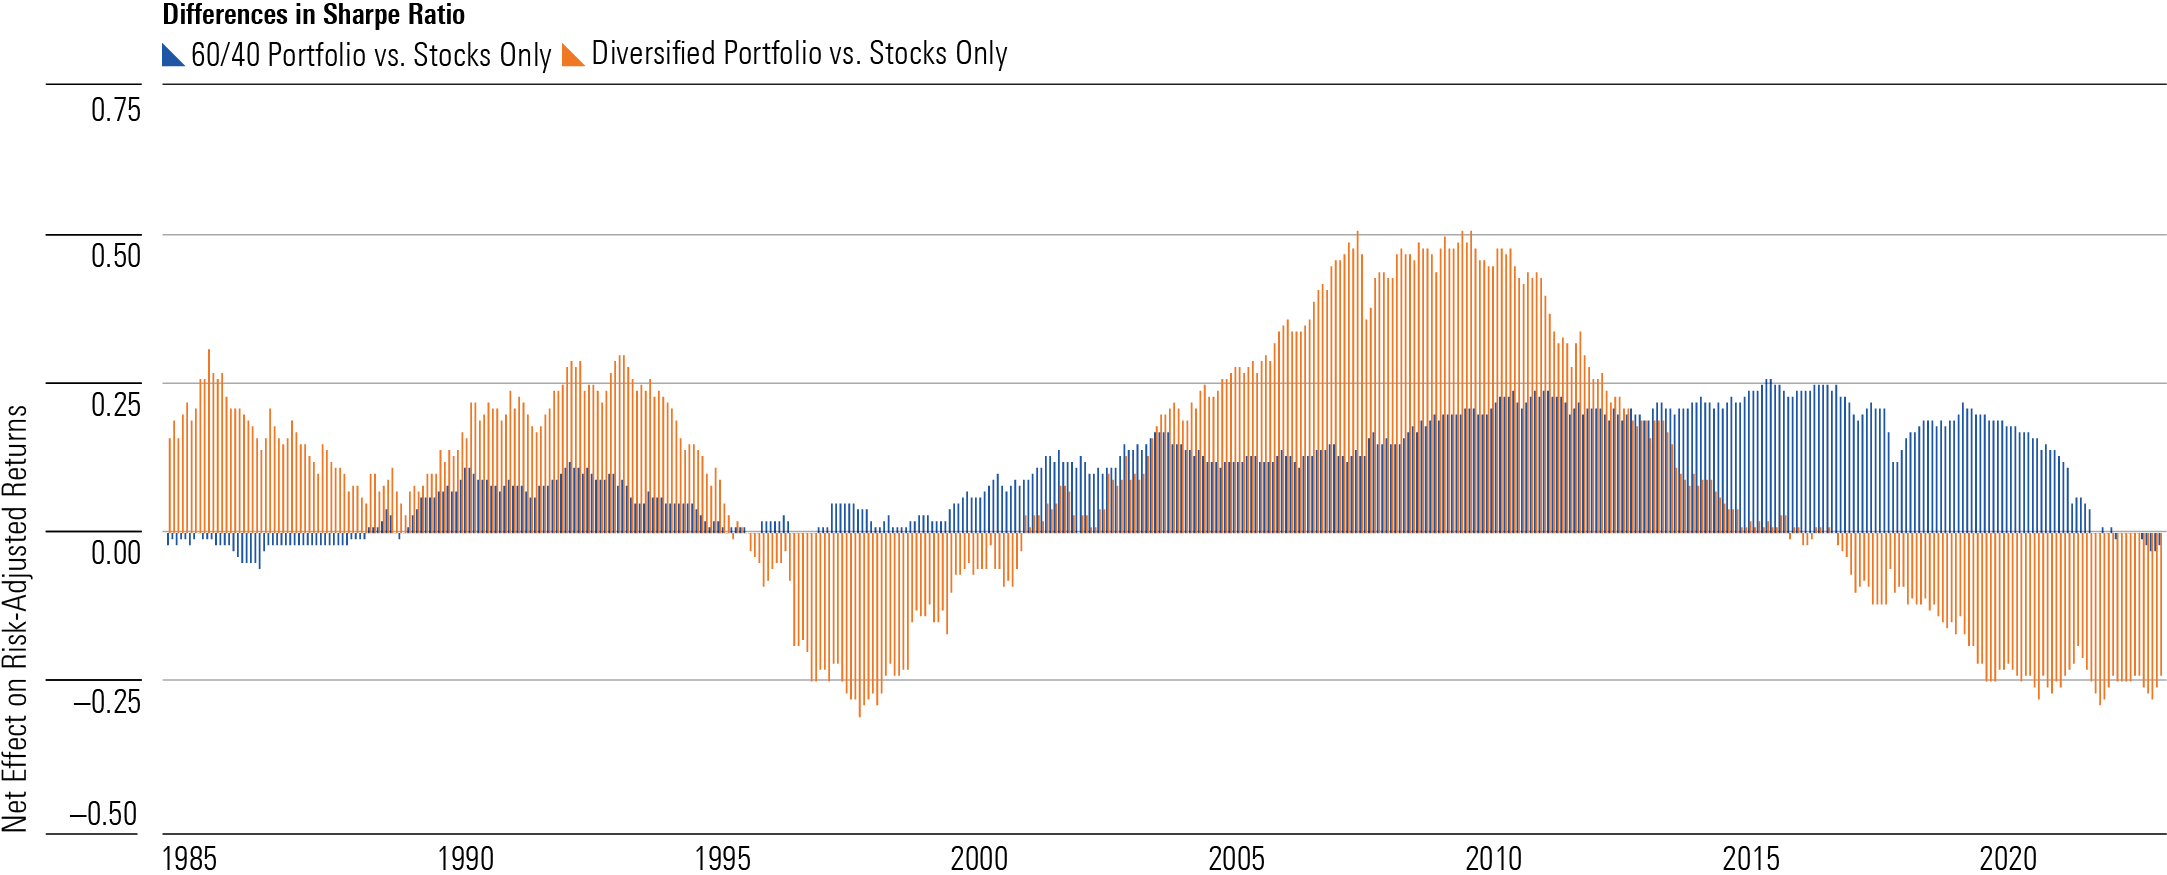
Although a broadly diversified portfolio improved risk-adjusted returns (as measured by the Sharpe ratio) versus an all-stock portfolio during most rolling 10-year periods between May 1993 and December 2016, our test portfolio posted weaker risk-adjusted returns over most periods since then. The basic 60/40 portfolio, on the other hand, fared better than the stocks-only benchmark about 87% of the time going back to 1976 and came out ahead of the more broadly diversified version in every rolling 10-year period since the period starting in late 2004.
Net Effect on Risk-Adjusted Returns
Diversification’s recent struggles mainly reflect the confluence of strong returns for US stocks and core US bonds and weaker results for international stocks and more specialized assets during most of the period from 2000 through 2023. In addition, market correlations often converge during periods of market crisis, which happened across most major asset classes (with Treasuries and cash the notable exceptions) when the market tumbled in 2022 and early 2020.
Correlations have also trended up over longer periods for some major asset classes, which reduces the value of diversification. Correlations between US and non-US stocks, for example, have significantly increased over the past 10 years. Even areas often touted for their diversification benefits—including REITs and high-yield bonds—have moved in tandem with the broad US equity market more often than investors might expect. In aggregate, the correlation coefficient for the diversified portfolio versus the Morningstar US Market Index rose to 0.94 for the most recent three-year period, compared with 0.87 for the three-year period ended in December 2004.
The key question now is: Will a plain-vanilla stock and bond blend continue to dominate, or can a more diversified approach add value? The answer depends to a large extent on the macro environment, which went through a significant shift starting in late 2021. In contrast to the low inflation and generally declining interest rates that defined most of the previous three decades, both inflation and interest rates have reversed course. As a result, correlations between stocks and bonds have remained positive since 2021, reducing the benefit of basic portfolio diversification.
Positive stock/bond correlations would probably persist during an extended period of rising interest rates and/or rising inflation. Even during periods when stock and bond correlations are positive, however, Treasuries and other high-quality bonds can still improve risk-adjusted returns when added to an equity-only portfolio. The upshot: Investors looking to build diversified portfolios don’t necessarily need to venture too far beyond the basic mix of larger-cap stocks and high-quality bonds.
The author or authors do not own shares in any securities mentioned in this article. Find out about Morningstar’s editorial policies.
/cloudfront-us-east-1.images.arcpublishing.com/morningstar/6ZMXY4RCRNEADPDWYQVTTWALWM.jpg)
/cloudfront-us-east-1.images.arcpublishing.com/morningstar/URSWZ2VN4JCXXALUUYEFYMOBIE.png)
/cloudfront-us-east-1.images.arcpublishing.com/morningstar/CGEMAKSOGVCKBCSH32YM7X5FWI.png)
:quality(80)/s3.amazonaws.com/arc-authors/morningstar/360a595b-3706-41f3-862d-b9d4d069160e.jpg)