Not All Value Strategies Are Created Equal
Know what you own.
A version of this article previously appeared in the April 2021 issue of Morningstar ETFInvestor. Download a complimentary copy of Morningstar ETFInvestor by visiting the website.
After a decade of poor performance, the value factor appears to be in the early innings of a comeback. From September of last year through February of 2021, the Russell 1000 Value Index outpaced the Russell 1000 Growth Index by 13.8 percentage points, leaving devotees rejoicing.
Has it returned for good, or is the value factor just teasing its fans? Regardless of what the future holds, citing the performance of a value index masks the incredible performance gaps across different value investing strategies. For example, Invesco S&P Pure Value ETF RPV, which has a Morningstar Analyst Rating of Neutral, trounced the Russell 1000 Growth Index by 31.7 percentage points, while Silver-rated FlexShares Quality Dividend ETF QDF outperformed by only 3.7 percentage points.
That massive performance disparity between RPV and QDF is closely tied to the way each fund approaches value investing. RPV favors stocks with dirt-cheap multiples, weights them by the strength of their value characteristics, and pays little attention to the underlying quality of its holdings. On the other hand, QDF looks for high-quality companies then holds those with higher yields than the market, which pulls it toward the value side of the Morningstar Style Box.
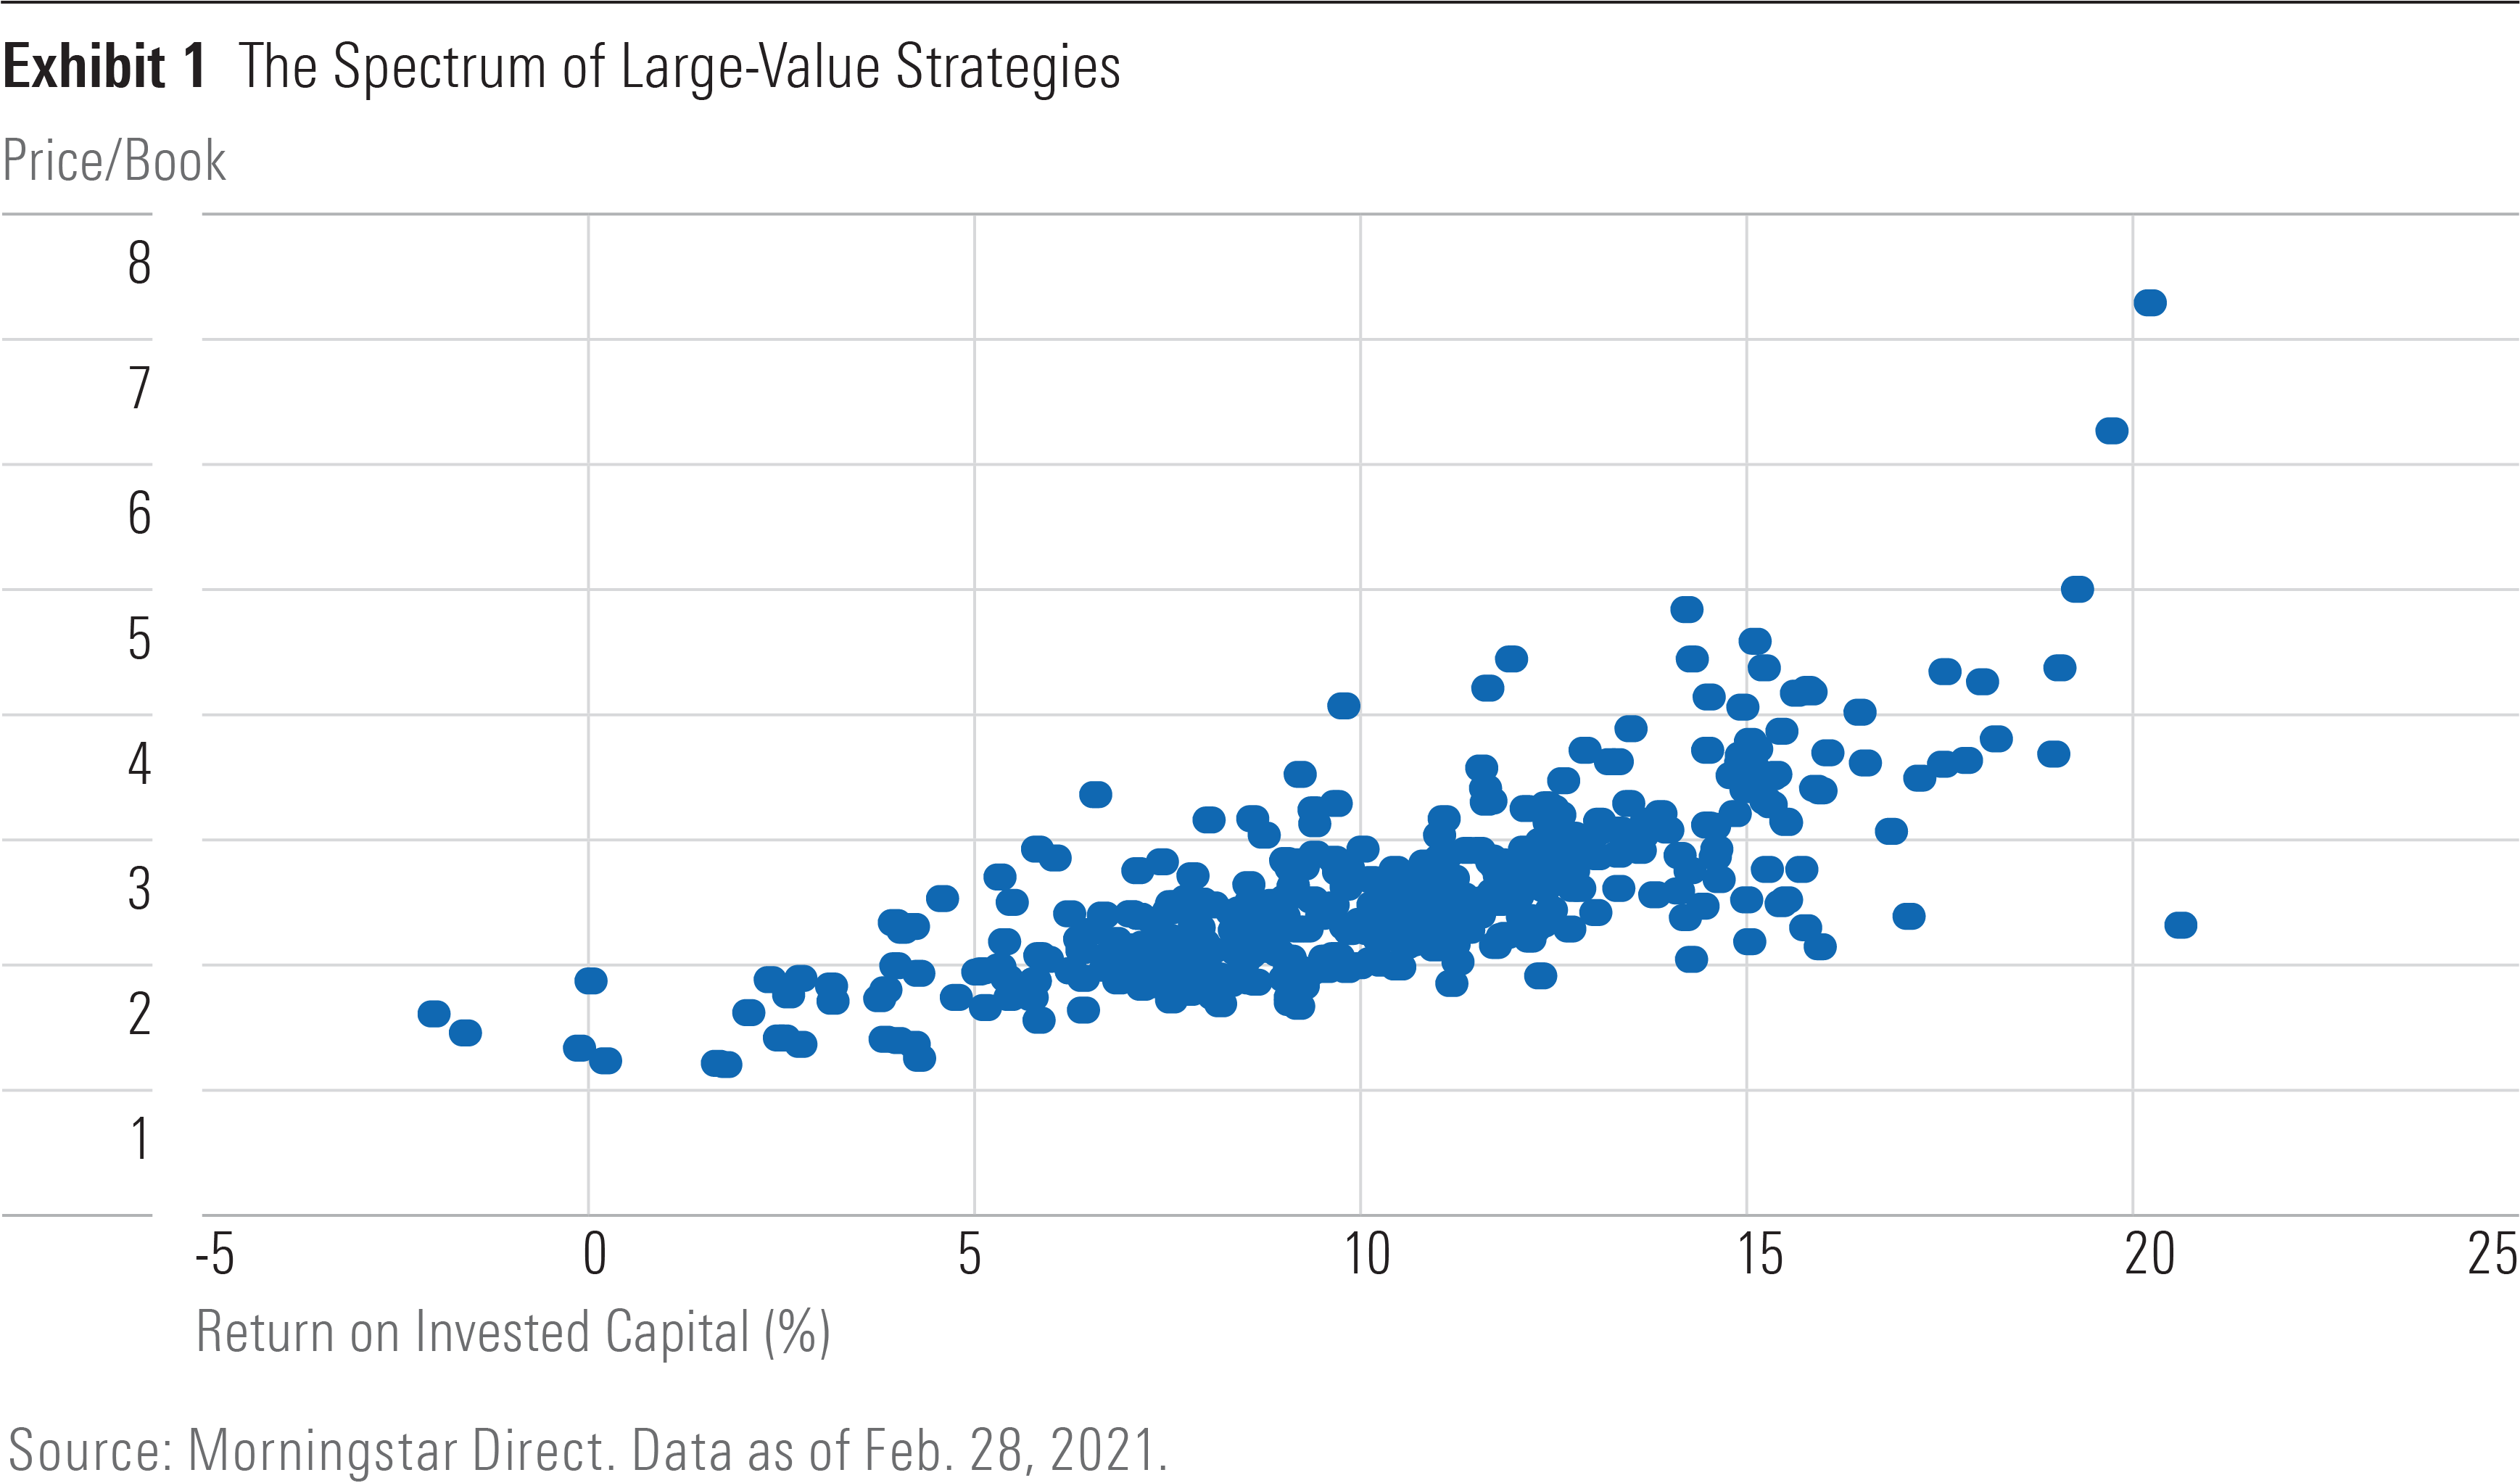
These two strategies exist at opposite ends of the value investing spectrum. One end houses portfolios with lower-quality, cheaper stocks. The opposing side features portfolios of high-quality stocks with correspondingly higher price tags. Exhibit 1 illustrates this relationship between price and quality. It includes all exchange-traded funds and open-end mutual funds in the large-value Morningstar Category and plots each fund’s average price/book ratio against its profitability, as measured by return on invested capital (a proxy for quality).

There is a clear relationship between price and quality. Funds typically trade off one trait for the other. Those at the far ends of this spectrum typically hold very different types of stocks. These stocks are different in the sense that they don their relatively low valuation multiples for different reasons. Understanding the forces pushing their multiples down has implications for the risks they bear and their expected performance.
Sick Companies
William Bernstein, the financial advisor and noted author, offers one of the best descriptions of value strategies, referring to them as the financial equivalent of an intensive care unit: a ward “containing vast numbers of companies maintained on the fiscal equivalent of ventilators and potent antibiotic and heart medicines.” [1]
That description paints a rather ugly picture, but it contains a notion of truth. Bernstein’s “sick company” metaphor readily applies to stocks at the low end of the price range because their businesses are often struggling, for any number of reasons, and they tend to have highly uncertain outlooks. They are decidedly not healthy. The market likely recognizes that and doesn’t expect them to perform well, so it assigns a lower price to give investors incentive for bearing their risks.
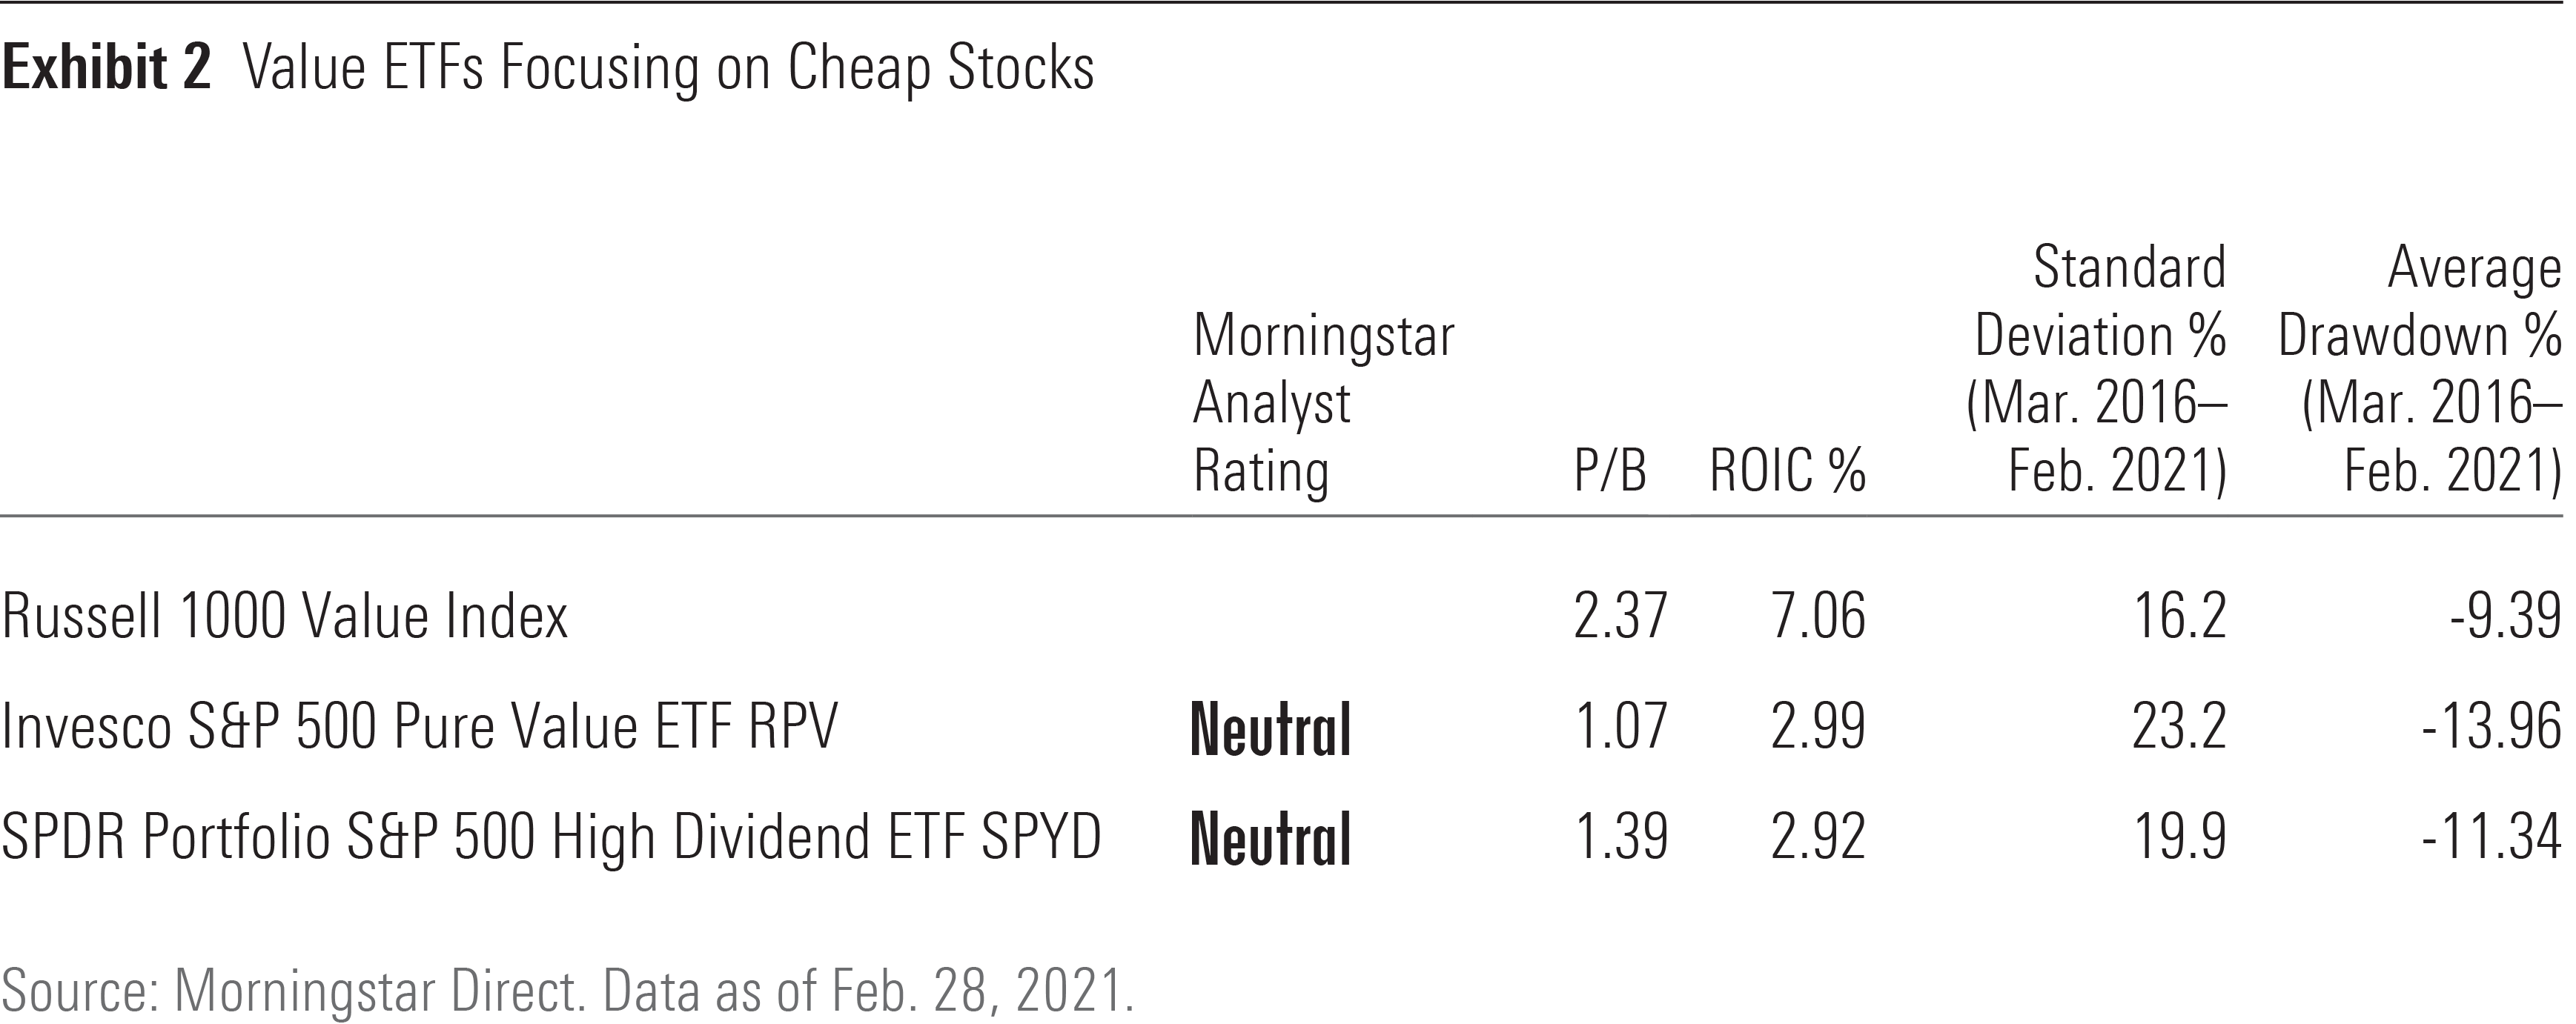
RPV lands on the intensive care registry, as does Neutral-rated SPDR Portfolio S&P 500 High Dividend ETF SPYD. Both portfolios have some of the lowest average price multiples and profitability among funds in the large-value category and have proved riskier than the Russell 1000 Value Index. Compared against that benchmark, their standard deviations are often higher and their drawdowns deeper, as Exhibit 2 shows.

Sector biases further complicate the situation. Holding the cheapest stocks in the market causes RPV and SPYD to be overweight in cyclical segments. Both are top-heavy in energy and financials and share similarly large stakes in companies like Exxon Mobil XOM and American International Group AIG, making them more sensitive to market movements than the Russell 1000 Value Index.
Some of the funds in this cohort may possess another element of risk that isn’t easily observed in traditional risk metrics. Funds holding names with the lowest valuations or those with high trailing yields tend to have exposure to stocks with recent price declines or negative momentum. These stocks are likely to continue performing poorly in the near term and subtract from their fund’s overall performance.
The acute risks these funds court are unlikely to be compensated with commensurately large returns. For this reason, RPV and SPYD carry a Neutral rating.
Wonderful Companies at Fair Prices
Bernstein’s “sick company” metaphor is far from a panacea. Not all value strategies focus on dirt-cheap stocks with depressed outlooks.
Funds at the opposite end of the value spectrum, like QDF or Schwab U.S. Dividend Equity ETF SCHD, take a more-balanced approach and often hold shares in a number of more stable, profitable firms. Both ETFs screen for stocks with durable quality characteristics, then target names with higher yields than the market. Household names like 3M MMM, Home Depot HD, and Verizon Communications VZ are common holdings in both funds.
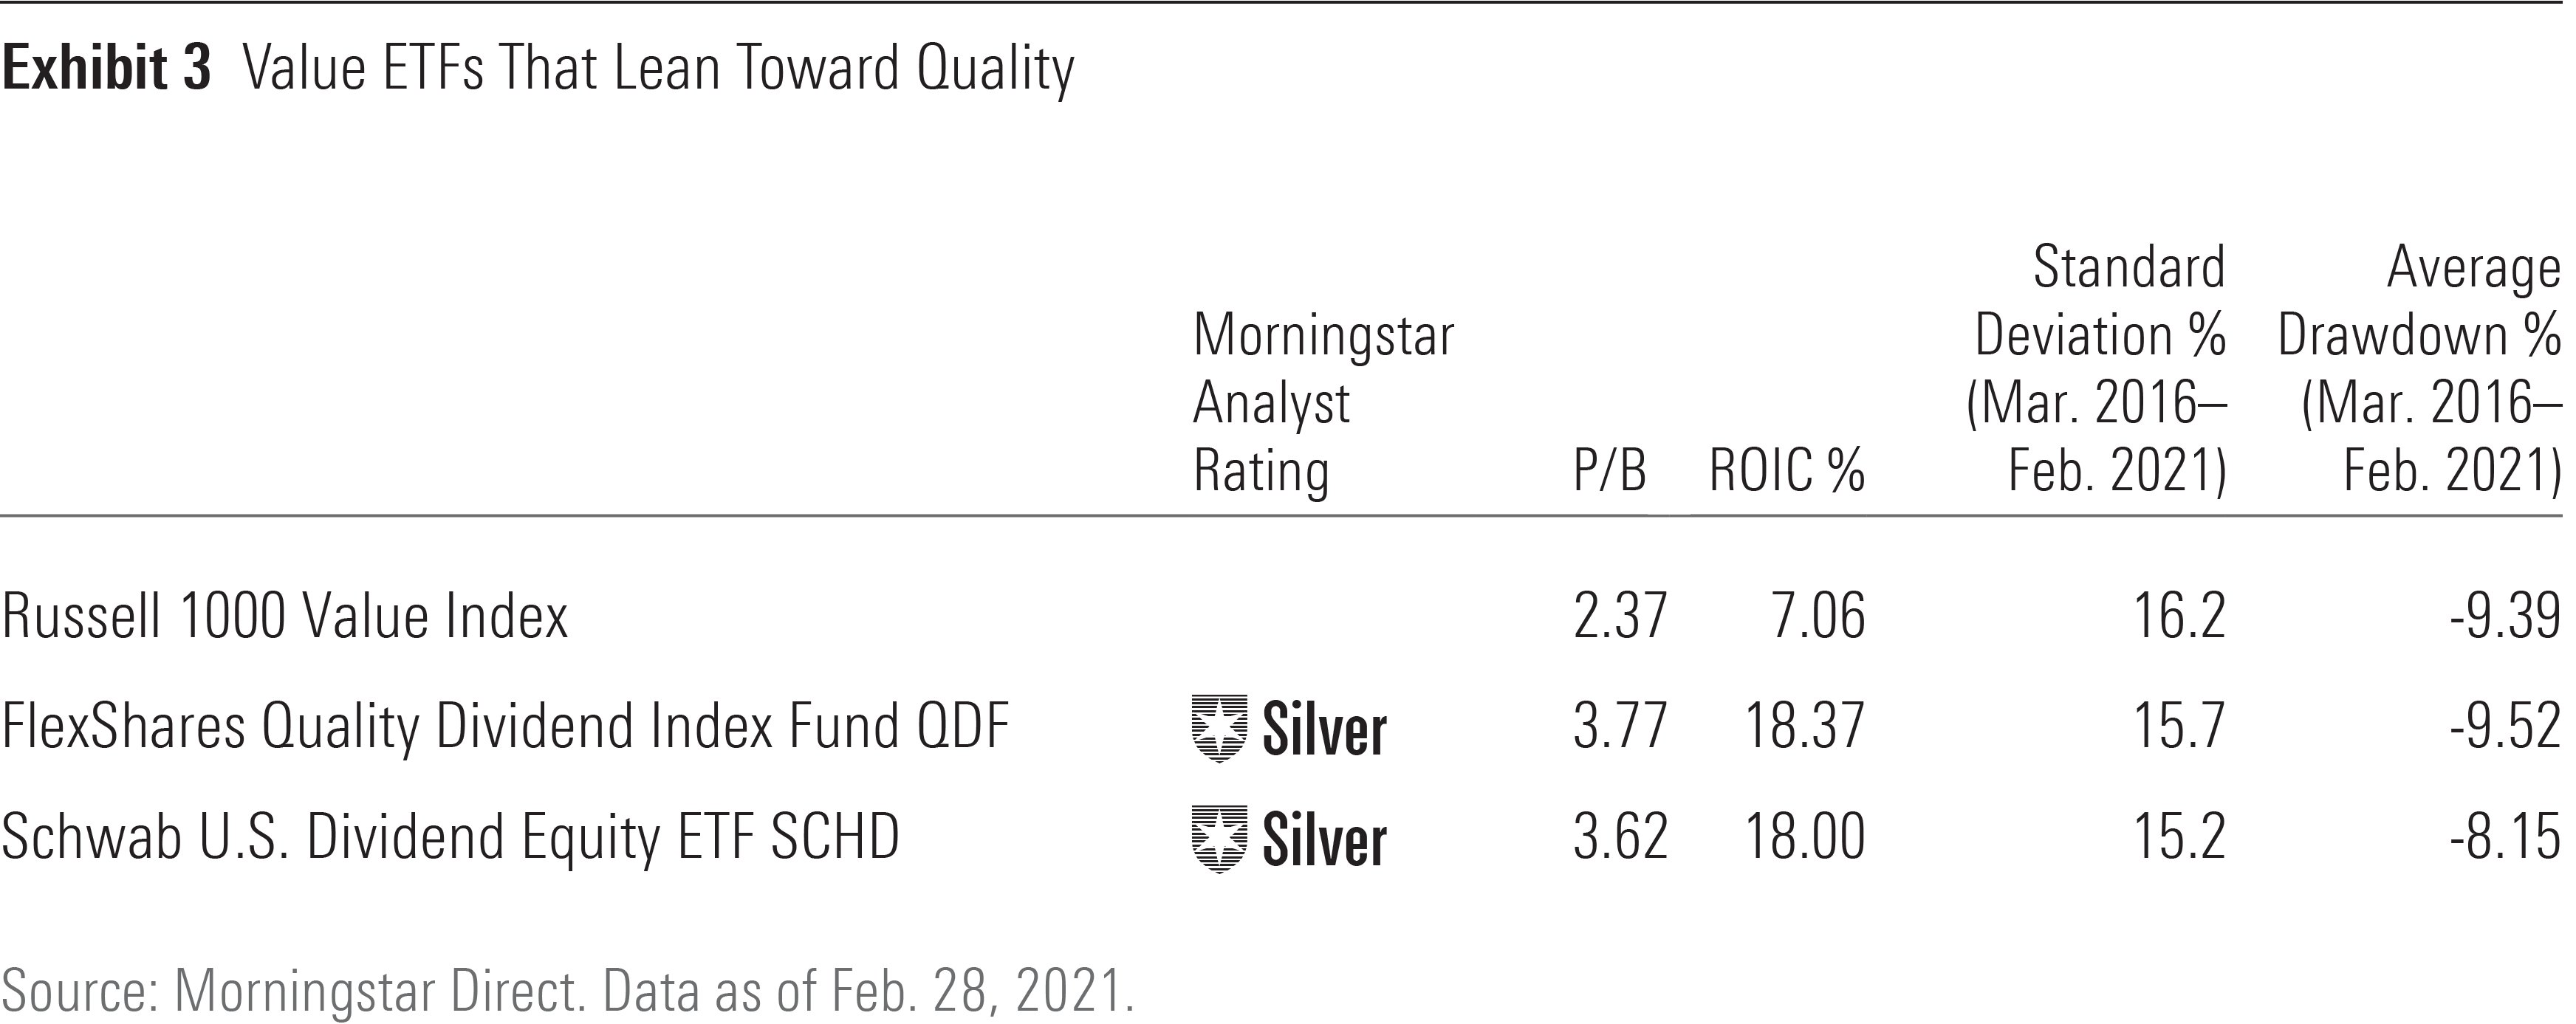
Large, mature companies such as these may not immediately come to mind when one thinks of value investing. They trade at higher multiples than the market, but their multiples are far from the most expensive. The reason has nothing to do with uncertain outlooks. Instead, these companies are often giants in their respective industries and face tough competition, meaning their ability to grow earnings at above-average rates is limited. Lower multiples can offset some of that tepid growth and facilitate reason-able performance. On balance, QDF and SCHD typically sport slightly higher average price/book ratios and higher-than-average profitability than the Russell 1000 Value Index, as shown in Exhibit 3.

The upside of these strategies is that they tend to be more stable than funds like RPV and SPYD. Their performance pokes along at a more timid pace, which is part of the reason they didn’t perform as well as RPV or SPYD over the past six months. But slow and steady is more likely to win the race--especially over the long term. These funds strike a prudent balance between value and quality and risk and reward. This should help them to outperform the Russell 1000 Value Index over a full market cycle and explains why both funds are rated Silver.
All Good Investing Is Value Investing
Systematic approaches to value investing tend to equate value with low price multiples. But value investing, at its heart, boils down to purchasing assets for less than they are worth. That definition is quite broad. It doesn’t rely on low multiples and has no constraints on time. Framed in that way, many investments, including those that trade at higher price multiples today, could qualify as value investments.
For instance, the S&P 500 closed at 1,468 on Sept. 30, 2000--the height of the late-1990s Internet bubble. At the time, its price/earnings ratio was above 27, considerably higher than its long-term average of about 15. From that perspective, the S&P 500, and funds that tracked it, looked expensive.
Fast forward more than 20 years to Dec. 31, 2020, when the index closed at 3,695. After three bear markets and countless drawdowns, the S&P 500’s price managed to grow at about 4.9% per year (the index’s total return was nearly 7% annualized over this same span). Over the same period, the collective earnings of these 500 firms compounded at a rate of 2.6% annualized. Few would question the observation that the collective value of these 500 companies has grown over those two decades. In hindsight, a fund tracking the index--even at eye-popping valuations--was by no means a bad investment. Good investments--those that inherently become more valuable over time--represent a form of value investing. From that perspective, you don’t need to own a value strategy to be a value investor. [2]
References
1. Bernstein, W. 1999. "Value Stocks: Hidden Risk or Free Lunch." http://www.effi-cientfrontier.com/ef/999/risk.htm
2. S&P 500 earnings growth figures were sourced from Robert Shiller's website: http://www.econ.yale.edu/~shiller/data/ie_data.xls
Disclosure: Morningstar, Inc. licenses indexes to financial institutions as the tracking indexes for investable products, such as exchange-traded funds, sponsored by the financial institution. The license fee for such use is paid by the sponsoring financial institution based mainly on the total assets of the investable product. Morningstar, Inc. does not market, sell, or make any representations regarding the advisability of investing in any investable product that tracks a Morningstar index.

/s3.amazonaws.com/arc-authors/morningstar/78665e5a-2da4-4dff-bdfd-3d8248d5ae4d.jpg)
/cloudfront-us-east-1.images.arcpublishing.com/morningstar/24UPFK5OBNANLM2B55TIWIK2S4.png)
/cloudfront-us-east-1.images.arcpublishing.com/morningstar/T2LGZCEHBZBJJPPKHO7Y4EEKSM.png)
/d10o6nnig0wrdw.cloudfront.net/04-18-2024/t_34ccafe52c7c46979f1073e515ef92d4_name_file_960x540_1600_v4_.jpg)
:quality(80)/s3.amazonaws.com/arc-authors/morningstar/78665e5a-2da4-4dff-bdfd-3d8248d5ae4d.jpg)