
Why Market-Timing Fails
The culprits are 1) opportunity cost and 2) unreliable signals.
/s3.amazonaws.com/arc-authors/morningstar/1aafbfcc-e9cb-40cc-afaa-43cada43a932.jpg)

Editor’s Note: A previous version of this article, published the morning of Nov. 14, 2023, used erroneous data, affecting the exhibits and text. It was temporarily unpublished while the issue was addressed.
Forward Progress
Back in the day, there were two immediate reasons not to time the stock market by exiting when prospects seemed dim and reentering after they brightened. The causes were costs and taxes. Stock trades were pricey, while most mutual funds carried upfront sales charges. Also, as tax-sheltered retirement accounts were uncommon, investors who profited from market-timing even after paying their trading expenses were typically forced to share their profits with the IRS.
Those barriers have vanished. Brokerage and mutual-fund commissions are all but extinct, and 401(k) and IRA accounts house $20 trillion of tax-sheltered retail assets. What’s more, investors now have access to thousands of exchange-traded funds at a moment’s notice. Today’s conditions are a market-timer’s dream.
Yet two additional obstacles remain.
Opportunity Costs
One impediment was addressed by my colleague Adam Fleck in last week’s “Staying Invested Beats Timing the Market — Here’s the Proof.” With the classic form of market-timing, investors either own stocks or not. That approach extracts a high opportunity cost. Over time, equities have averaged a 7% annualized gain after inflation, intermediate-term bonds 2%, and cash nothing at all. In essence, then, swapping equities for bonds or cash cedes half a percentage point each month. In its own way, that tariff is just as damaging as the one levied by the IRS.
Consider, for example, the outcome from Fleck’s study. He compared Morningstar’s price/fair value estimate for U.S. stocks against the market’s subsequent three-year returns from summer 2002 through summer 2020. As shown by the following chart, there was a clear pattern.
Stock Valuations and Future Returns
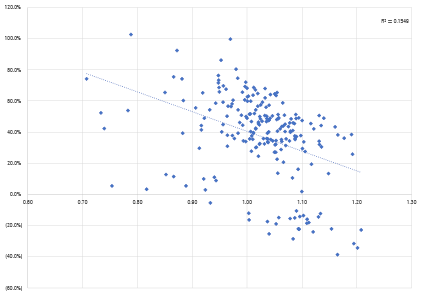
When Morningstar’s researchers believed that stocks were relatively cheap, they usually performed well. Not once did equities record a three-year loss after a month when the price/fair value estimate scored below 0.90. Similarly, the cumulative three-year return for U.S. equities never surpassed 60%—an amount that otherwise occurred on 37 occasions—when the price/fair value estimate exceeded 1.10.
Right, But Wrong
Hurrah! The research from Morningstar’s equity team was accurate enough to predict subsequent stock returns. Were their forecasts compiled for publication, the results would pass academic muster, as the regression’s output easily meets the standard for statistical significance. Yet when Fleck devised a market-timing strategy that incorporated those allegedly significant signals, the strategy flopped.
When Fleck ran the numbers, the fully invested U.S. equity portfolio not only outgained the market-timing portfolio he had created using the price/fair value signals, but it also scored superior risk-adjusted returns, as measured by Sharpe ratio. Being largely right was insufficient. To overcome the steeper investment odds that came from leaving the stock market, the price/fair value indicator had to be impeccably correct. That task it could not accomplish.
Unreliable Signals
The scourge of opportunity cost disappears when investors switch not between equities and fixed-income securities, but instead between different varieties of stocks. In such a case, the expected return on each investment is roughly equal. Nor is market-timing an overall liability during periods when equity performance is sluggish. If stocks generate only slight real gains over 15 or 20 years, as sometimes occurs, then investors pay little penalty for holding bonds and/or cash.
There is, however, another problem. Finding meaningful investment indicators requires a great deal of data—at least a decade’s worth. Unfortunately, by the time the insight occurs, the signals have often changed. This should be a familiar lesson. We all know, at least intuitively, that it’s one thing to find signals that once worked, and quite another to identify those that still do.
To illustrate that precept, I will cite one of my own articles. In 2020, I partially retracted my argument that the Shiller CAPE ratio—like Morningstar’s price/fair value estimate, a yardstick that attempts to determine whether U.S. equities are expensive or cheap—was a useful stock market predictor. Whereas the link between CAPE ratios and future equity returns had long been modest, from 1995 through 2010 the relationship greatly strengthened. The chart below shows the correlation during that period between one month’s CAPE ratio and the next 10 years’ performance of the Morningstar US Market Index in inflation-adjusted terms.
A Powerful Indicator
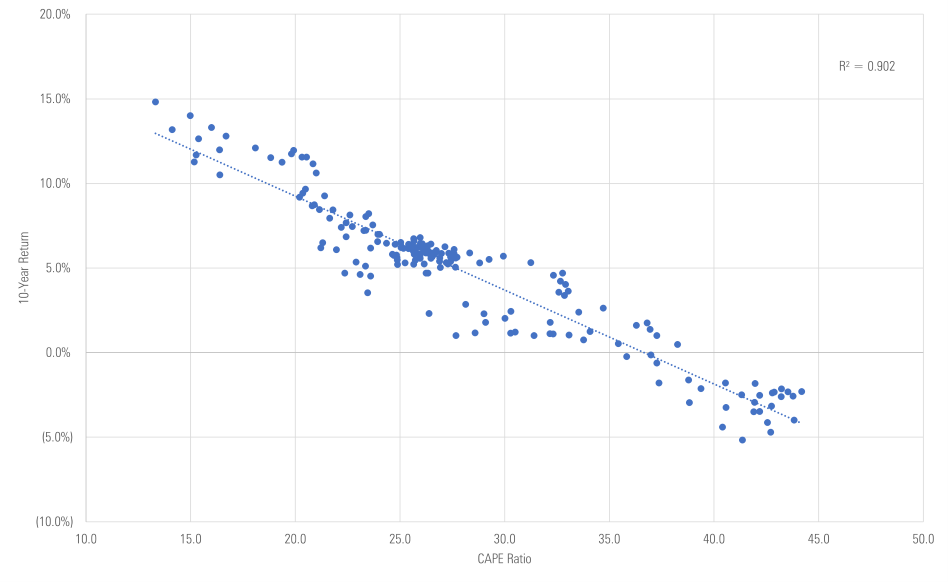
Now that was a signal! Statistically, such a powerful relationship will occur solely by accident about as often as you would checkmate Magnus Carlsen by randomly moving your chess pieces. (Although, admittedly, somewhat more frequently than a monkey typing the complete works of Shakespeare.)
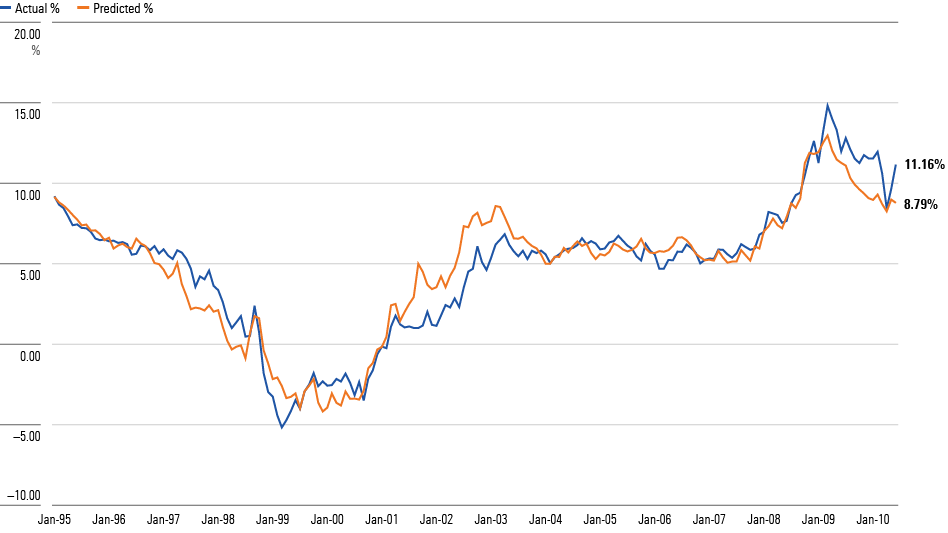
The next graph shows the same data from a different angle. It depicts the actual annualized 10-year return on U.S. equities, once again in real terms, with the return predicted by the regression. That is, the chart compares 1) real-life performance against 2) the regression’s forecast, given the level of the CAPE ratio when the 10-year period began. As you can see, the two lines neatly align.
Another View
Out of Sample
Let’s now update that latter illustration, using stock market returns that have occurred since that article was published. The next graph shows the outcomes for the succeeding 3.5 years. Once again, the chart compares the real annualized returns posted by U.S. stocks over the following decade against the expected returns that were forecast by the (original) regression. As I have retained the previous graph’s scale, the relative accuracy of the new forecasts can be ascertained by comparing the distance between each line. Are they essentially on top of each other, as with the above chart, or do they diverge?
With Updated Data
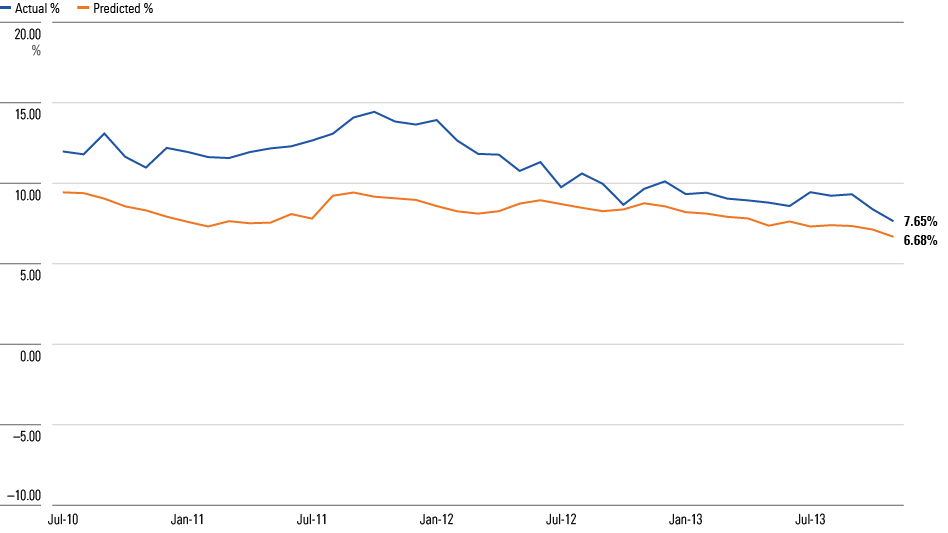
They diverge. The Shiller CAPE ratio indicator predicted that, from mid-2010 through late 2013, the U.S. stock market was moderately more attractive than usual, relative to its recent history. In fact, stocks proved to be much more attractive than normal. In practice, the difference between the predicted and actual results was harmless. “Buy” was indeed the correct signal. However, for the first two years of the period the gap between the predicted and actual performance was large enough to send a false alarm, had the overall values been lower. The method made the right call but was somewhat fortunate in doing so.
Wrapping Up
When coupled with plausible economic explanations, strong correlations between timing signals and future market returns can be very convincing. However, it doesn’t take much to shift the outcomes from “impeccably correct,” as the Shiller CAPE ratio was from 1995 through 2010, to “largely right,” as with Fleck’s exercise or the Shiller CAPE ratio of the next few years. And largely right is not good enough. For market-timing signals to work well enough to justify their usage, they must meet the higher standard.
The opinions expressed here are the author’s. Morningstar values diversity of thought and publishes a broad range of viewpoints.
The author or authors do not own shares in any securities mentioned in this article. Find out about Morningstar’s editorial policies.
/cloudfront-us-east-1.images.arcpublishing.com/morningstar/ECVXZPYGAJEWHOXQMUK6RKDJOM.jpg)
/cloudfront-us-east-1.images.arcpublishing.com/morningstar/KOTZFI3SBBGOVJJVPI7NWAPW4E.jpg)
/cloudfront-us-east-1.images.arcpublishing.com/morningstar/V33GR4AWKNF5XACS3HZ356QWCM.jpg)
:quality(80)/s3.amazonaws.com/arc-authors/morningstar/1aafbfcc-e9cb-40cc-afaa-43cada43a932.jpg)