
The State of M&A in 10 Charts
Deal volume fell, but average deal size rose in 2017, according to PitchBook's 2017 M&A report.

By Kyle Stanford
This article originally appeared on PitchBook.com.
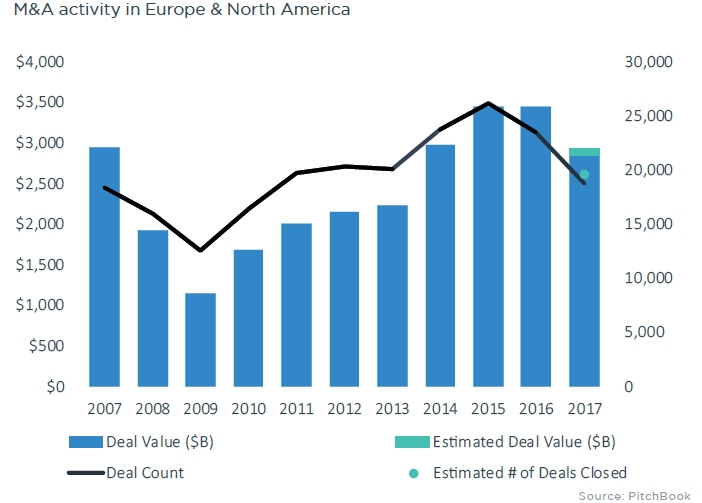
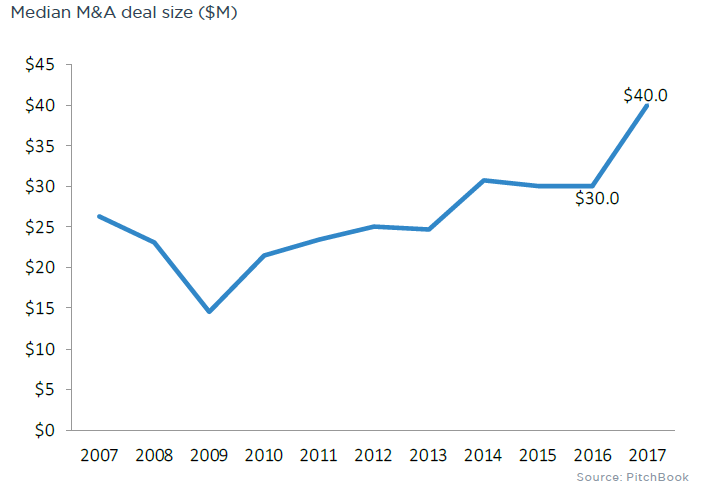
Merger and acquisition activity in North America and Europe added up to $2.93 trillion in 2017, marking the fourth straight year of at least $2.9 trillion in total deal value. Deal count decreased nearly 17% year over year, but multiple factors converged to drive median deal size up to $40 million for the year, a 33% increase over 2016.
Our 2017 Annual M&A report provides the analysis behind these data points as well as insight into trends of all types, including which sectors saw the biggest growth and how specific macroeconomic factors affected the industry. Here are 10 key charts from the report, which is available to download in full here.
Corporate cash reserves and ballooning PE fund sizes boost sustained deal value
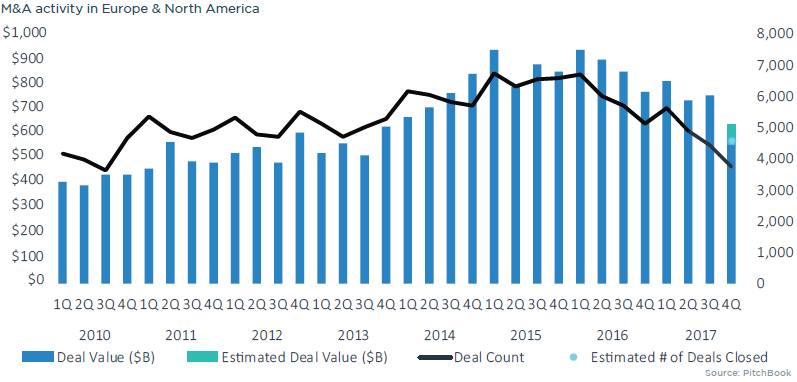
Macroeconomic factors contribute to M&A
Buyers are tapping the brakes as they incorporate recent acquisitions into existing operations
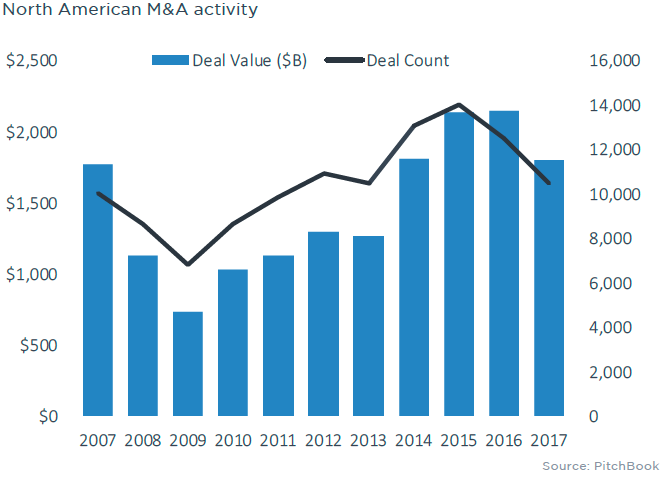
M&A in North America declines by 16% YoY
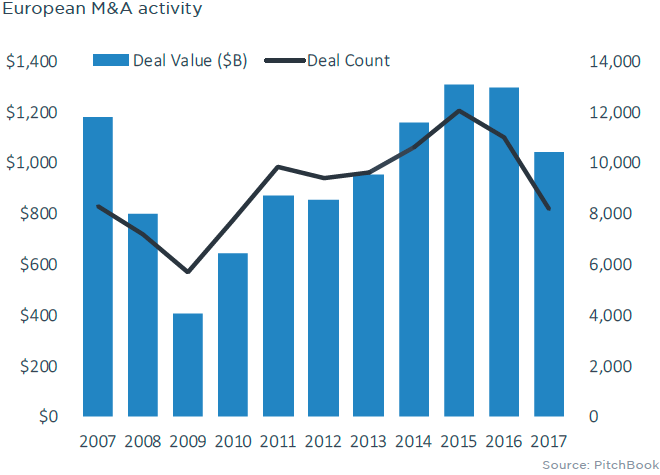
In Europe, M&A value fell by 19%
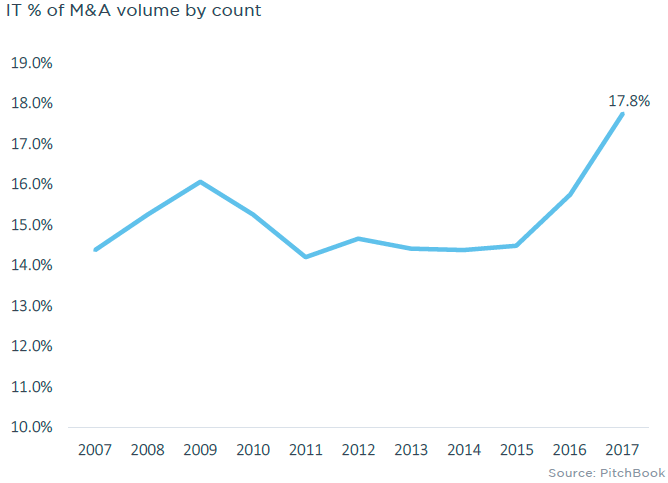
Multiple factors are driving IT's relative popularity
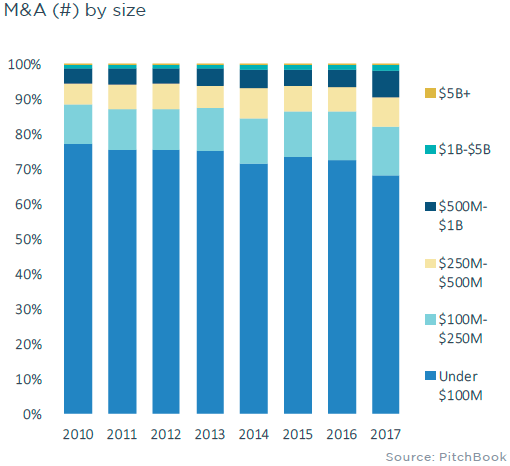
Lower middle market accounts for smaller portion of deal value
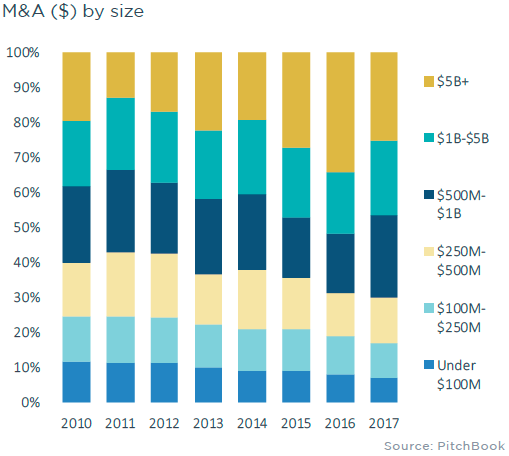
Deal size inflation is more evident
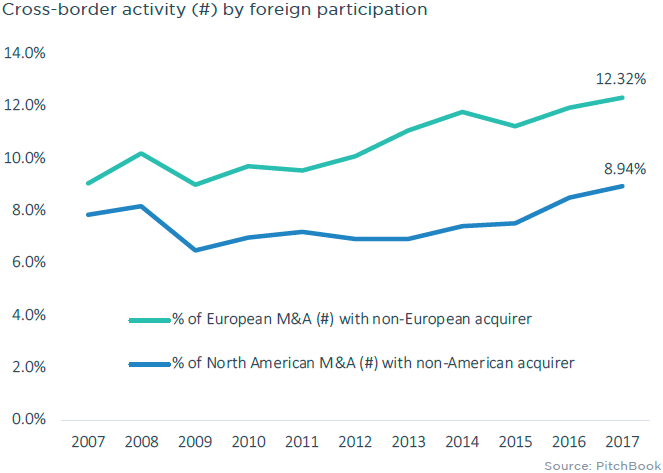
Cross-border M&A is in vogue as of late, particularly in Europe
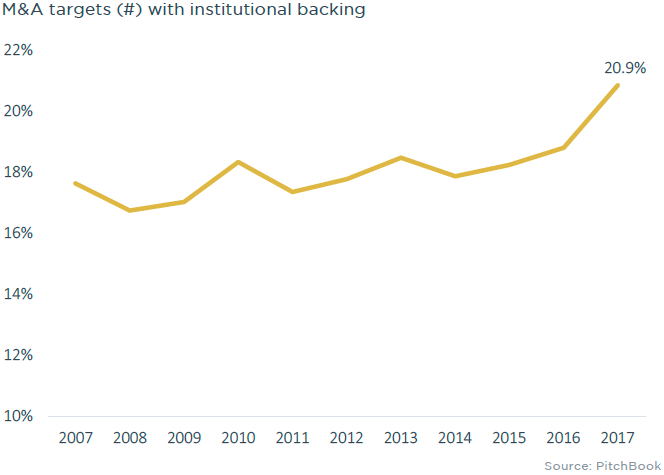
More than one-fifth of M&A targets have institutional backing
/cloudfront-us-east-1.images.arcpublishing.com/morningstar/PLMEDIM3Z5AF7FI5MVLOQXYPMM.jpg)
/cloudfront-us-east-1.images.arcpublishing.com/morningstar/I53I52PGOBAHLOFRMZXFRK5HDA.jpg)
/cloudfront-us-east-1.images.arcpublishing.com/morningstar/CEWZOFDBCVCIPJZDCUJLTQLFXA.jpg)