
Private Equity: PE Outperforms and Closes the Valuation Gap
Private equity performance is primed to improve relative to public equities as multiples between public and private markets converge.

- Private equity tends to outperform in periods of falling public equity prices, having done so in 19 of the 20 quarters since 2001 in which public equities registered negative returns.
- PE is highly correlated to public equities, meaning absolute returns in recent periods and the near term will probably be lower than in years of a booming public equity market.
- PE funds recorded healthy gains in the first quarter of 2018 while public equities lagged in an increasingly volatile market. The gap in enterprise value/EBITDA multiples shrank to the lowest level in four years.
Our recent research has corroborated previous findings that private equity funds are more correlated to public equity markets than conventional wisdom would lead many investors to believe. To assess the correlation, we created a "PE index" by calculating the aggregate percentage change in net asset value for each group of funds in a sample, considering contributions and distributions during the quarter. The PE index had a correlation of 0.75 with the S&P 500 since 2001 and 0.84 since 2008. In light of this and the tumultuous year for public equities in 2018, our initial inclination was that private market strategies would follow a similar downward trajectory. Our hypothesis changed, however, when examining the data more closely. We think returns will remain solidly in positive territory, though we still believe that absolute returns for PE funds will fall throughout reporting periods in 2018. Furthermore, we anticipate performance relative to public equities to increase.
Since 2001, PE funds have outperformed the S&P 500 in 19 of the 20 quarters in which public equity returns were negative. Skeptics will claim that PE firms are simply being overly optimistic (or even naive) during these public market drawdowns, but we find a hesitance by PE funds to aggressively mark to market regardless of the direction of the change. Indeed, in the 20 quarters since 2001 when public equity returns exceeded 5%, PE returns have trailed 15 times.
Relative Global PE Quarterly Performance When S&P 500 TR Gained 5%-Plus/Posted a Loss (2001 to 1Q18)
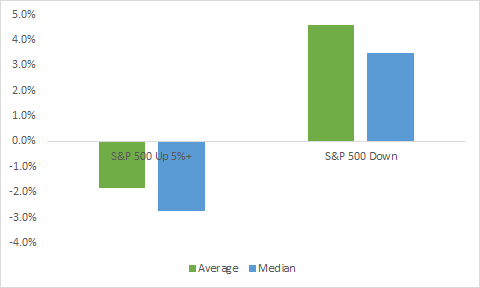
- S
ource: PitchBook
It is volatile periods like 2018 when we have traditionally observed the biggest breakdowns in correlation. Particularly given the volatility underpinning public equity movement and the continued strength of fundamentals and the macro backdrop, we expect PE managers to be cautious when marking to market existing investments through the next several reporting periods.
During this poor-performing year in public equity markets, purchase price multiples continued climbing in private markets as a rising sum of capital flowed in and deal-making remained robust. Such an influx of capital has led to PE multiples rising in tandem with public multiples in most years since the financial crisis; however, 2015 saw a divergence in multiples that has remained relatively steady. While public equity markets have oscillated year to date in 2018 with multiples slightly contracting, PE has seen the median buyout multiple expand marginally; the longer-term trend of multiples converging looks to continue.
Median EV/EBITDA Multiples for U.S. PE Buyouts and S&P 500
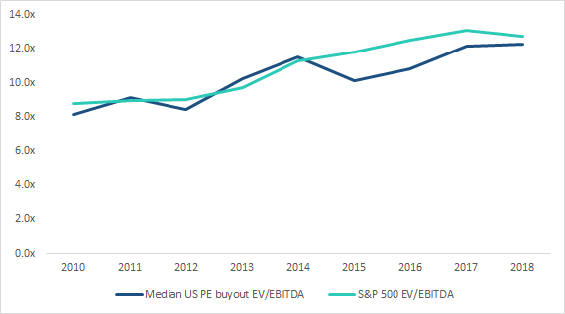
-
Source: PitchBook
Private market transactions are receiving multiple bids, and the spread between public and private multiples is once again disappearing as the oft-used phrase "too much money chasing too few deals" rings true. Deal sizes are also rising, and larger buyouts tend to transact at higher multiples. The higher proportion of large deals is skewing the composition of deal multiples, and thus the median, upward. Worth noting is that many of these larger deals on which we have multiples data are sourced via public companies in take-privates.
Another factor that could bring down public equity performance in 2019 is rising interest rates. Discounted cash flow models are commonly used to value both public and private companies. Even though they may use the same valuation technique, the prices of public companies change more quickly compared with PE portfolio companies, which are typically marked to market on a quarterly basis. Furthermore, public market investors often overshoot when buying and selling, meaning, for example, a 5% decline in fair value may lead to a 10% sell-off. PE tends to be significantly less volatile; since 2001, PE has registered 16 quarters with returns above or below 5% compared with 40 for the S&P 500. Furthermore, a down quarter in public markets raises the chance of convergence because PE returns were flat to positive in 19 of the 20 quarters in which public markets were in negative territory. Given the above points, we expect PE to outperform public markets in the near term as public and private multiples converge.
/cloudfront-us-east-1.images.arcpublishing.com/morningstar/PLMEDIM3Z5AF7FI5MVLOQXYPMM.jpg)
/cloudfront-us-east-1.images.arcpublishing.com/morningstar/I53I52PGOBAHLOFRMZXFRK5HDA.jpg)
/cloudfront-us-east-1.images.arcpublishing.com/morningstar/CEWZOFDBCVCIPJZDCUJLTQLFXA.jpg)