
Oil Sands Will Survive and Then Thrive
The market does not appreciate their near-term resiliency nor the long-term cash flow potential.
/s3.amazonaws.com/arc-authors/morningstar/767bcaab-ca87-4ef4-95f9-7d05d83708bc.jpg)
Since the start of the oil price and stock market crashes in March, the oil sands stocks we cover have vastly underperformed the general market along with oil prices, missing out on the subsequent rallies. Investors appear concerned about producers’ near-term balance sheet health and look to be questioning these companies’ ability to generate sustainable long-term cash flow from the vast resource potential that lies in the oil sands. In our view, the oil sands producers have ample liquidity to survive the uncertain demand environment. Additionally, oil sands maintenance production costs are lower than the market thinks, as a significant portion of capital is spent on the up-front build. We expect producers to generate free cash flow at lower-than-expected oil prices and can pay down debt and meet dividend obligations.
Furthermore, we still anticipate that all three major pipeline expansion projects--Enbridge’s Line 3 replacement, TC Energy’s Keystone XL, and the Trans Mountain Expansion--will be built by the end of 2023. In our view, this will provide enough takeaway capacity to stabilize heavy oil pricing and greatly expand market access. Assuming that the pipelines are built, we expect oil sands producers to tap into their vast resource potential and generate significant long-term free cash flow if oil prices recover to our midcycle average annual $55/barrel West Texas Intermediate forecast.
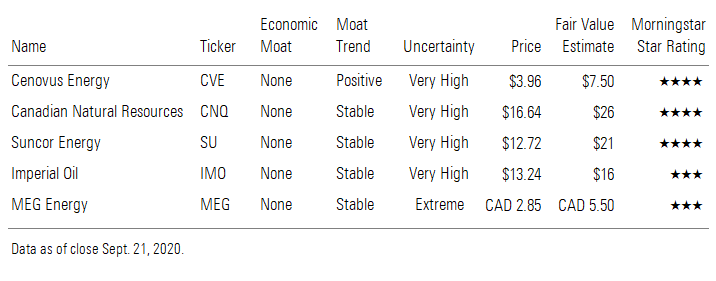
Cenovus Energy CVE and Canadian Natural Resources CNQ are our top picks in the subsector. Given the lack of near-term catalysts, however, it could be some time before the market comes around to our way of thinking, and investors must be prepared for further volatility in the interim. But we recommend staying the course, because once new pipes are built, we expect significant production growth and cash flow generation.
Low Oil Prices Have Caused Investors to Mistakenly Abandon the Oil Sands The COVID-19-related collapse in crude consumption has wreaked havoc on oil markets this year. In March, the impact was exacerbated by a brief price war between Saudi Arabia and Russia, sending WTI crude into the $20s. The benchmark has yet to fully recover, with futures prices still well below pre-COVID-19 levels and 20%-30% below our midcycle forecast of $55/bbl. Canadian producers have suffered more, because Western Canadian Select prices trade at larger discounts to Gulf Coast prices due to quality and location differentials (and tumbled to single digits in March). But prices have since stabilized north of the border as well.
Even though prices have rebounded, they still sit well below precrash levels. Investors appear concerned about the near-term solvency of the oil sands producers and whether these companies can generate sustainable long-term cash flow from the sands reserves. Accordingly, investors have left the oil sands stocks for dead--especially higher-leverage names like Cenovus and MEG Energy MEG, but also integrated Canadian giant Suncor SU.
We think the market is too short-sighted in its view of the major oil sands producers. In our view, the producers have ample liquidity to survive the uncertain demand environment, can generate free cash flow at lower-than-expected levels to pay down debt and meet dividend obligations, and have immense free cash flow potential if oil prices recover to our midcycle average annual price forecast.
Maintenance Cash Costs Are Lower Than the Market Anticipates Oil sands production requires substantial up-front capital investment, which is the principal reason oil sands generally sit higher on the global cost curve. Capital is needed to build extraction and processing facilities that are used throughout the 30-year life of the project and can range from $18,000 to $60,000 (CAD 24,000 to CAD 80,000) per annual flowing barrel per day. The average in situ project of 40 thousand barrels a day requires $25,000 (CAD 32,000) per flowing barrel in up-front capital, amounting to $1 billion (CAD 1.3 billion) in up-front costs. However, go-forward cash costs can be very competitive, allowing producers to generate free cash flow when oil prices are low. Sustaining capital can range from $2 to $6/bbl (CAD 3 to CAD 8). With an average sustaining capital cost of $4 (CAD 5) for a 40 mbbl/d project, producers spend $55 million (CAD 70 million) on an annual basis, roughly 6% of the up-front capital requirements.
Oil sands project economics vary based on the type of the project. Mining projects with upgraders generally have the best go-forward economics, followed by nonupgraded in situ projects; nonupgraded mining projects fare the worst. Canadian Natural’s upgraded mining projects possess the best oil sands go-forward economics and start generating free cash flow at $30/bbl WTI. Cenovus’ oil sands projects are the industry standard for in situ projects, with free cash flow potential with WTI prices above $38/bbl WTI. With WTI prices hovering in the low $40/bbl range, most of the oil sands projects operated by our coverage can generate free cash flow. Nonupgraded mining projects, such as Imperial Oil’s IMO Kearl and Suncor’s Fort Hills, require WTI prices of $45-$50/bbl and are out of the money at this time.
However, many oil sands producers also output other hydrocarbons such as light crude, medium crude, and natural gas. If we account for this and the upstream proportion of corporate dividend obligations, upstream average break-evens hover around $40/bbl WTI for our oil sands coverage. Thanks to its vast hydrocarbon diversification and scale, Canadian Natural possesses the lowest corporate break-even of $35/bbl WTI, even with its generous dividend payment, which equates to $3.50/bbl (CAD 4.50/bbl).
Looking beyond upstream operations, Cenovus, Imperial, and Suncor engage in refining activities, which generally hedge against heavy oil crude differentials. However, demand for refining products has also suffered from COVID-19, resulting in a dip in refining utilization and cash flow. Fortunately for the integrated companies, refining utilization appears to be rising and holds the potential to improve corporate economics as demand continues to improve.
When taking into account the full hydrocarbon value chain, we see all of our integrated companies with corporate break-evens below $40/bbl. However, Canadian Natural still leads the way, even without significant integration.
The Oil Sands Will Thrive in the Long Run… Beyond 2021, we still expect robust crude oil demand growth, as disruptive factors like electric vehicles are likely to take much longer to meaningfully reduce the intensity of global crude consumption. Yet U.S. shale would be the cheapest source of incremental supply, and it has a marginal cost of $55/bbl for WTI. Prices must therefore recover to encourage this expansion, or the glut will flip into a painful shortage.
In addition to improving crude oil demand, we expect all three of Canada’s major pipeline projects--Keystone XL, Trans Mountain Expansion, and Enbridge’s Line 3 replacement--to be built and fully operational by 2023, providing ample takeaway capacity to support significant production growth. Once the new pipes are placed into service, we think that the bulk of the incremental oil sands production will wind up on the U.S. Gulf Coast, either for processing or export. Once at the Gulf Coast, Western Canadian Select should price off Maya, which is the heavy crude benchmark in the region. We expect Maya to trade at a quality discount to Brent of about $8-$12/bbl, in line with the historical range. After adjusting for a slight quality differential compared with Maya (WCS has an API gravity of 20.5 versus Maya’s 22) of about $1-$2/bbl, we expect WCS to price at the transportation differential from its original point of Hardisty. With excess pipeline capacity in the medium term, we expect pipeline tolls to the U.S. Gulf Coast to range from $8 to $14/bbl. After backing out our midcycle WTI-Brent differential of $5/bbl, we forecast our midcycle WCS-WTI differential to widen to $18/bbl.
Even though the spot differential of $12/bbl represents better pricing than our midcycle forecast, we think it sits artificially low. The downturn in crude prices has created temporary excess capacity on pipelines and caused mandatory curtailments not to be needed in the near term. However, during the fourth quarter of 2018, when the pipelines were operating at full capacity and curtailments weren’t implemented, the average differential was almost double our midcycle forecast.
If we are correct with our midcycle forecast and pipeline forecast, we expect oil sands producers to turn their attention to growth. We expect solvent-assisted steam-assisted gravity drainage methods to fuel oil sands production growth. With companies using this technology, we believe break-evens for the best in situ projects can fall to $45/bbl WTI by the end of the decade versus current levels of $50-$65/bbl WTI for traditional SAGD operations. Accordingly, we expect SA SAGD break-evens to be generally commensurate with marginal U.S. shale break-evens ($55/bbl WTI).
We expect oil sands producers to add almost 800 mbbl/d of incremental production or 1.1 mmbbl/d of incremental supply, which accounts for the addition of diluent as blending agents so that the bitumen can flow on pipelines, over the next decade. Most of the new growth will come after 2025, as much of the growth before then involves ramping up current oil sands projects after new pipelines are built and mandatory production curtailments are lifted along with finishing projects that have already incurred significant capital expenditures.
…But in the Short Run, Oil Sands Firms Are in Survival Mode The crash in oil prices has weakened the balance sheets of the oil sands producers, and leverage ratios are likely to deteriorate further over the next couple of quarters as 12 months of low oil prices are factored into leverage calculations. However, the major producers took swift actions to trim the fat and reduce their cost structures. Cumulatively, the five major oil sands operators slashed 2020 capital spending by CAD 4 billion, or 30% of their original budgets. Most of the capital cuts were related to future capacity growth or technology advancements, leaving mostly sustainable capital spending.
With oil prices depressed, oil sands producers have secured liquidity in case of another price drop. The health of the balance sheets among oil producers is generally a point of contention with investors. But after examining the balance sheets of the five major oil sands producers under coverage, we think that liquidity over the next two years should not be a concern (even at strip prices, which are 20%-30% lower than our long-term forecast of $55/bbl). In fact, with the exception of MEG Energy, we don’t expect any further revolver drawdowns in this time window, because low maintenance break-evens will enable most companies to keep generating substantial free cash flows despite weak commodity prices.
What is more comforting to investors is that the debt covenants on the credit facilities provide ample breathing room. Bank lenders require a debt/capitalization covenant that must not to exceed 65% in order for the credit facilities to remain active for Canadian Natural, Suncor, and Cenovus Energy. Even with depressed oil prices, we don’t expect any of these companies to be in danger of approaching the 65% threshold. Imperial is in a unique position as its revolving credit facility is with its parent company, ExxonMobil, and it’s not subject to any covenants.
MEG’s revolver is covenant-free for the first CAD 400 million of drawn capacity but requires drawn capacity less cash/EBITDA not to exceed 3.5 times for the revolver to remain active when the company exceeds the CAD 400 million threshold. At current strip prices, we don’t expect MEG to draw more than CAD 250 million of its available capacity over the next two years, maintaining its covenant-free status while oil prices remain depressed.
Balance Sheets Are Poised to Improve Oil prices have more than doubled from their April lows, and we anticipate further recovery from here. Industrywide investment has fallen to an unsustainable level. If demand recovers as we expect, then oil producers, particularly the swing producers in our framework (OPEC and U.S. shale companies), must ramp activity levels to prevent the current glut from becoming a shortage. But the current price offers little incentive for these producers to go back to growth mode. Our WTI midcycle forecast of $55/bbl reflects the long-term average price needed to encourage the right level of future supply growth (not too much, not too little). The increase will benefit oil sands producers as well.
Improving prices and steep capital cuts will help ensure that oil sands producers can generate free cash flow in the next few years, and this surplus can be deployed to strengthen balance sheets. The combined impact of lower debt and higher earnings will quickly improve leverage ratios. Improving financial health will enable these companies to turn their attention to long-term growth when additional infrastructure is available, supporting stable pricing discounts and higher margins.
While oil prices have rebounded, it’s plausible that a second wave of COVID-19 outbreaks could further depress oil prices. Accordingly, we evaluated the balance sheets of each company in our oil sands coverage to determine the impact of lower prices through 2022. Our scenarios include $40/bbl WTI, $35/bbl WTI, and $30/bbl WTI. All of the companies we cover except for MEG Energy look to be in the clear, with enough liquidity to survive each scenario, and aren’t in danger of tripping debt covenants. MEG looks to have enough liquidity, but it’s likely that it would trip its debt covenants even if oil remained at $40/bbl for the next 10 quarters.
Risk-Adjusted Valuations A portion of our fair value estimates and investment theses depends on pipeline expansions. While the Trans Mountain Expansion and Line 3 are progressing and look to be built, the Keystone XL faces more uncertainty. The fate of the pipeline may hinge on the U.S. presidential election in November. If Joe Biden is elected, it is likely that the presidential permit will be pulled and the project shelved indefinitely. Without the pipeline, we would still expect differentials to stabilize to $18/bbl by 2022 with Line 3 and TMX providing additional market access. However, as supply ramps up, we would expect the differential to widen to $20/bbl by the end of the next decade, as the new pipes will be operating at full capacity. Accordingly, we expect lower price realizations for the marginal production that is sold in Alberta.
At this point, it is too early to tell which presidential candidate will win the election. As such, it is our view that the Keystone XL has an equal chance of being built or shelved for future administrations. As a result of the uncertainty surrounding the fate of the KXL, we are adjusting our estimates of oil sands producers’ fair values to include a 50% probability that the KXL will be built and a 50% probability that it will not be. Our previous valuations included a likelihood of 100% that the KXL would be built.
/cloudfront-us-east-1.images.arcpublishing.com/morningstar/I53I52PGOBAHLOFRMZXFRK5HDA.jpg)
/cloudfront-us-east-1.images.arcpublishing.com/morningstar/ZC6ZGSUHJVG4TN3DQFP6S7VEEY.jpg)
/cloudfront-us-east-1.images.arcpublishing.com/morningstar/QK4UAVKQMJACFGURDC5APNEA3U.jpg)
:quality(80)/s3.amazonaws.com/arc-authors/morningstar/767bcaab-ca87-4ef4-95f9-7d05d83708bc.jpg)