
Millennial Households Are Down but Not Out
Falling unemployment and rising wages are poised to stimulate household formation among younger adults.
/s3.amazonaws.com/arc-authors/morningstar/1d297fbb-3ca6-4b00-8c51-21e8e65e343e.jpg)

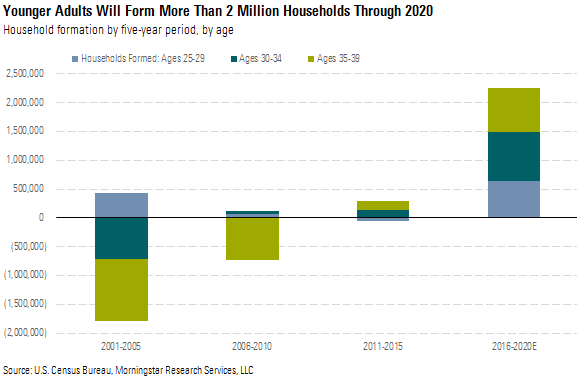
Younger adults were hit harder by the global financial crisis than any other age group, and their circumstances have been slowest to improve. Household formation among younger adults has been correspondingly weak postcrisis and explains much of the slow pace of the housing recovery. We estimate as many as 2 million households were "postponed" among the 25-39 age group since 2006.
Recently, conditions have begun to improve for younger adults, setting the stage for stronger housing activity in the years to come. Labor markets have tightened since early 2015, catalyzing a significant and long-awaited rebound in inflation-adjusted wages for younger adults. With unemployment remarkably low, underemployed young workers are finding better job opportunities. Household formation among younger adults should accelerate, with a lag, as balance sheets are rebuilt. Rising mortgage rates are unlikely to prove an unsurmountable barrier to homeownership, nor do we see any evidence that millennials are meaningfully less inclined to own than prior generations. Meanwhile, new housing supply is changing to meet nascent millennial demand, as homebuilders’ mix shifts to affordable starter homes. We expect 2.25 million new households to be formed by those aged 25-39 through 2020, based on these conditions.
The Bulk of New Households Are Formed by Younger Adults Younger adults--those aged 25-34--were hit hardest by the financial crisis. The subsequent recovery, while weaker than most Americans would have hoped, was especially disappointing for younger adults. Located at the fringe of the labor market, this group has suffered through roughly a decade of higher-than-median unemployment, falling real wages, weaker balance sheets, and a rising dependence on student debt.
The postcrisis struggles of younger adults help explain why U.S. housing activity has been well below historical norms. Postcrisis household formation among 25- to 34-year-olds has been far lower than what might have been expected based on historical norms.
Housing demand growth depends on younger adults. Most new households are formed when younger adults move out of their parents’ homes to get jobs, get married, and have kids. Comparably few are created past age 39. For every 100 adults aged 16-25, there are 16 households. That share jumps to 43% among 25- to 29-year-olds, 48% among 30- to 34-year-olds, and 50% among 35- to 39-year-olds. Beyond that point, gains are far more muted until spousal mortality increases headship rates among those 65 and older.
Younger Adults Were Hit Hardest by the Global Financial Crisis Falling headship and marriage deferrals were a consequence of a recession that hit younger adults especially hard. Labor markets are often fastest to dispose of young, relatively unskilled labor during the onset of recessions. National average unemployment rose 7 percentage points during the crisis. But over the same period, unemployment increased 8 percentage points among adults 25-29 and 9.5 percentage points among those 20-24. Assuming the unemployed are less likely to head a household, each percentage point can represent as many as 250,000 deferred households. Younger adults endured not only a greater rise in unemployment, but a slower recovery. Only by 2015 did unemployment among younger adults return to the long-term average.
Not only have younger adults been jobless longer than the median job-searching American, but the financial crisis has also severely weighed on wage growth. While Americans as a whole haven’t enjoyed a tremendous amount of real wage growth over the past 16 years, they’re still roughly 5% better off than they were at the turn of the century. The same can’t be said of younger adults. Those aged 20-24 are earning 1% less than they did in 2000. The 25-34 age group is earning 2% less.
In Pursuit of Better Job Prospects, Millennials Turned to Higher Education As employment and wage prospects weakened, younger adults turned to higher education as the solution. Between 1990 and 2014, enrollment in associate's and bachelor's degree programs grew substantially, absorbing nearly 70% of recent high school graduates. We don't expect this trend to reverse in the coming decades. As automation continues to consume jobs that feature highly repetitive tasks, we expect new jobs to require higher levels of education tailored to more dynamic physical or mental tasks.
Rising demand for a more educated labor force weighs on household formation by delaying life decisions such as marriage or childbirth. In addition, the rising cost and required debt levels of higher education could weigh on household formation beyond graduation. Particularly among millennials graduating into one of the worst labor markets in recent history, periods of loan delinquency could damage credit scores for years, while higher debt-service levels weigh on the ability to make a security deposit or down payment without first living with parents.
To purchase a house, younger adults need to save for a down payment. We think two headwinds reduce the amount of income that younger adults can save: student loan balances and increased rent as a percentage of income. Average student debt levels have increased around 70% from around $13,000 in 2004 to just under $22,000 in 2015 for borrowers under 30. The increase has slowed since 2012; the average debt balance has grown only 2.4% from 2012 to 2015. The National Association of Realtors estimated in 2016 that existing debt delayed a millennial’s home purchase by three years.
Student loans also explain part of the reason that a greater percentage of millennials live with their parents. The percentage of adult children living with their parents moves in sync with the percentage of 25- to 29-year-olds with at least a bachelor’s degree. This suggests that younger millennials are choosing to remain at home while they establish careers after finishing school, which we think is primarily driven by rising student debt levels.
The second factor we see as a headwind for down payment savings is the cost of rent as a percentage of income. While annual median rents have increased nearly 60% to $11,500 in 2015 from $7,200 in 2000, rent as a percentage of younger adults’ median income (also in nominal terms) has increased from 23% in 2000 to 33% in 2015. We believe the increase in rent as a percentage of income has caused a reduction in younger adults’ saving rates, which will extend the length of time it takes for younger adults to save for a down payment.
Tight Labor Markets Will Put Millennials Back on Track as Wage Growth Accelerates While the past decade was catastrophic for younger adult new home demand, this generation's economic conditions are now improving, suggesting we're right around the bend from a substantial rebound in demand for new residential construction. Wage growth and tight labor markets are poised to sustain improvements in earnings and debt repayment, giving younger adults still at home the opportunity to move out.
Since 2015, we’ve seen signs that financial conditions are improving for a larger swath of Americans. As personal finances improve to levels seen before the recession, we expect much of the collapse in headship rates to reverse and for household formation to accelerate.
Since 2011, just under half of 18- to 34-year-old adults are living with an extra adult. Living with an extra adult is defined as living with another adult who is not a spouse or unmarried partner, which typically means a person is either living at a parent’s house or with a roommate. While this number is still higher than prerecession levels, 2015 saw a 1% decline from 2014, which could represent the beginning of household formation growth among millennials. As their economic circumstances improve, we think millennials are more likely to form their own households.
First and foremost, we’ve seen considerably less slack in the labor markets. Nonfarm openings is one of the broadest ways to gauge how demand for labor stacks up against the available talent pool. Over the past two years, openings have remained at levels not seen since the turn of the century. Importantly, this isn’t being driven by any one industry but is broad-based. This points to not only growing demand for labor, but a healthier labor market that better resembles prerecession periods.
There’s evidence that tighter labor markets have indeed pushed wages higher. National wage growth is now approaching 4% annually, or just over 2% after adjusting for inflation. Inflation-adjusted wage growth has risen meaningfully across most industries in recent years. Given that opening rates have remained elevated for a couple of years, we think this signals room for continued wage growth until enough of the population re-enters the labor force.
We see additional evidence of tight labor markets in median and job switcher wage growth. Job switchers are employees who change jobs due to firing, being laid off, or taking advantage of a better opportunity. Switchers typically see less wage growth than median earners in weakening labor markets, as most were laid off from their former jobs. However, switchers are better off in improving labor markets, as a rising share are those moving into better job opportunities.
While the difference in wage gains between job switchers and median wage earners can be volatile, it has begun to widen since roughly 2015, favoring those switching jobs; this implies that labor markets are tightening. As companies compete for talent, we believe wage growth should remain solid over the coming years.
Additional evidence leads us to believe this financial improvement is broad-based. Detailed personal income data have allowed us to construct a rough proxy for underemployment, which we define as those earning less than $20,000 a year, including those with no earnings. Since 2011, there has been a gradual decline in the underemployed among 25- to 34-year-olds, with the most notable improvement taking place in 2015.
Meanwhile, rising wages have begun to pull younger adults back into the labor force. The fact that rising labor force participation now coexists with the best inflation-adjusted wage growth we’ve seen in roughly a decade is a testament to the underlying demand for labor. Not only will this stand to benefit those already working, but a growing share of this age group will have money to both spend and save, laying the foundation for additional household formation.
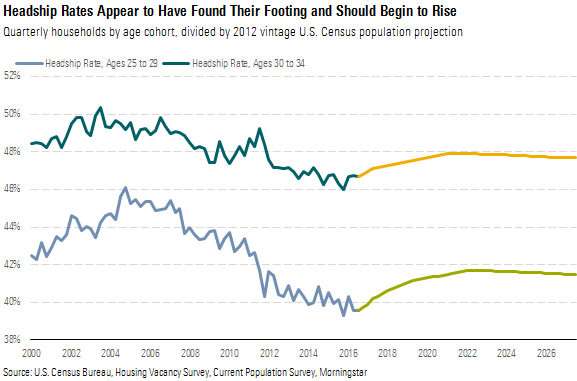
Strengthening labor markets are beginning to influence household formation. For both the 25-29 and 30-34 age groups, improving economic outcomes appear to have halted the decline in headship rates. As labor force participation continues to rise and wages rise further, debt burdens will become more manageable for younger adults looking to start families or move into their own apartment for the first time.
Over the next five years, we expect headship rates among younger adults to rebound. With labor markets improving, we expect financial constraints to ease, allowing millennials to leave the nest. For those aged 25-29, we believe headship rates will rise roughly 2.0%, creating roughly 530,000 new households. Even more households will be born from adults aged 30-34, where just over a 0.5% projected rise in headship rates should yield nearly 1.4 million as the massive millennial generation makes its way into its 30s.
Limited Evidence of Changing Housing Preferences Among Younger Adults While our research suggests financial constraints have delayed household formation among younger adults, a popular idea about millennials is that their preferences are different from previous generations when it comes to household formation and homeownership. The idea is that millennials, unlike previous generations, don't want to own a home or live in the suburbs.
To gauge millennial home ownership preferences, we looked for multiple survey sources, with the goal to eliminate any biases than can be present in a single survey. We found five surveys from four sources. On average, the surveys suggest 78% of millennials either want to own a home or already do. Notably, this is a higher percentage than some of the ownership rates of previous generations.
While we don’t have similar survey data for previous generations, we have actual homeownership data, which is a good indicator of preferences as it reflects actual purchase decisions. Millennial survey results show that 78% desire to own a home, which is higher than late baby boomer and Generation X actual homeownership rates of 69% and 59%, respectively.
As generations age, homeownership rates increase. Although millennial homeownership rates currently lag those of Gen X and late boomers when each was under 35, there is still time to catch up. When the late boomers were under 35, their homeownership rate lagged the under-35 rate of Gen X, yet when each generation was in the 35-44 cohort, the late boomers had a greater homeownership rate than that of Gen X.
In addition to the desire for homeownership, the type of home preferred--whether a detached single-family house or a multifamily unit such as a condominium--affects a variety of the companies we cover. Since 1970, around 72% of all new units built have been single-family homes. Survey results indicate that millennials prefer to live in a single-family home. A survey from the Urban Land Institute showed that 71% of millennials want to live in single-family homes, citing their desire for more space and more privacy.
Home Affordability Overstated for Most Younger Adults Homeownership rates tanked in the wake of the financial crisis, especially among younger adults, who were hit hardest. Overall ownership fell from 67.4% to 63.4% between 2000 and 2016. Among those aged 25 to 34, it dropped from 47.1% to 38.6% and remains well below historical norms despite nominally attractive home affordability.
Over the coming quarters, we think improving labor market outcomes and repaired balance sheets will be complemented by improving affordability of new housing supply. As homebuilders increasingly cater to demand for starter homes, we expect median pricing to moderate along with square footage.
The ratio of median mortgage payment to median gross income is a common (and often useful) proxy for home affordability. The median home looks to be quite affordable relative to history, thanks to persistently low interest rates over the past several years. Today, mortgage payments make up roughly 22% of household gross income, down substantially from the average since 1989 of 27%.
Yet the standard proxy has many shortcomings that make it a misleading indicator of affordability in today’s environment. It can overstate affordability for buyers with below-median income, a category most younger adults fall into. Nor does this proxy tell us anything about a buyer’s ability to obtain financing. Just because mortgage payments are relatively affordable does not mean banks are any more willing to lend to those with lower-quality credit ratings. Again, this is a category many younger adults fall into. We believe roughly half of younger adults have credit scores below 640, and less than 10% of all mortgages are being originated to customers with such low credit scores.
Homebuilders Are Once Again Building Entry-Level Homes Between 2010 and 2015, persistent demand from wealthy and more creditworthy families drove the size of new homes to rise roughly 15%. New home prices (and therefore required down payments) have grown commensurately (up 22% in real terms), leaving these properties out of reach for those seeking a starter home.
With the labor market firming for younger adults, we’re seeing signs of homebuilders pivoting toward smaller, entry-level homes, where demand is strengthening. After four years of sequential declines in the number of entry-level homebuilders, 2015 marked a turning point. For example, D.R. Horton’s DHI Express Homes, which targets first-time buyers, grew to 28% of total homes closed in the first quarter of 2017, up from 4% in 2014. D.R. Horton is hardly the only homebuilder to set its sights on first-time buyers. We believe the growing availability of smaller, more affordable homes is already affecting the housing market. Indeed, the median size of new single-family homes built in 2016 declined for the first time since the recession.
Amid rising demand for starter homes, we think builders have financial incentives to focus on smaller homes. Few custom options and identical floor plans allow starter homes to be completed and sold rapidly. They also require fewer laborers and smaller land parcels. Taken together, these factors stand to boost return on invested capital even if gross margins per unit are smaller than those on larger homes.
We think land availability concerns remain overblown. Although the May 2016 NAHB/Wells Fargo Housing Market Index indicated that 64% of homebuilders face low or very low developed lot supply, much of the constraint stems from only the most desirable land parcels. Land constraints, if anything, favor building smaller homes, given that entry-level homes are traditionally built in bulk on cheaper, more distant land tracts. Survey data suggest that millennials are more amenable to suburban living than many believe.
We also see little evidence that public homebuilders are struggling to increase land holdings. Between 2011 and 2016, homebuilders expanded their lot counts an average of 8% a year. Though builders are paying more per lot, rising invested capital should encourage faster inventory turnover through the production of smaller, more affordable homes.
Improving Balance Sheets, Increasing Supply Support Homeownership As the labor market strengthens, the financials of younger Americans should converge on those of a typical American household. Younger Americans can utilize greater earnings power to reduce debt and purchase homes for this first time. Rock-bottom interest rates have left mortgage payments well below the historical average of 27% of household gross income, leaving breathing room for interest rate or home price increases.
Over the coming years, we expect gross incomes to rise amid tighter labor market conditions. As homebuilders shift to smaller, cheaper homes, we expect downward pressure on median home pricing. We think this should make affordability better still in the near term.
Overall, we think homeownership prospects are bright for millennials. A combination of sustainable wage growth, increased availability of entry-level homes, and the desire to own is poised to propel household formation higher over the coming decade.
Please see “We’re Bullish on a Housing Recovery,” published April 12, for details on our long-term housing forecast and investment recommendations on housing-related stocks.
/cloudfront-us-east-1.images.arcpublishing.com/morningstar/ZPLVG6CJDRCOTOCETIKVMINBWU.png)
/cloudfront-us-east-1.images.arcpublishing.com/morningstar/JYGMFDSZ6ZCJJKNOD2CMBUGOOM.jpg)
/cloudfront-us-east-1.images.arcpublishing.com/morningstar/XR35K26XUZBZXGB5QD24BU5W4A.jpg)
:quality(80)/s3.amazonaws.com/arc-authors/morningstar/1d297fbb-3ca6-4b00-8c51-21e8e65e343e.jpg)