
Consumer Sentiment Is Low—That’s a Good Sign for Stocks
When the public is gloomy, equities usually thrive.
/s3.amazonaws.com/arc-authors/morningstar/1aafbfcc-e9cb-40cc-afaa-43cada43a932.jpg)

A Contrarian Indicator
Many adages are patently false. For example, tennis fans sometimes cluck about the peril of winning a set by the highest possible score of 6-0. Fly too high, suffer Icarus’ fate. To assess that conceit’s accuracy, researchers at Tennis Channel searched for all the matches that the world’s number-one women’s player, Iga Światek, has ever lost during her professional career after posting such a score. None.
Nor, despite the lament among soccer fans, is a 2-0 lead the worst lead. It is demonstrably better than 1-0, although obviously worse than 3-0.
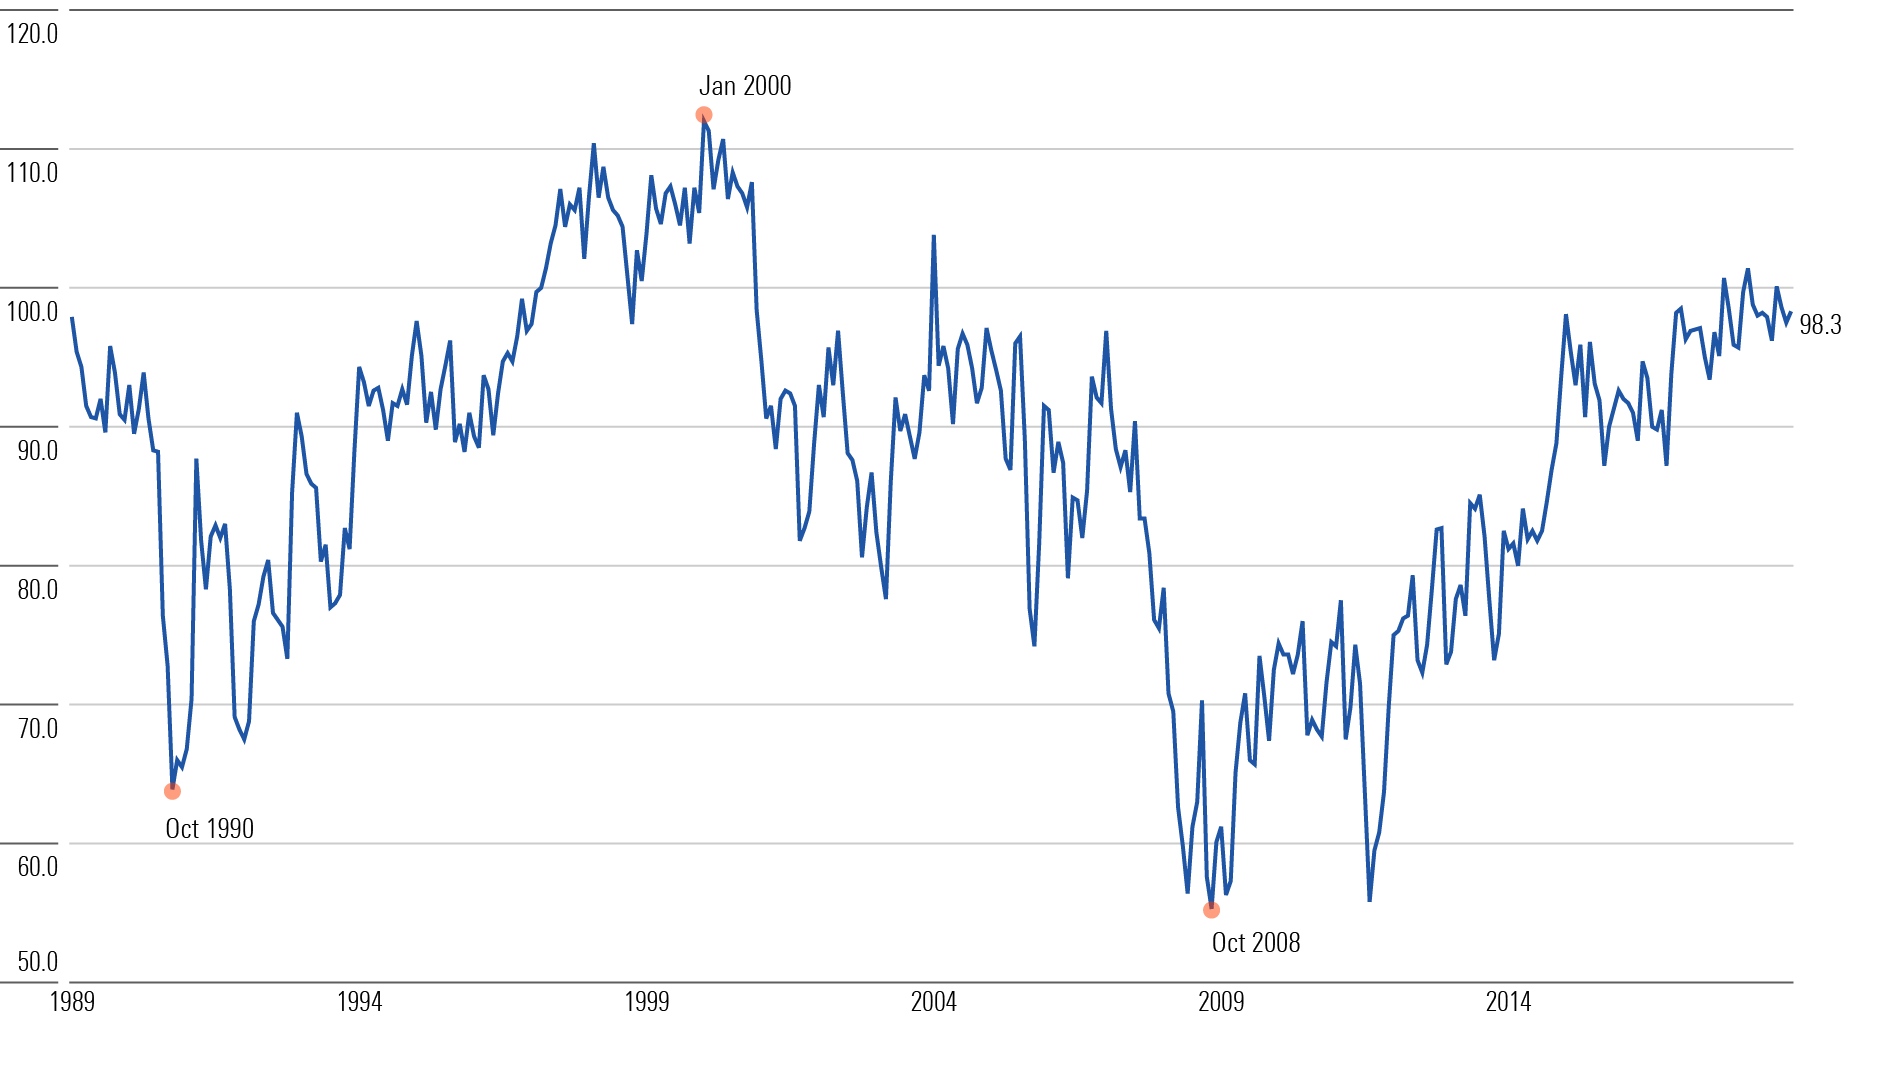
That said, the common claim that consumer confidence is inversely related to stock performance is correct. The chart below shows the monthly output for the University of Michigan’s Index of Consumer Sentiment, which addresses the public’s confidence in their financial futures, from the date of President George Herbert Walker Bush’s inauguration through the next three decades, until December 2018.
Consumer Sentiment: 1989-2018
The Track Record
Consumer sentiment plummeted during President Bush’s first two years, reaching its low point in October 1990. At that point, U.S. equities were down 15% on the year. Not entirely coincidentally, the very month that sentiment bottomed was also stocks’ nadir. In November, equities promptly resumed what would become the longest bull market in American history.
Consumer sentiment followed suit, peaking as the new millennium commenced. Then the technology-stock crash began. Consumer sentiment jaggedly declined until October 2008. Technically, that date did not signal the stock market’s floor—equity prices were slightly lower in March 2009—but it was mighty close. Suffice it to say that buying U.S. equities would have been an excellent idea.
Broadly speaking, the 30-year pattern matched what researchers had expected when entering the period. (By the late 1980s, the belief that consumer sentiment was a contrarian indicator had become widespread.) When people are deeply unhappy, stocks are likely to thrive, because the economic damage that bothers them has already occurred. A contented populace, on the other hand, is the investment equivalent of red sky at morning. Equity shareholders, take warning.
Why So Low?
With that precept in mind, let’s see how consumer sentiment has since behaved. The next chart repeats its predecessor while adding the post-2018 period.
Including the Recent Past
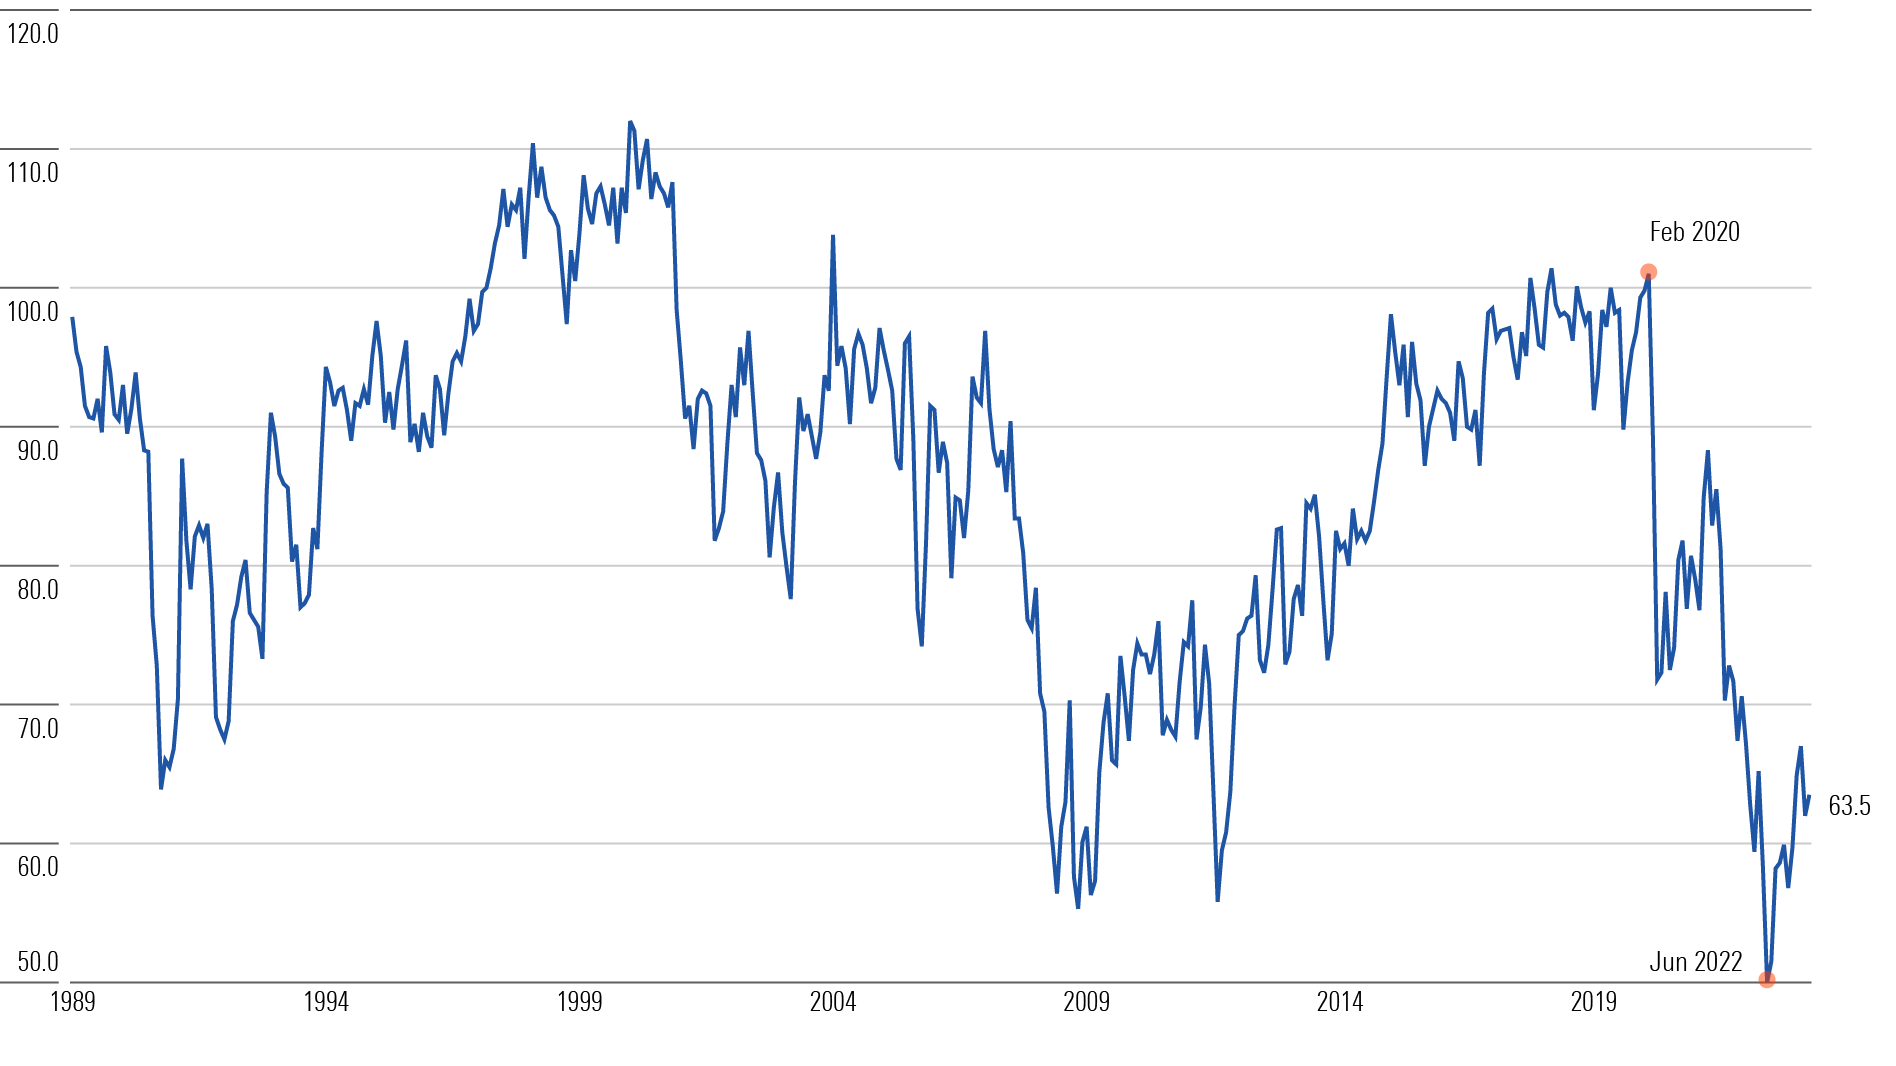
The relationship between consumer sentiment and equity prices has continued. After maintaining its level for another year, sentiment crashed upon the advent of the novel coronavirus, staged a fleeting recovery, and then plunged again in summer 2021 when inflation arrived in earnest. Consumer sentiment now hovers near its 35-year low.
Indeed, sentiment appears to have overshot the economic news. Inflation has been painfully high, of course. But job growth has been strong, and corporate bankruptcies few. Anecdotally, the public seems to be grumpier than the situation would warrant. I tested that notion by calculating the “Misery Index,” which measures the extent of economic suffering by summing 1) the unemployment rate and 2) the trailing 12-month change in the Consumer Price Index.
Misery Index
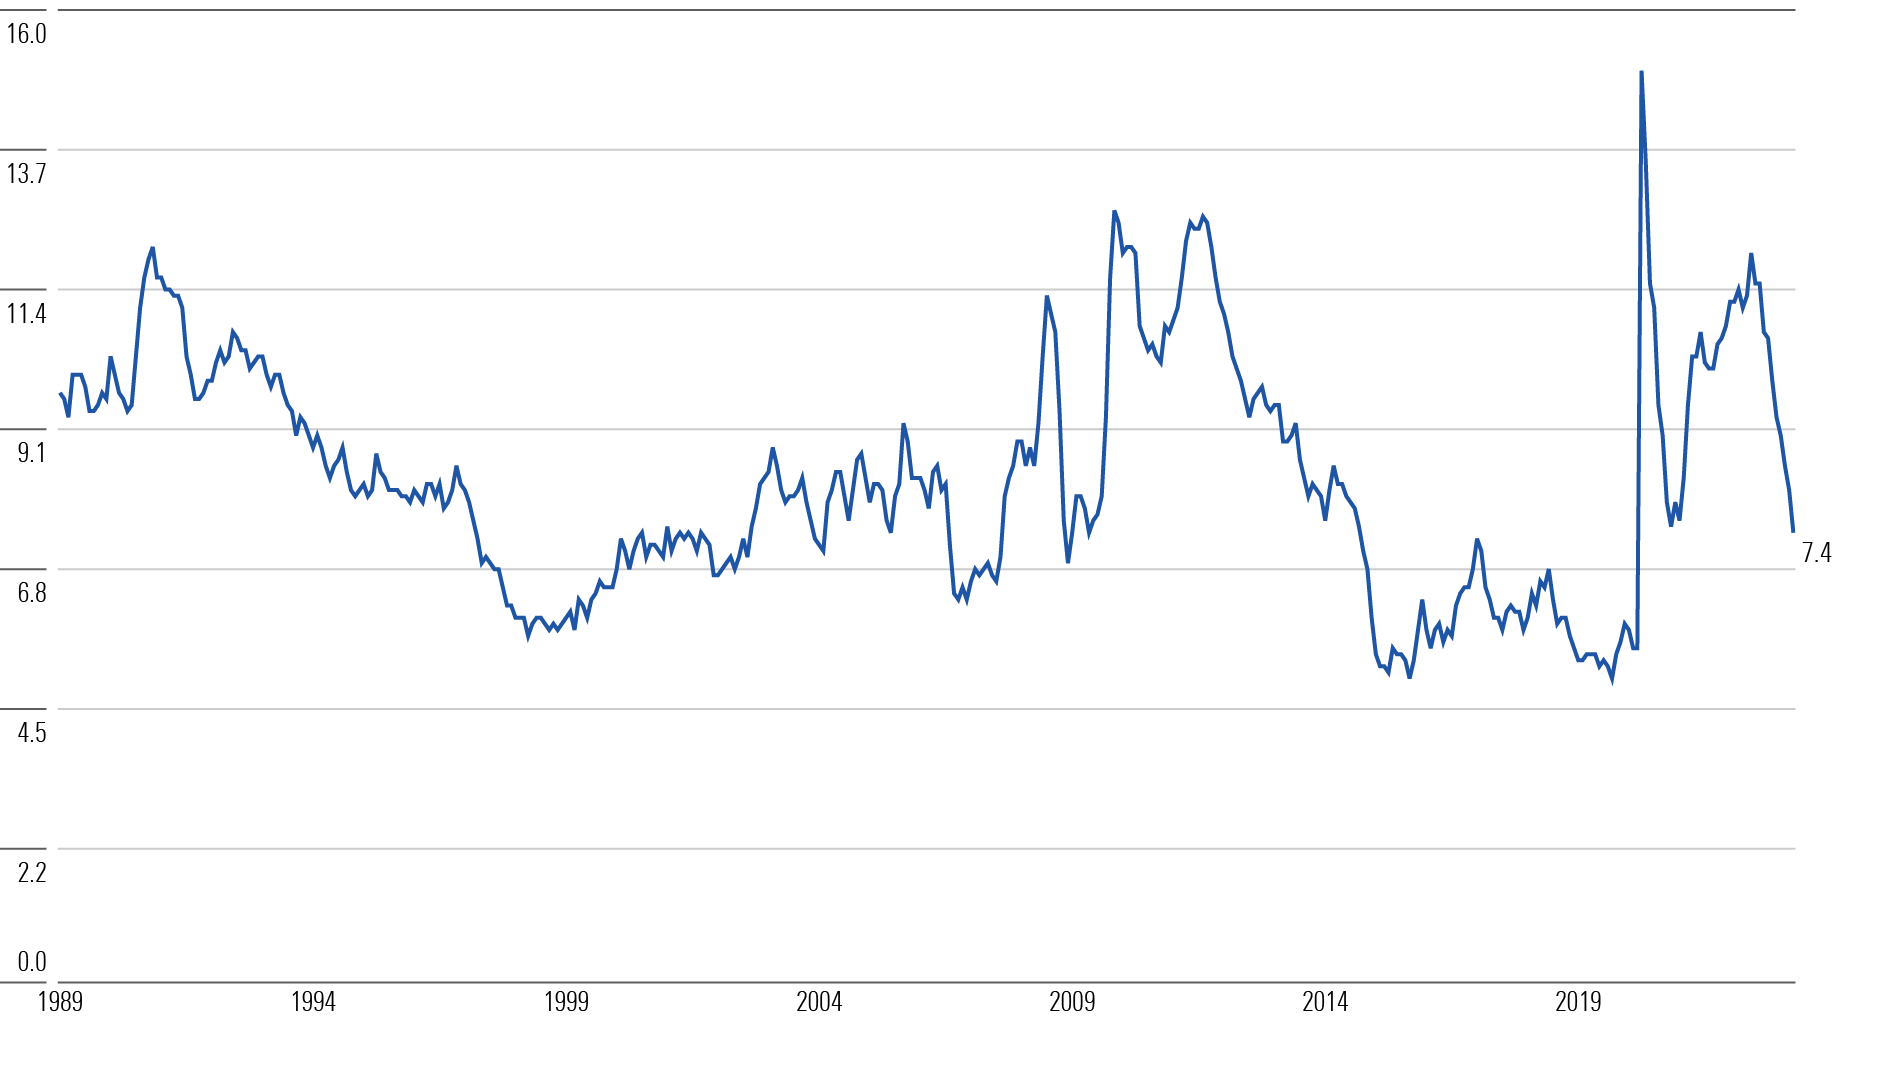
The brief but severe pandemic-driven recession sent the index to its highest level since the early 1980s. Then, as employment picked up, inflation surfaced. But over the past several months, the index has subsided, as price increases have moderated while employment remains robust. At 7.4%, its April 2023 total was below the post-1989 median of 8.1%. As judged by the Misery Index, consumer sentiment today is below what one would reasonably expect.
Down in the Dumps
That leads to another question: Have Americans become more pessimistic? The previous two exhibits suggest that consumer sentiment has declined over time, even as the economic news has been similar. The first third of the evaluated period brought the technology-stock crash, the second third the global financial crisis, and the final third pandemic/inflation shocks. Those once-per-decade woes seem akin. Yet the level of consumer sentiment has gradually declined.
I also put numbers to that proposition, by:
1) Calculating the median figures for the Consumer Sentiment Index and Misery Index from January 1989 through April 2023.
2) Rescaling the monthly index values, so that each index’s median = 100.
3) Summing the two rescaled monthly amounts, then subtracting 200.
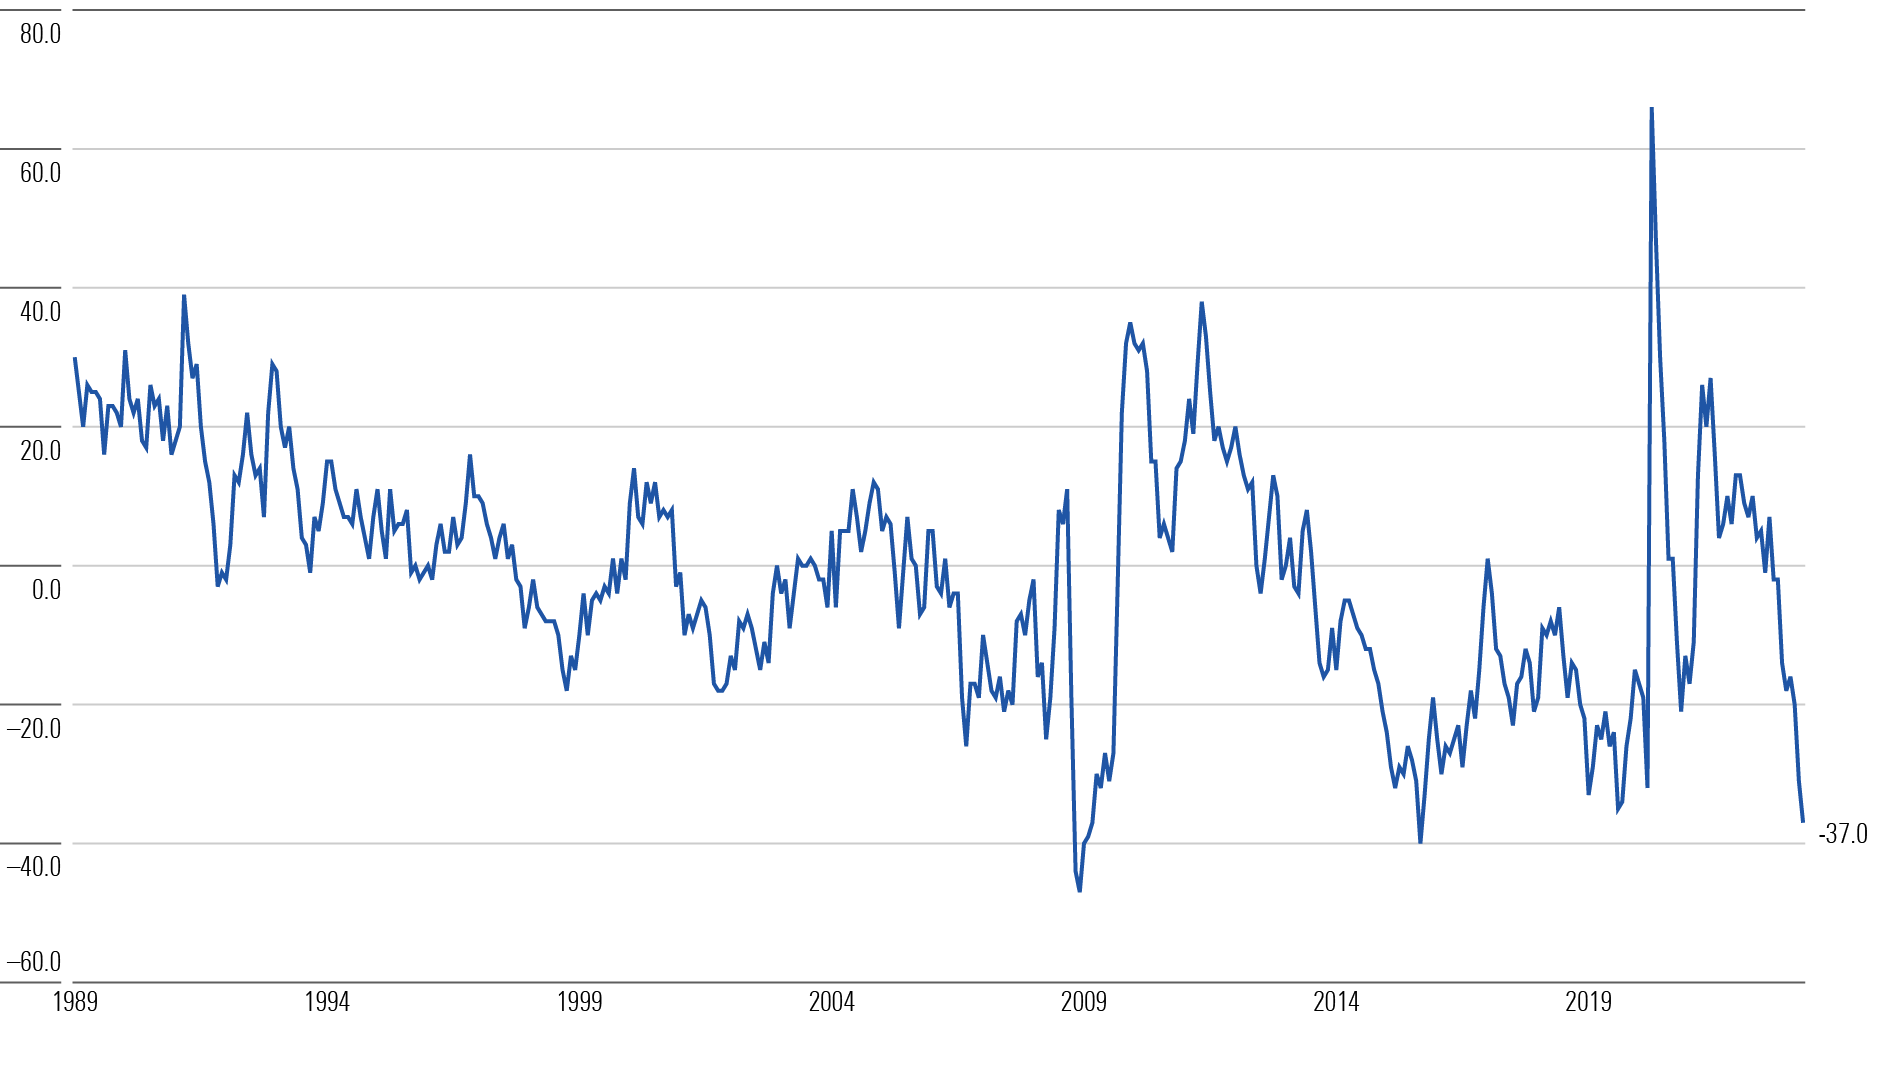
The result is the Adjusted Sentiment Index, a statistic of my invention.
An example will illustrate the point. In January 1989, the rescaled Misery Index was 120. The Misery Index was 20% above its median level. The public should therefore have been commensurately discouraged. However, that month’s Consumer Sentiment score was 10% above its median, at 110. The Adjusted Sentiment Index was thus 230 minus 200 = 30. The positive result indicates that people were relatively optimistic, given the prevailing economic conditions.
The Adjusted Sentiment Index for April 2023, in contrast, was a puny negative 37. Only during the global financial crisis has that figure ever been lower.
Public Discontent is Growing
The Silver Lining
The public’s unhappiness is difficult to comprehend. Two months ago, I discussed a similar finding from a University of Chicago National Opinion Research Center survey, in which 78% of respondents stated that they were not confident that their children’s financial lives would exceed their own. If that prediction proves correct, that would be a remarkable setback, as across the entire wealth spectrum every American generation has been wealthier than the one that preceded it.
This time, of course, could be different, but an argument of such improbability is worth considering only when advanced by a highly credible source. Yet as we have seen, the public’s financial judgment has been the direct opposite of “highly credible.” With their economic sentiment, the people have reliably and consistently been on the wrong side of future events.
Glum times are not much fun. If given the option, I would not choose that Americans be deeply pessimistic. There is, however, a silver lining for equity investors, in that such moods have typically presaged strong stock market gains.
The opinions expressed here are the author’s. Morningstar values diversity of thought and publishes a broad range of viewpoints.
The author or authors do not own shares in any securities mentioned in this article. Find out about Morningstar’s editorial policies.
/d10o6nnig0wrdw.cloudfront.net/05-09-2024/t_fab10267147f40fb93a1deb8a0b6553b_name_file_960x540_1600_v4_.jpg)
/cloudfront-us-east-1.images.arcpublishing.com/morningstar/E3DSJ6NJLFA5DOKMPQRAH5STMU.png)
/cloudfront-us-east-1.images.arcpublishing.com/morningstar/EGA35LGTJFBVTDK3OCMQCHW7XQ.png)
:quality(80)/s3.amazonaws.com/arc-authors/morningstar/1aafbfcc-e9cb-40cc-afaa-43cada43a932.jpg)