
Why Large-Blend Funds Should Outweigh Value Plus Growth Funds in a Portfolio
When it comes to style investing, the sum of the parts isn’t greater than the whole.
/s3.amazonaws.com/arc-authors/morningstar/360a595b-3706-41f3-862d-b9d4d069160e.jpg)

Large-blend funds have much to recommend them. They’re the easiest way to get broad exposure to the U.S. equity market. The category is home to some of the industry’s biggest funds, such as SPDR S&P 500 ETF Trust SPY and Vanguard Total Stock Market Index VTSMX. And Morningstar’s Role in Portfolio framework, which I rolled out earlier this year, considers large-blend funds suitable as core holdings, meaning that they could make up as much as 40% to 80% of an investor’s portfolio.
But there’s more than one way to build a portfolio; you could obtain similar market exposure by combining a large-value fund and a large-growth fund. However, there may not be a lot to be gained by doing so.
Reason #1: Better Market Coverage
Morningstar defines large-blend funds as those that are fairly representative of the overall U.S. stock market in size, growth rates, and price. Stocks in the top 70% of the capitalization of the U.S. equity market are defined as large-cap. The blend style is assigned to portfolios where neither growth nor value characteristics predominate, and these portfolios usually invest in a wide range of economic sectors.
The average large-blend fund offers pretty good exposure to a full spectrum of stocks, as shown below. While purists might prefer to stick with funds that only focus on truly large-cap stocks, having some exposure to small and midsize stocks isn’t a bad thing, either.
Large Blend Equity-Style Exposure
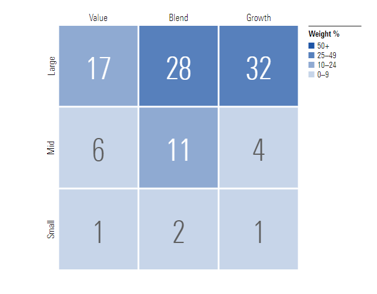
Large-value and large-growth funds, on the other hand, are generally more concentrated toward their respective corners of the Morningstar Style Box.
Reason #2: Similar Long-Term Performance
About a year ago, John Rekenthaler ran some numbers to test whether buying equal stakes in Vanguard Value Index VIVAX and Vanguard Growth Index VIGRX and periodically rebalancing would yield better results than buying Vanguard 500 Index VFIAX. The two-fund portfolio had an annualized return advantage ranging from 10 basis points to 28 basis points over rebalancing frequencies ranging from monthly to five years. There was no return difference for a 10-year rebalancing schedule.
One drawback of this analysis: the fund results only go back to November 1992. And the three funds aren’t exact analogues, since the Value and Growth funds now track segments of the CRSP Large Cap index rather than value and growth stocks carved out from the S&P 500.
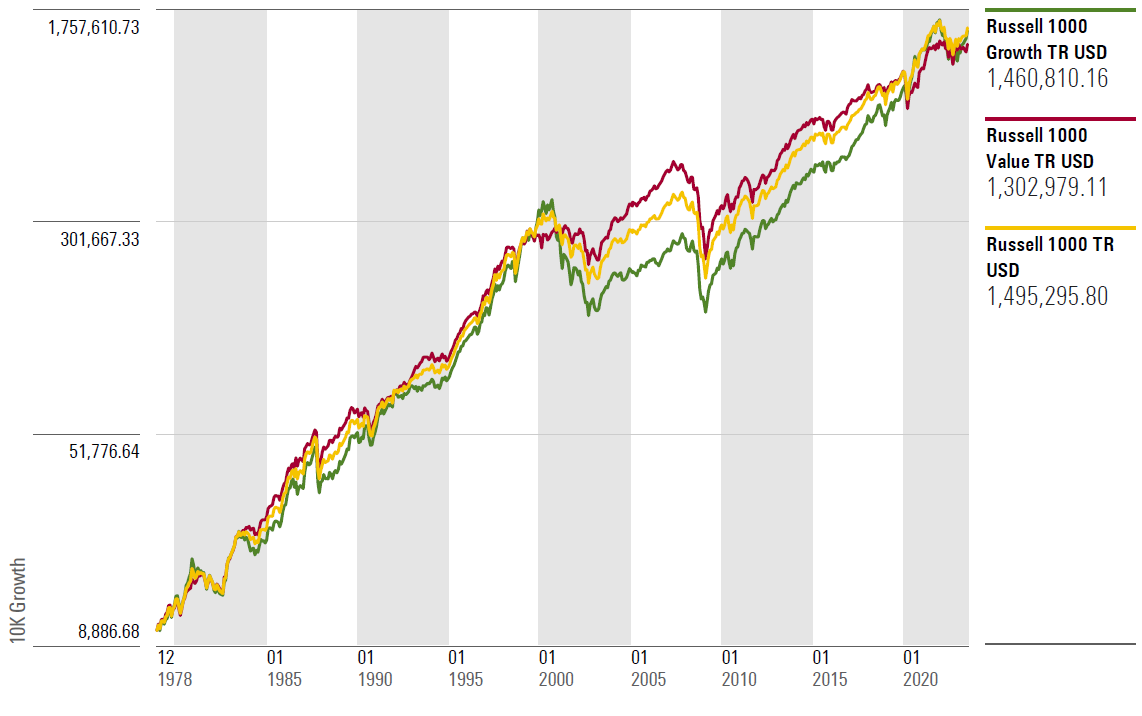
I decided to take a fresh look at this question using a trio of Russell 1000 indexes, which have performance histories dating back to 1979. The Russell 1000 Value Index carves out stocks with lower price/book ratios and lower projected growth rates, while the Growth Index consists of stocks with higher price/book ratios and better projected growth rates for revenue and earnings. The Russell 1000 Index combines the holdings of both indexes.
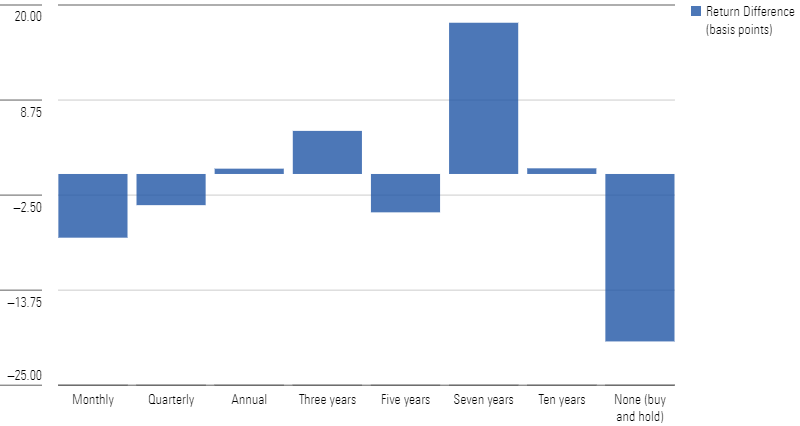
The results were underwhelming, to say the least. As shown in the table below, there was virtually no difference in performance for a two-index test portfolio relative to the large-blend benchmark over most rebalancing frequencies. Of all the tempos tested, the seven-year rebalancing schedule looks most promising. While an annualized performance edge of 18 basis points might elicit a response of “meh,” it could be worth the effort if you have a very long time horizon and are disciplined enough to stick to the schedule (and remember to rebalance). Over the past 44½ years, an initial investment of $10,000 split between value and growth and consistently rebalanced every seven years would have ended up with a portfolio value of about $1.6 million, or about $110,000 greater than $10,000 invested in the Russell 1000 Index.
Testing the Value Plus Growth Portfolio
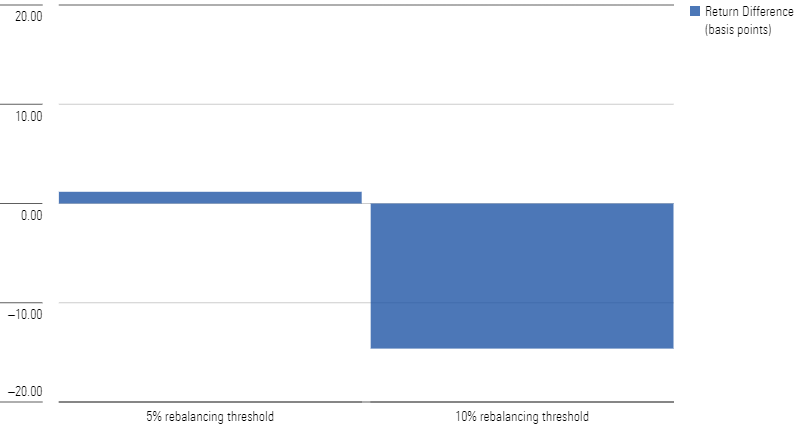
I also tested a threshold rebalancing strategy, which involved rebalancing the two-index portfolio whenever one of the components drifted more than 5 or 10 percentage points away from its initial weighting. Here, too, there’s not much to write home about. The 5% rebalancing strategy for the two-index portfolio came out ever so slightly ahead of the blend index over the full period, but the difference in returns was small. The 10% rebalancing strategy, on the other hand, led to slightly lower returns.
Testing the Value Plus Growth Portfolio: 5% and 10% Rebalancing Bands
And while value and growth have taken over market leadership over various periods (such as growth stocks over the period 2009-21 and value stocks in 2022), the results for the two styles weren’t dramatically different over the full period from 1979 through mid-2023. Despite academic research supporting a long-term performance advantage for value stocks, growth issues came out slightly ahead over the past 44-odd years in my study. But the difference was less than 30 basis points per year. While growth edged out value, both style indexes fell slightly behind the Russell 1000 over the full period.
Growth of $10,000
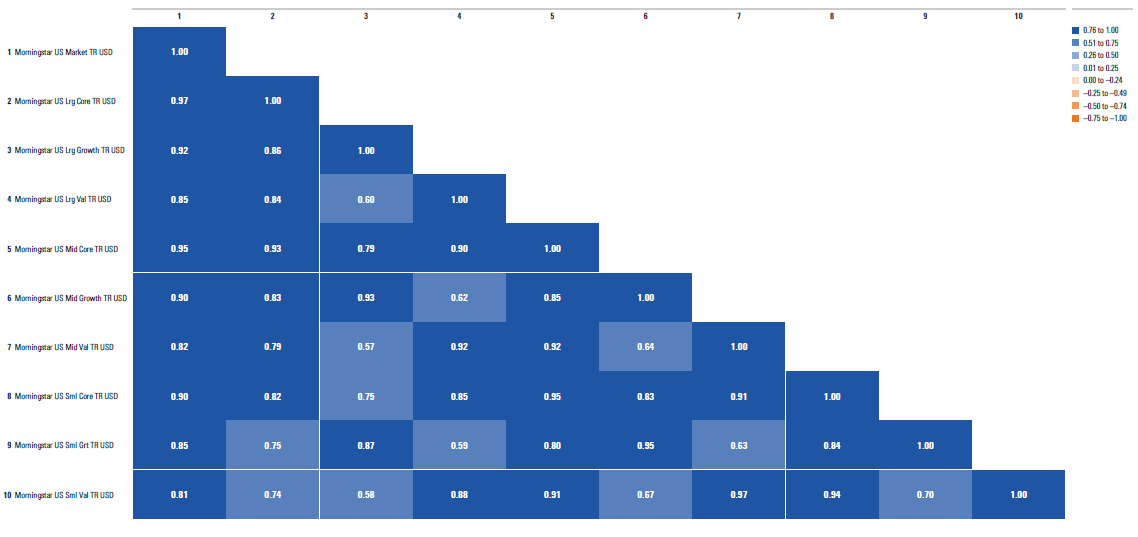
Reason #3: Minimal Diversification Benefits
We took a deep dive into correlation coefficients for various asset classes in our 2023 Diversification Landscape report. As shown in the table below, most investment styles have fairly high correlations with the overall market. Morningstar’s Large Growth and Large Value indexes had correlations of 0.92 and 0.89, respectively, with the Morningstar US Market Index. There might be some risk reduction benefit from diversifying into value and growth, but it’s pretty small. What’s more, combining value and growth into one portfolio would wipe out any potential diversification benefits.
Three-Year Correlation Matrix by Investment Style
When Large Value Funds and Large Growth Funds Are Worth Owning
However, style-specific funds can still play a useful role. If you own a stock or fund that you’re reluctant to sell, you might end up with a portfolio tilted toward either value or growth. For example, someone owning a large stake in Apple AAPL (such as yours truly), might end up with a portfolio tilted toward the Large Growth corner of the Morningstar Style Box. Investing in a value-oriented fund could help offset the portfolio’s growth bias.
An investor could also deploy a style-specific fund to take advantage of valuation discrepancies if growth stocks seem more attractively priced than value, or vice versa. As of May 31, large-value stocks covered by Morningstar’s equity analysts had an aggregate price/fair value ratio of 0.82, compared with 0.97 for large-growth issues. If our analysts’ fair value estimates are accurate, large-value stocks should generate higher returns as market prices converge to fair value. But as the rebalancing tests above suggest, reversion to the mean doesn’t always happen on a predictable schedule.
Conclusion
Style-based investing has gained favor since Eugene Fama and Kenneth French’s landmark research in 1992. The three-factor model they came up with (and Morningstar popularized with the Morningstar Style Box) goes a long way toward explaining investment performance and risk. But while it seems plausible that combining growth and value could lead to better results over time, that does not seem to be the case.
Correction: An exhibit was repeated in a previous version of this article. The third exhibit is now the correct image.
The author or authors own shares in one or more securities mentioned in this article. Find out about Morningstar’s editorial policies.
/cloudfront-us-east-1.images.arcpublishing.com/morningstar/MNPB4CP64NCNLA3MTELE3ISLRY.jpg)
/cloudfront-us-east-1.images.arcpublishing.com/morningstar/SIEYCNPDTNDRTJFNF6DJZ32HOI.png)
/cloudfront-us-east-1.images.arcpublishing.com/morningstar/ZHTKX3QAYCHPXKWRA6SEOUGCK4.png)
:quality(80)/s3.amazonaws.com/arc-authors/morningstar/360a595b-3706-41f3-862d-b9d4d069160e.jpg)