
Does It Pay to Diversify by Style?
Different styles all have high correlations with the overall market, but that doesn’t translate into identical returns.
/s3.amazonaws.com/arc-authors/morningstar/360a595b-3706-41f3-862d-b9d4d069160e.jpg)
U.S. equity exposure can be broadly segmented by market capitalization (small, mid, and large) and style (value versus growth), as represented by the Morningstar Style Box.
Correlations within U.S. equity groups tend to be fairly high, although small-cap stocks tend to have the lowest correlations with the broad market. In our recently published 2023 Diversification Landscape Report, however, we found there can be significant benefits to diversifying a portfolio by investment style.
Recent Performance Trends
The nine boxes included in the style box go from the relative extremes of large-cap growth to small-cap value. Correlations among U.S. equity groups tend to be high, although small-cap and value stocks tend to be somewhat less tightly linked with the overall market.
The divergence between these two portions of the style box shows the long-running gap in returns between value and growth stocks on the one hand and large- and small-cap stocks on the other. For many years, the dominant story line was simple: The larger and growthier the style, the better. That narrative held true nearly every year starting in 2009, as the market recovered in the wake of the 2008 bear market.
Some of these long-running performance trends have shown signs of reversal, though. Amid surging inflation, the Federal Reserve repeatedly hiked interest rates during 2022, sending stocks into a bear market that continued throughout most of the year. The Morningstar US Market Index finished the year with a 19.4% decline. As higher interest rates prompted investors to mark down previously high-flying technology stocks and other growth-oriented issues, the Morningstar US Growth Index suffered a 36.4% loss. Value stocks, meanwhile, survived the year relatively unscathed. The Morningstar US Value Index finished the year just barely in the red, losing 0.7%.
This relatively resilient showing followed on the heels of a strong value rebound in 2021. Value stocks—particularly in sectors such as energy, financials, and real estate—benefited from the strong economic recovery after falling behind their growth counterparts in 2020 and previous years.
The large-versus-small narrative also shifted a bit during 2022. After dominating the market for several years running, the market’s biggest stocks were trading at steep valuations at the beginning of the year, giving them more room to fall as valuations dropped. As a result, the Morningstar US Large Cap Index fell behind the broader Morningstar US Market Index for the first time in six years.
Style box performance in 2022 also marked a dramatic shift from performance trends during the pandemic-driven bear market in 2020. As COVID-19 kicked off a fast and severe bear market in the first quarter of 2020, the Morningstar US Large Growth Index fared best in relative terms, dropping 30.9% during the downturn from Feb. 19 through March 23. This was about 17 percentage points better than the Morningstar US Small Value Index’s 47.7% drop over the same period. Large-growth stocks also bounced back much better than their value counterparts as the market recovered later in the year.
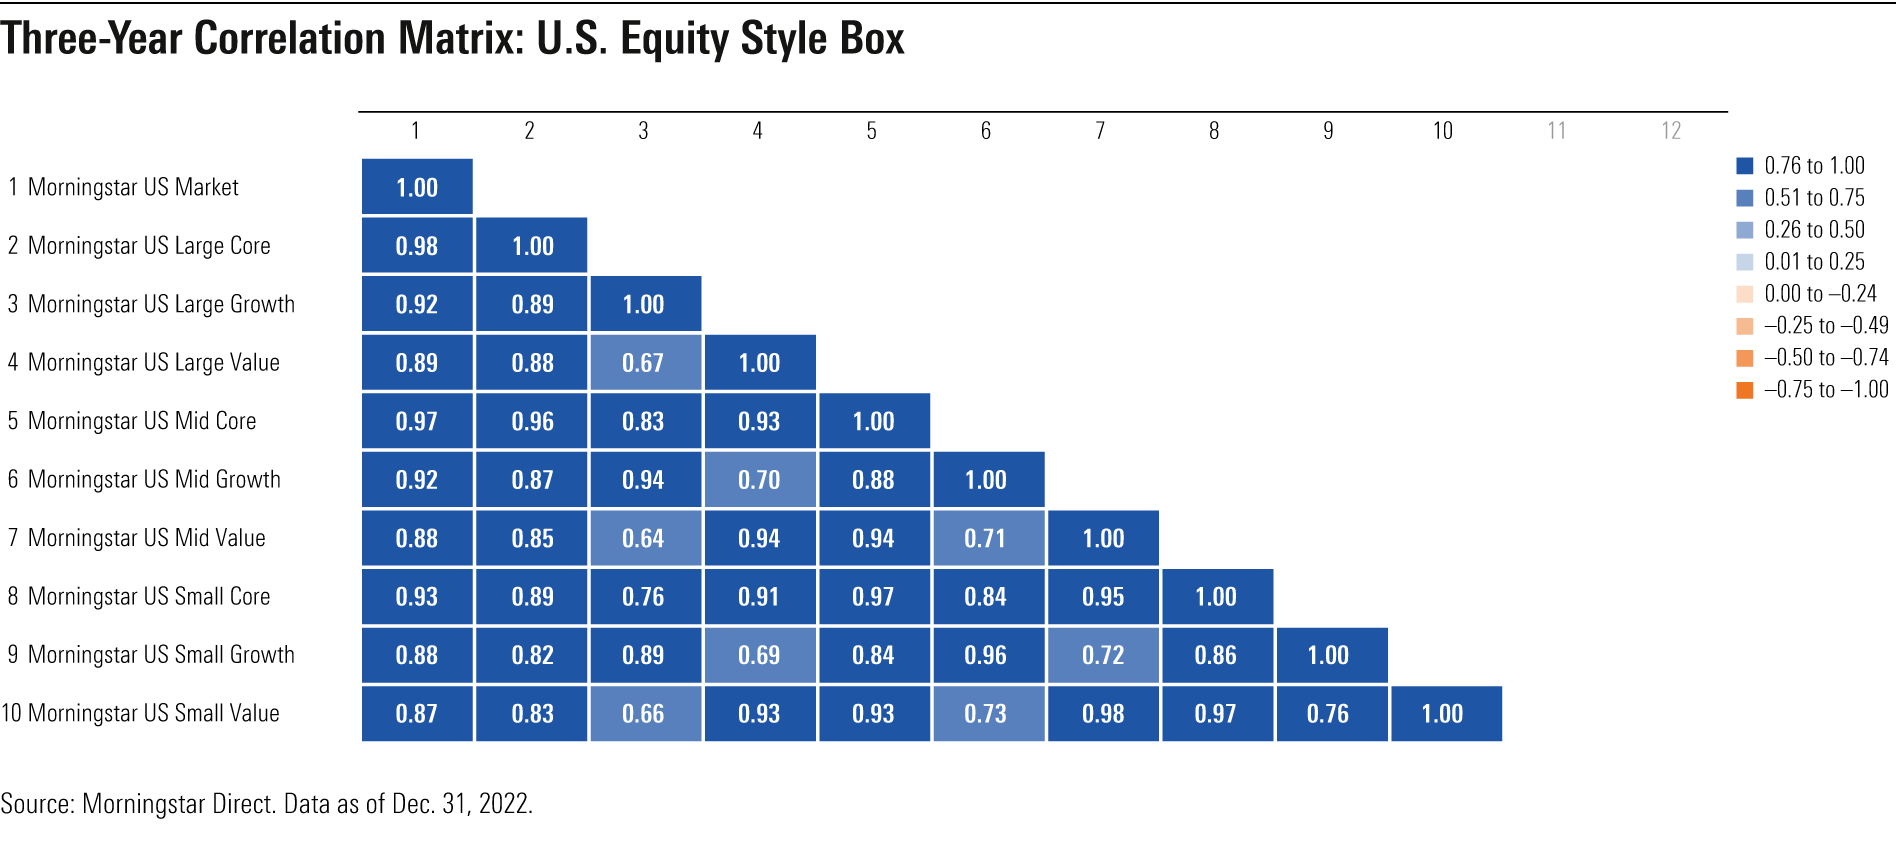
The take-home point is that a high correlation coefficient doesn’t translate into similar returns; correlation measures only the direction, not the magnitude, of returns. Indeed, most of the nine boxes have had high correlations with the broader equity market over the past three years, as shown in the exhibit above. The Morningstar US Large Core Index had the highest correlation coefficient (0.98) with the broader equity market, while the Morningstar US Small Value Index was the lowest at 0.87.
While all nine boxes showed close correlations with the Morningstar US Market Index, correlations between individual style boxes were sometimes much lower. Over the trailing three-year period ended in December 2022, the Morningstar US Mid Value and Morningstar US Small Value indexes had correlation coefficients of just 0.64 and 0.66, respectively, with the Morningstar US Large Growth Index. The Morningstar US Large Value Index also had a relatively low correlation of just 0.67 with its large-growth counterpart over the trailing three-year period.
Longer-Term Trends
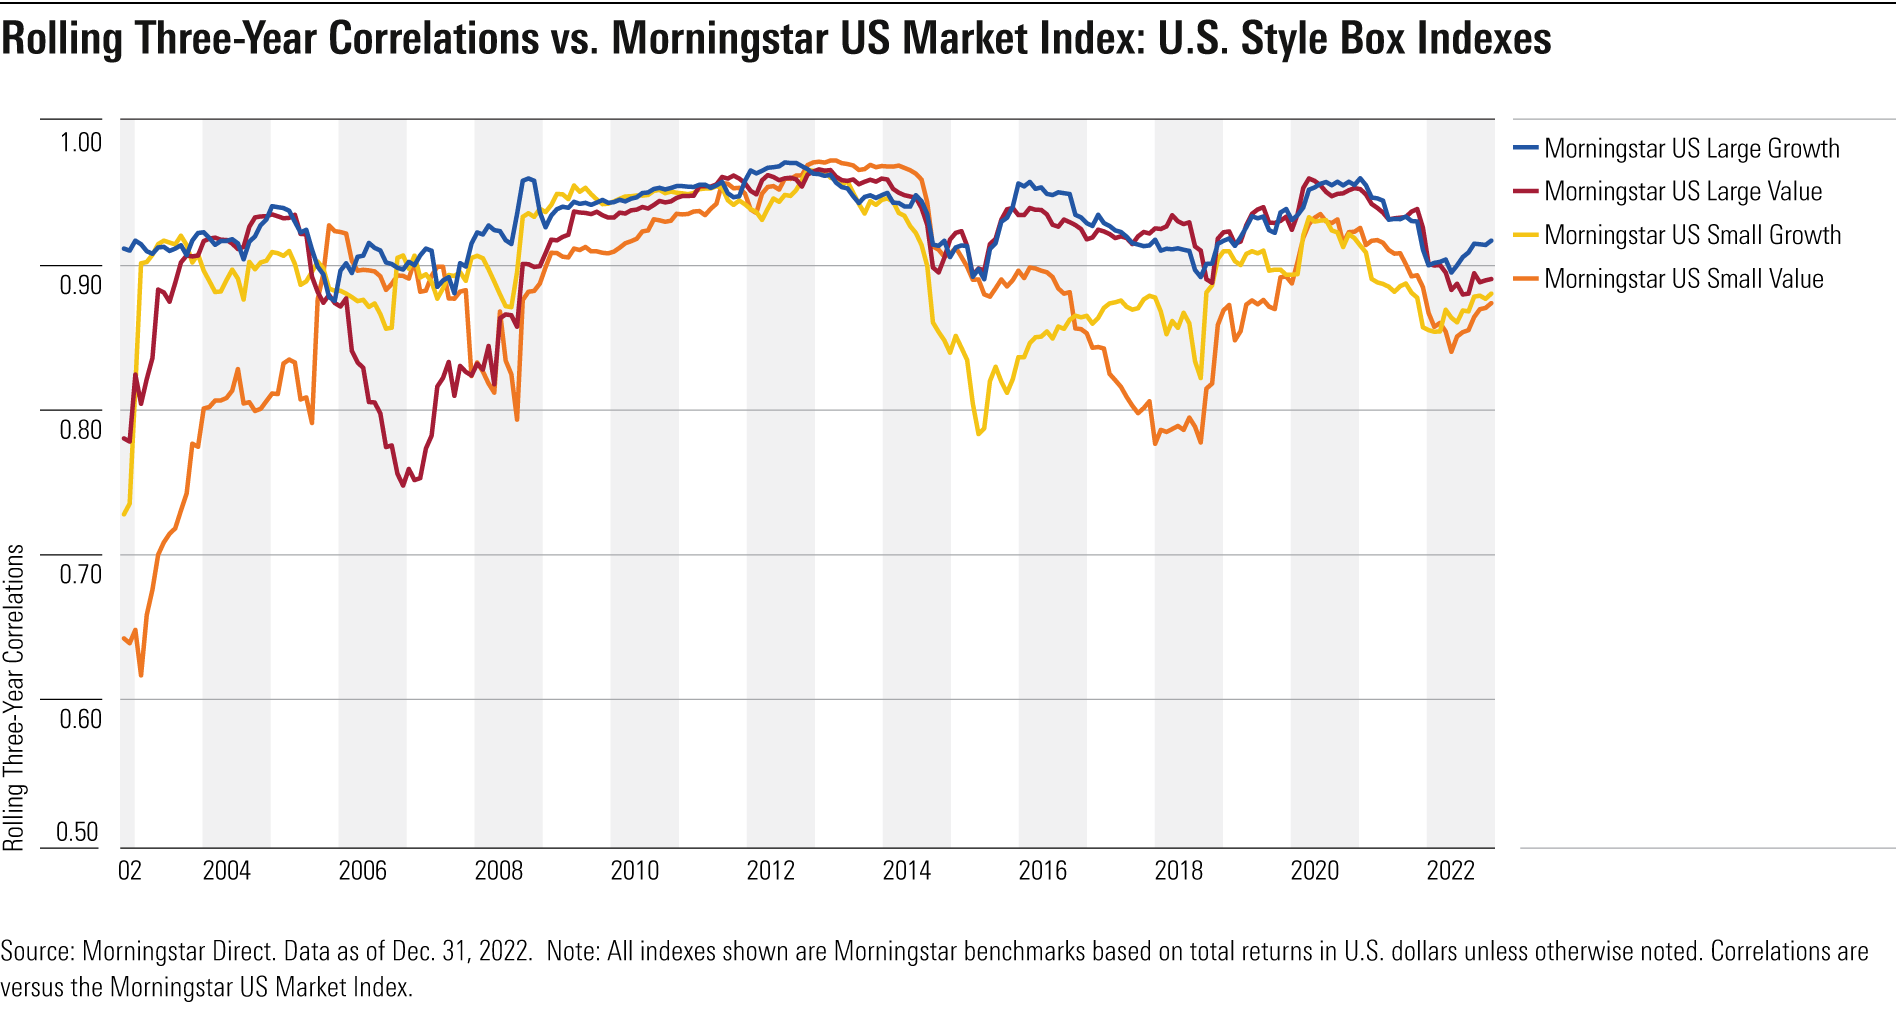
Since 2000, correlations for the nine style box indexes have trended higher overall, suggesting that style-based diversification is becoming more difficult. However, there have been some notable divergences over time. For example, small-cap stocks decoupled from the Morningstar US Market Index to the greatest degree between 2015 and 2018. From October 2015 through September 2018, the correlation coefficient for the Morningstar US Small Value Index fell to 0.78, and the same metric decreased to 0.82 for the Morningstar US Small Growth Index.
These results reinforce the importance of broad diversification. While all nine style boxes have had relatively high correlations with the Morningstar US Market Index, they have often shown marked divergence in returns across the group. Until recently, for example, investors would have paid a high price—during both rallies and down markets—for overweighting value at the expense of growth. But the huge performance differential between value and growth during the 2022 bear market is a testament to the value of style-based diversification. Because it’s impossible to predict which style will fare best in any particular market, it’s prudent to maintain a diversified portfolio and avoid overweighting either value or growth.
The author or authors do not own shares in any securities mentioned in this article. Find out about Morningstar’s editorial policies.
/cloudfront-us-east-1.images.arcpublishing.com/morningstar/CGEMAKSOGVCKBCSH32YM7X5FWI.png)
/cloudfront-us-east-1.images.arcpublishing.com/morningstar/LUIUEVKYO2PKAIBSSAUSBVZXHI.png)
:quality(80)/s3.amazonaws.com/arc-authors/morningstar/360a595b-3706-41f3-862d-b9d4d069160e.jpg)