
529 Plans: What’s Changed and What’s the Same?
Six charts on movements in fees and assets amid rising education inflation.
/s3.amazonaws.com/arc-authors/morningstar/9e407e19-2c9a-4686-b59c-2dc342d81fdd.jpg)

Since their launch more than 20 years ago, 529 college savings plans have helped students and their families better access higher education through tax-advantaged investing. In this annual industry review, we discuss key themes across the 529 college savings plan landscape, including education inflation, asset growth, declining fees, and more.
Backdrop—Education Inflation Is Back on the Rise
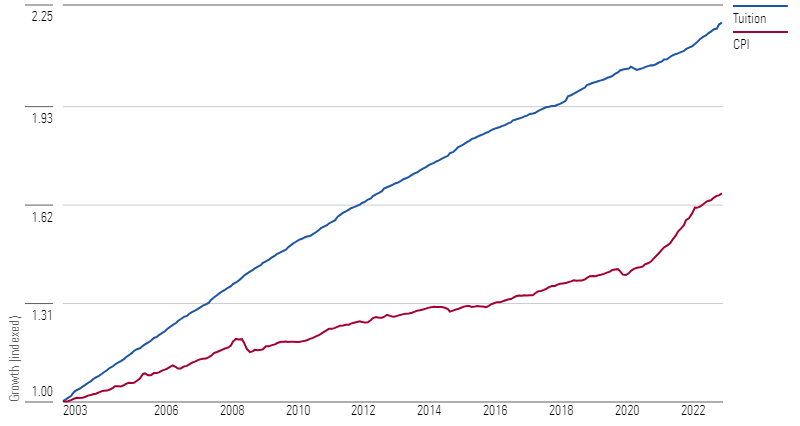
For most of the past two decades, the cost of education rose more quickly than the general inflation rate, with the Consumer Price Index growing at 2.5% annually while the Tuition Index grew at 4%. Although this trend reversed in 2020 and has remained so since, it does not mean that education inflation has subsided. Rather, education inflation just briefly paled in comparison to the general price index as the world dealt with some extraordinary issues over the past few years. In fact, rolling 12-month inflation data shows that education inflation is on the rise again, easily surpassing 3% in March 2023. Continually rising tuition costs underpin the importance for families to save early and frequently within a 529′s tax-advantaged structure; the additional time helps harness the effects of compounding to keep up with these increasing costs.
Growth of CPI vs. Tuition (Indexed)
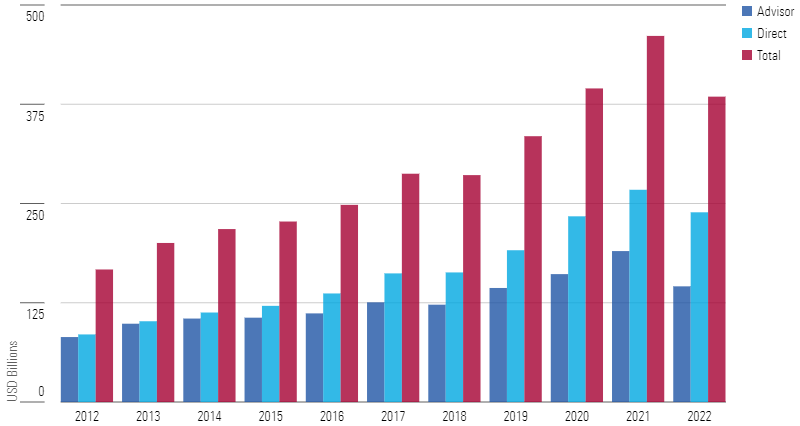
529 Industry Assets Fall in 2022
In 2022, we saw a sizable decline in total 529 plan assets, the largest over the past decade, which had been a steady period for growth. Assets in 529 plans decreased by nearly 17% in 2022, dropping to $385 billion by year-end from $461 billion. Hardly any plan was immune to the market decline, with a vast majority of plans experiencing a decrease in total assets; the median loss was 14%. Direct-sold plans, which tend to carry lower fees and have grown faster than advisor-sold plans over the past decade, lost 15.8% on average. On the other hand, an average advisor-sold plan lost 20% of its assets in 2022.
Assets Under Management by Distribution Channel
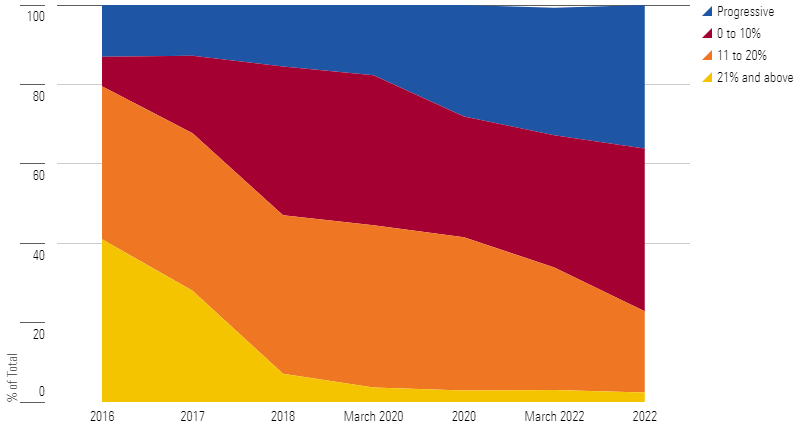
Glide Paths Have Become Smoother; Plans Pause on Taking Additional Equity Risk
Most 529 accountholders utilize an age-based or target-enrollment strategy, which is a set-it-and-forget-it type of investment that starts with a large allocation in risky assets (that is, equities) when the beneficiary is young. As the beneficiary grows older, the portfolio transitions to a more conservative positioning by allocating more to bonds and cash or cashlike accounts. A glide path shows how an age-based or target-enrollment series’ allocation shifts to a more conservative positioning as the beneficiary grows closer to college enrollment. Over the years, Morningstar has cautioned investors against glide paths with large equity steps (21% or more), as they expose investors to market-timing risk. If a portfolio happens to derisk after a large market decline, investors risk locking in their losses and capping their upside by selling stocks at their low and allocating those funds to bonds and cash.
In recent years, many plan providers have improved their series by adopting a smoother glide path, and 2022 was no exception. Several plans have adopted a progressive glide path, which makes small (around 2%) asset-allocation changes, typically four times a year. Others have added portfolios to their age-based series so that the equity step-downs (which take place in one day) are 12.5% or less. By the end of 2022, close to 80% of all plans featured equity steps of 10% or less, while series with large step-downs accounted for less than 3% of the industry.
Percentage of Series by Greatest Equity Step
The chart below shows the average equity allocation of 166 age-based or target-enrollment series, divided into five groups. The first group, progressive, includes 60 series that typically follow one glide path but may provide choice. For example, plans managed by Fidelity, such as Massachusetts’ U.Fund College Investing Plan, which has a Morningstar Medalist Rating of Bronze, employ one progressive glide path but provide a choice of three series: one that uses all active underlying funds, one that uses all index funds, and one that uses a blend of active and index funds. This group saw several new entrants, including Idaho’s Vanguard Target Enrollment series and Arkansas’ Bright Future Target Enrollment series, launched in April and September 2022, respectively. These new plans harbor varying risk appetites along the glide path. On average, however, there were not any notable changes in the equity allocation.
Average Glide Paths for Progressive and Age-Based Series
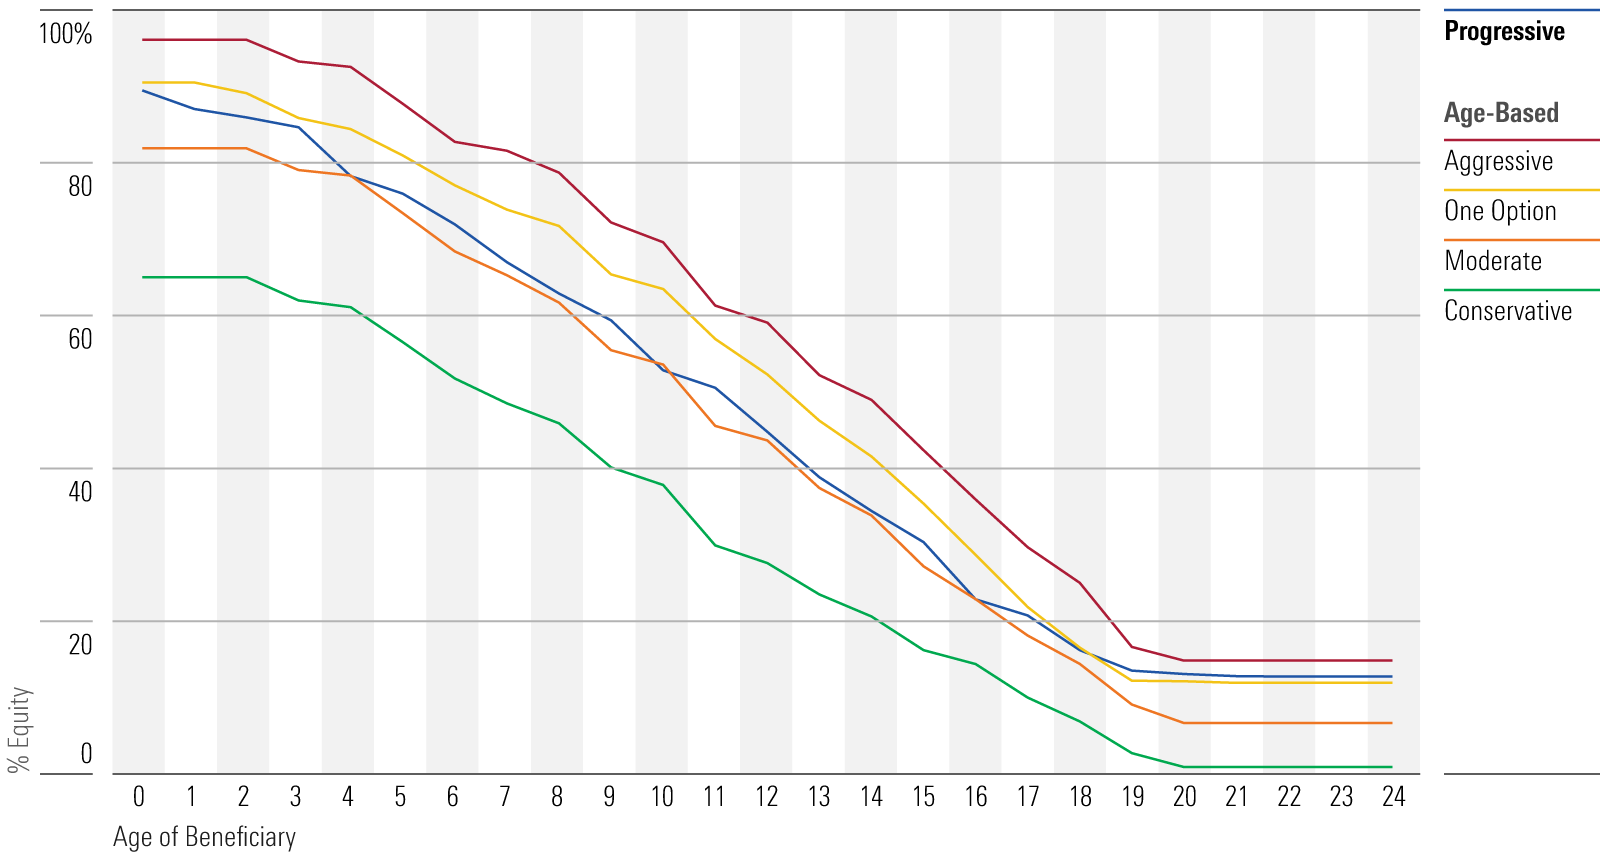
The remaining four groups follow an age-based stepped glide path. There are 25 plans that offer one glide path option, depicted as “age-based: one option.” This group saw a roughly 2% increase in equity allocation across the glide path. Other plans allow investors to pick their preferred risk profile by providing aggressive, moderate, and conservative options. These “target-risk” glide paths saw little increase in equity allocation; in fact, the equity stakes decreased in some parts of the glide path.
Fees Continue to Fall
Average fees continue to fall across the investment industry, including 529 savings plans. By the end of 2022, the average fee for an age-based or target-enrollment series was 0.46%, a 2-basis-point decline from the year before. Direct-sold plans maintained their fee advantage and slashed another 3 basis points, arriving at an average fee of 0.31%. Advisor-sold plans remained significantly more expensive, with an average fee of 0.83% after a basis-point decline in 2022.
Average Total Expense Ratios of Age-Based and Target Enrollment Series
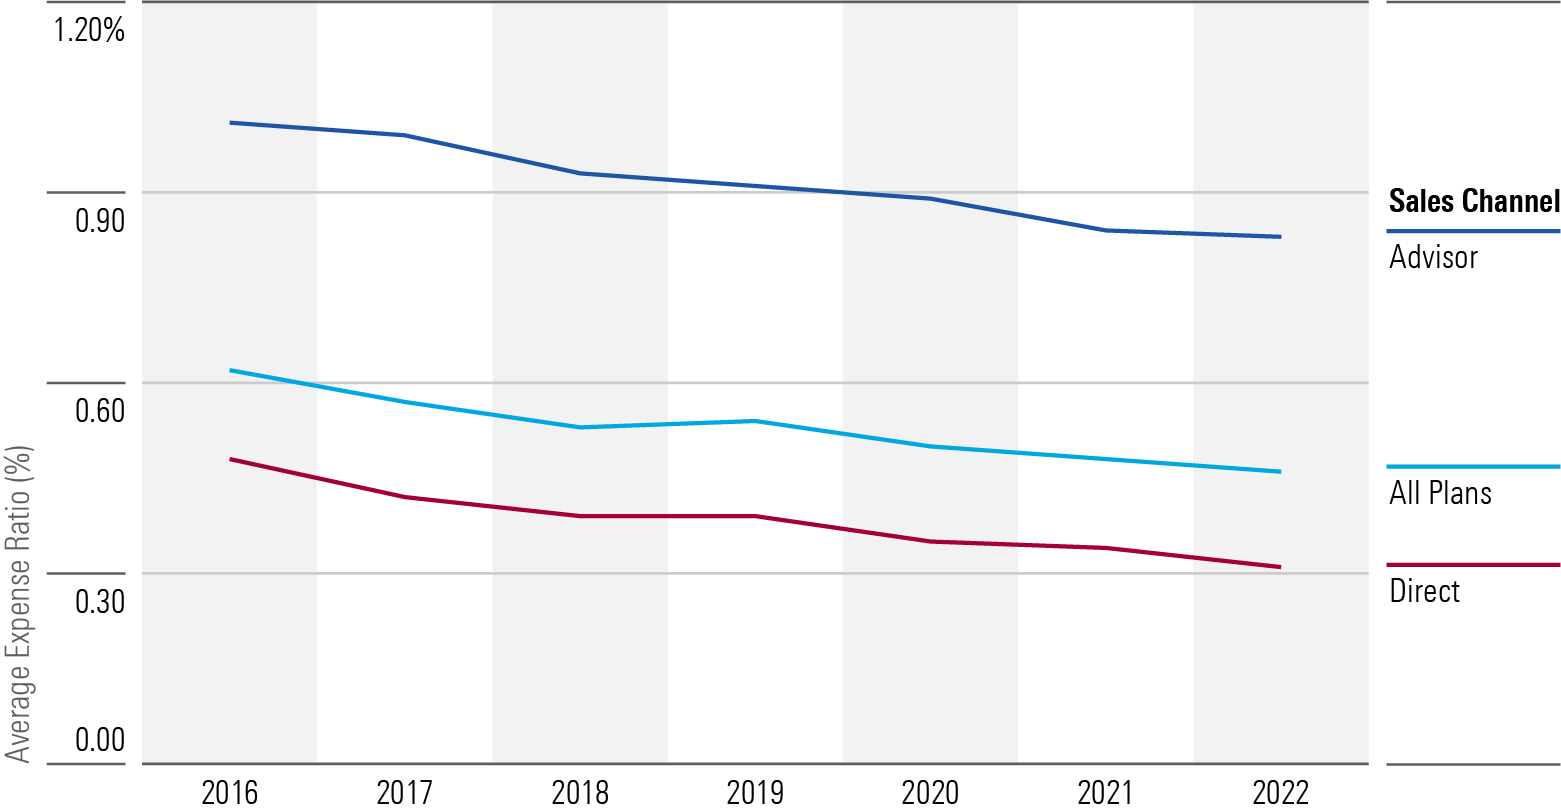
Fee reductions can come from multiple sources. A switch to cheaper (often passive) underlying funds is one way. For example, Bronze-rated Florida 529 Savings Plan switched to index funds in the target enrollment series in 2022 and became the cheapest plan in the industry. Illinois’ Bronze-rated Bright Directions Advisor-Guided 529 plan also added an all-passive track in November 2022 that features Vanguard and iShares index funds, offering a cheaper option to its investors. Other plans have trimmed their state fees and/or negotiated with their program manager for lower fees. Plans with a growing and relatively larger asset base can achieve some economies of scale, which can be passed on to investors through lower fees. For instance, Silver-rated Oregon College Savings Plan met its $2.5 billion breakpoint in 2022, resulting in a slight reduction to its asset-based fees. Moreover, as the team saw stable asset growth, it cut its administrative fee by 5 basis points.
Age-Based and Target-Enrollment Series Fees by Distribution and Allocation in Active Funds
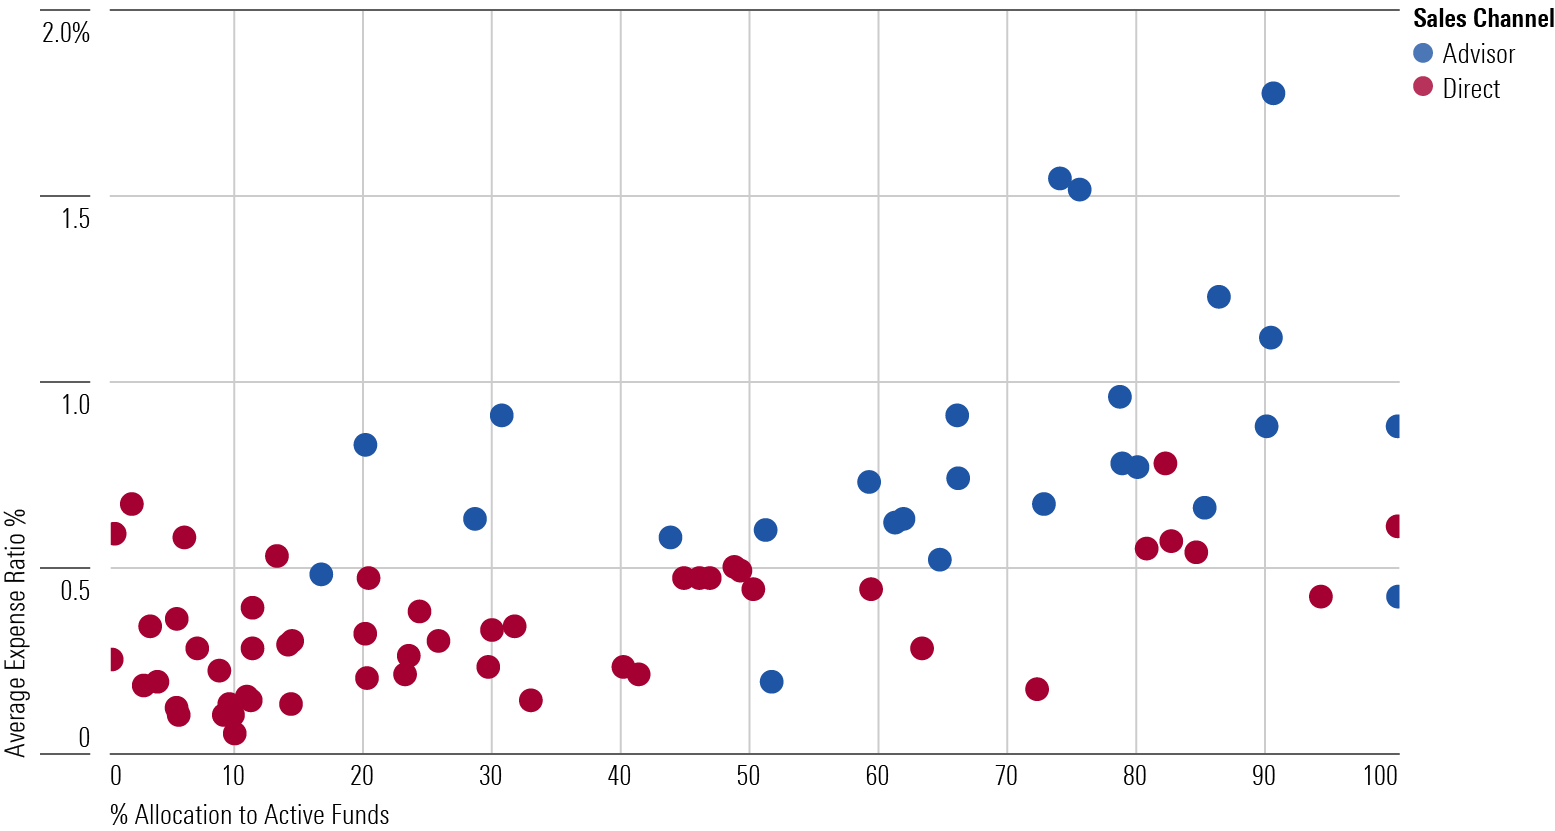
Advisor-sold plans remain more expensive on average than direct-sold plans, partially because of their higher allocation to actively managed strategies (see chart above). While holding actively managed strategies itself is not a flaw, investors need to ensure that the fees do not eat into their investment returns. For instance, New Hampshire’s Fidelity Advisor 529 Plan earns a High People rating thanks to its impressive lineup of active managers. However, a hefty price tag that ranges from 0.67% to 1.85% keeps its rating at Neutral.
Having said that, advisor-sold plans can hold index funds and still be expensive because of sales and distribution fees paid to the advisor. For instance, Maine offers an advisor-sold series that only holds low-cost index funds. The weighted average fee for the underlying index funds is just 8-10 basis points, but after adding program management, administrative, and distribution fees, the average total expense ratio ranges from 0.57% to 1.37%.
As the Price Pillar accounts for 30% of the Morningstar Medalist Rating for 529 plans, there are very few advisor-sold plans that earn a Bronze rating or higher. As of June 2023, only three such plans exist: Illinois Bright Directions Advisor-Guided 529 Plan, Ohio’s BlackRock CollegeAdvantage, and Virginia’s CollegeAmerica. All three earn Above Average or High ratings in all pillars besides Price, reflecting a well-thought-out process, high-caliber investment personnel, and/or exemplary oversight.
Morningstar doesn’t prefer active or passive funds for age-based or target-enrollment series. In fact, we recognize promising 529 plans offering series across the active-passive spectrum. However, our research has consistently shown that, over time, lower-fee options provide a reliable edge relative to peers. Lower fees present lower performance hurdles, putting less pressure on portfolio managers to take more risk to make up their funds’ costs. It’s hard even for outstanding asset allocation and talented managers to consistently overcome high costs, especially when their styles are out of favor. Low fees, however, are a dependable advantage that compounds over time and can lead to better investor outcomes.
The author or authors do not own shares in any securities mentioned in this article. Find out about Morningstar’s editorial policies.
/cloudfront-us-east-1.images.arcpublishing.com/morningstar/WDFTRL6URNGHXPS3HJKPTTEHHU.png)
/cloudfront-us-east-1.images.arcpublishing.com/morningstar/IFAOVZCBUJCJHLXW37DPSNOCHM.png)
/cloudfront-us-east-1.images.arcpublishing.com/morningstar/JNGGL2QVKFA43PRVR44O6RYGEM.png)
:quality(80)/s3.amazonaws.com/arc-authors/morningstar/9e407e19-2c9a-4686-b59c-2dc342d81fdd.jpg)