
A Closer Look at US Thrift Savings Plan TSP Funds in 2024
The index-based investments underlying the TSP continue to deliver, with TSP G Fund especially helping the target-date funds.


The US Federal Thrift Savings Plan recently crossed the $900 billion asset threshold and continues to add a steady stream of new participants to the more than 7 million accountholders it already serves. While Tsp.gov provides some basic information on the investments in this massive plan, this new series aims to provide more context around how the TSP funds stack up to their peers.
Your input has shaped what you see here. Thank you to the many who have taken time to provide your feedback. Please take a moment to let us know how we’re doing and what else you’d like to see in this series by answering a few questions in our TSP feedback survey.
Overview of Federal TSP Fund Results
The TSP plan consists of 16 investment offerings, with five individual funds and 11 lifecycle/target-date funds. Navigate via the page menu on the left for fund highlights and performance results as of the end of October 2024.
Stand-Alone/Individual TSP Funds
TSP’s suite of individual funds consists of a well-edited menu of mostly index-based strategies. With only limited exceptions, workers have access to most major world markets via low-cost investments funds. TSP I Fund recently broadened its scope by adding emerging-markets equities to its mix of non-US stock holdings, providing welcome diversification to TSP participants. The plan continues to lack exposure to high-yield and international bonds—the former tends to be more common than the latter for US workers’ savings plans.
The available suite of individual TSP funds and their asset-class exposure include:
- TSP C Fund—US Large-Cap Stocks
- TSP S Fund—US Mid- and Small-Cap Stocks
- TSP I Fund—Non-US Stocks
- TSP F Fund—US Bonds
- TSP G Fund—US Government/Ultrashort Bonds
TSP C Fund—US Large-Cap Stocks
- Tracking Index: S&P 500 Index
- Funds with similar holdings: Vanguard 500 Index VFIAX, Fidelity 500 Index FXAIX, iShares Core S&P 500 IVV, Schwab S&P 500 Index SWPPX
- Morningstar Category Index: Morningstar US Large-Mid TR Index
- Morningstar Category: US Fund Large Blend
The TSP C Fund, also known as the TSP Common Stock Index Investment Fund, tracks the S&P 500 index, which consists of 500 of the largest public companies in the US and represents about 80% of the US equity market based on market capitalization. The portfolio’s market-cap-weighting approach allows it to harness the market’s collective wisdom of each holding’s relative value. It’s a tactic that makes sense in the large-cap investing space, where new information tends to be quickly incorporated into prices.
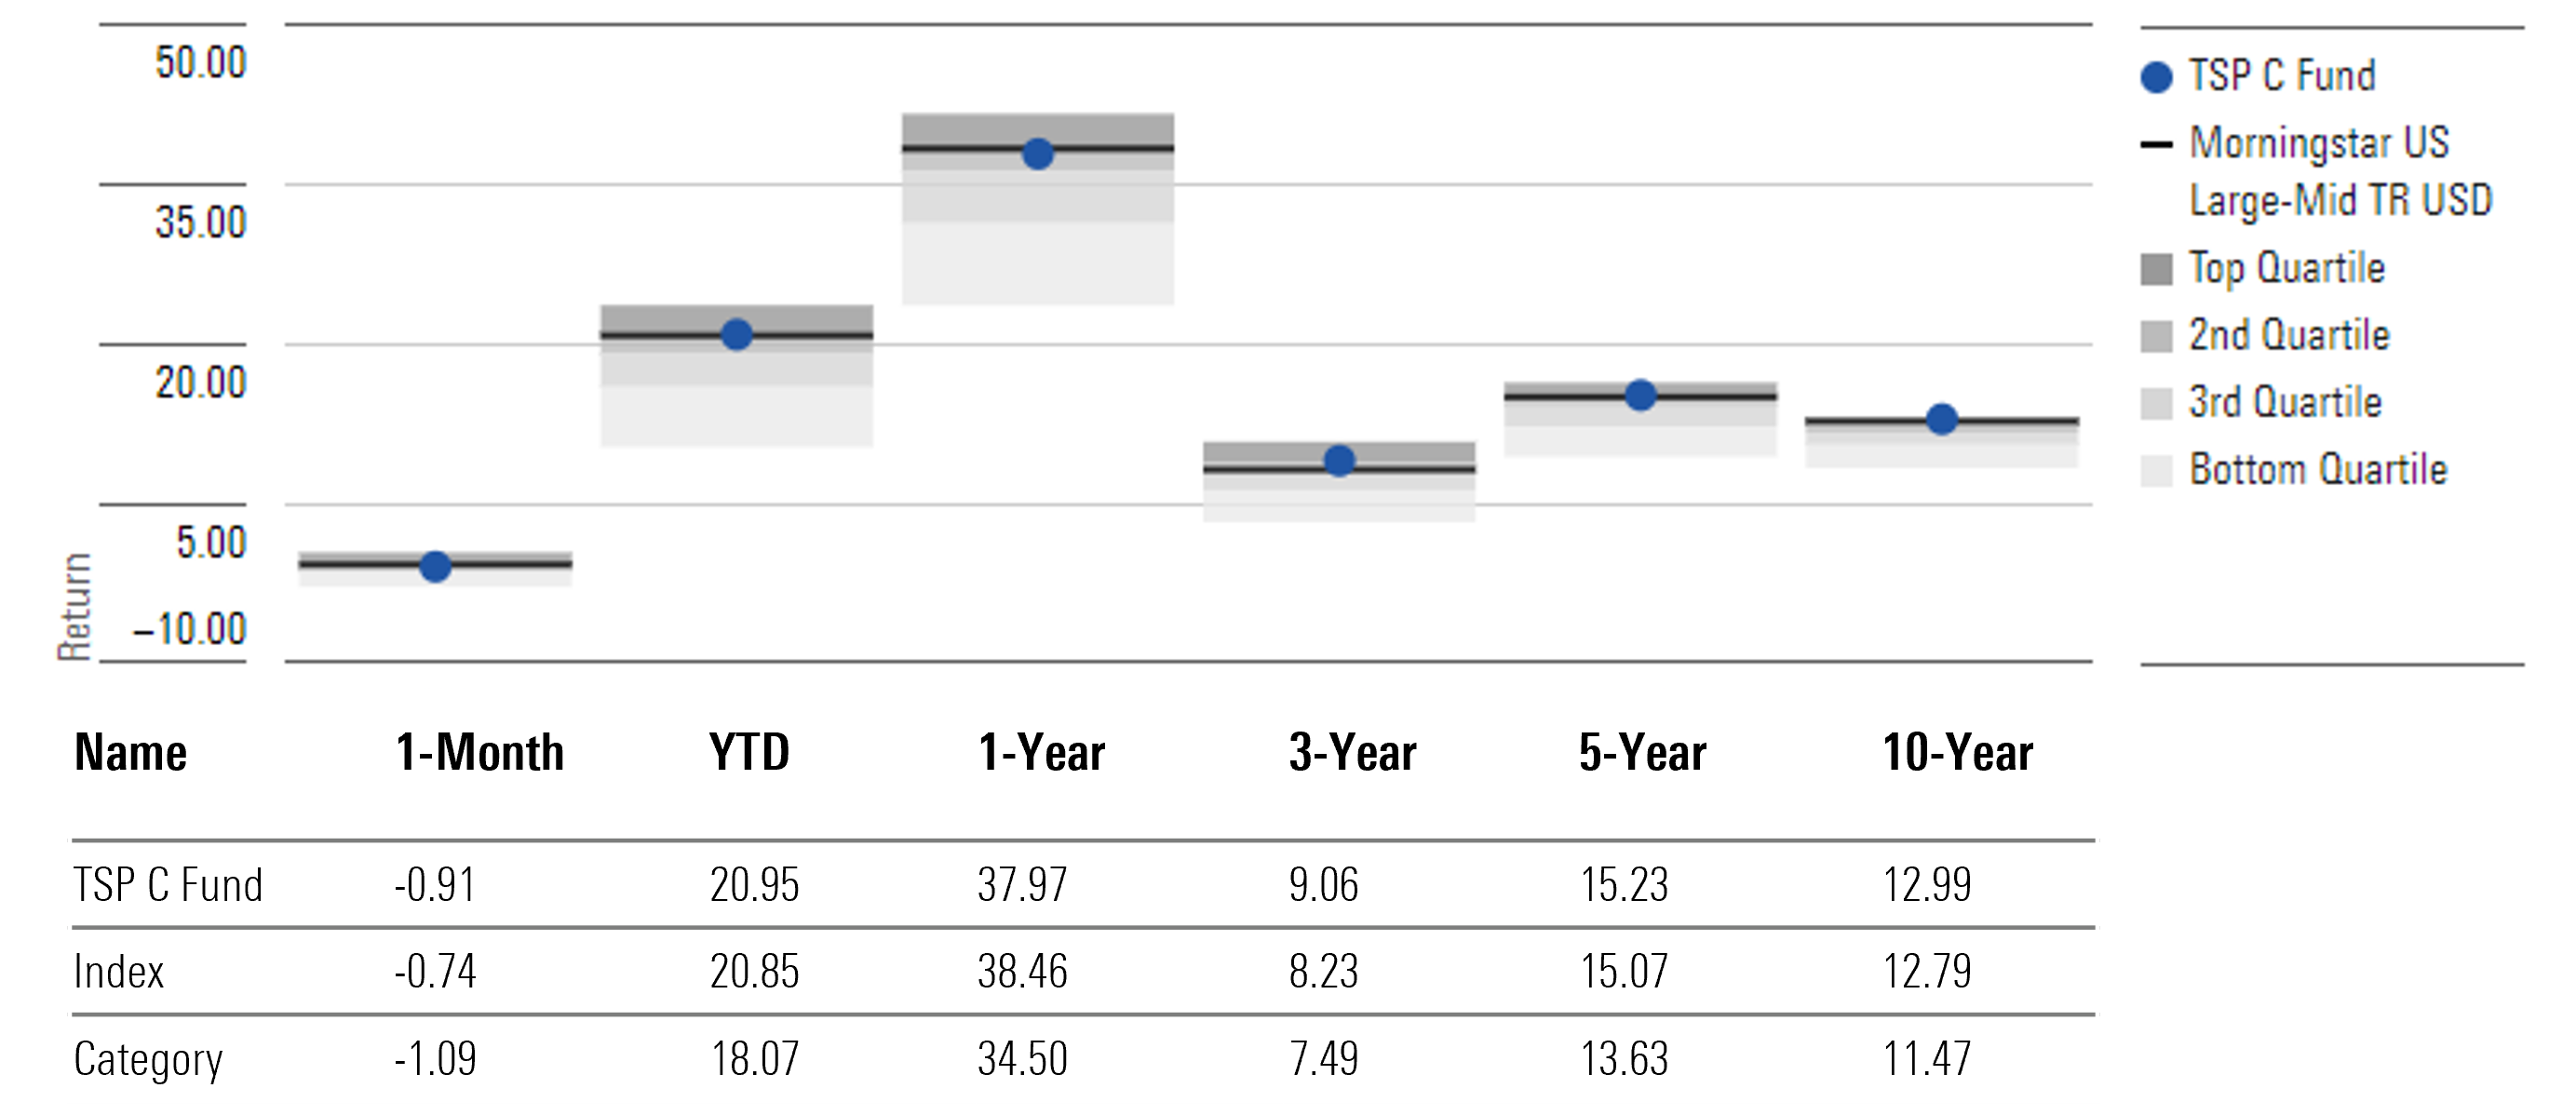
Indeed, active strategies have tended to struggle against passive ones in the large-blend Morningstar Category, and TSP C Fund has benefited from that pattern. While the fund lost 0.9% in October 2024, that was still ahead of the large-blend category average’s 1.1% loss. Over longer periods, market efficiency and TSP C Fund’s low fees have kept it in the top quartile of large-blend peers over the trailing three-, five-, and 10-year periods through October 2024.
TSP C Fund Annualized Returns Through Oct. 31, 2024
TSP S Fund—US Small- and Mid-Cap Stocks
- Tracking Index: DJ US Completion Total Stock Market TR Index
- Funds with similar holdings: Fidelity Extended Market Index FSMAX
- Morningstar Category Index: Morningstar US Mid TR Index
- Morningstar Category: US Fund Mid-Cap Blend
The TSP S Fund, also known as the TSP Small Cap Stock Index Investment Fund, tracks the Dow Jones US Completion Total Stock Market Index. This cap-weighted index seeks to provide exposure to the entire US equity market outside of the approximately 500 holdings included in the S&P 500 index, which TSP tracks via the TSP C Fund. TSP S Fund includes mid- to micro-cap stocks, plus some large-cap stocks that don’t meet the S&P 500’s selection criteria and make the fund comparable to investments in the mid-cap blend Morningstar Category.
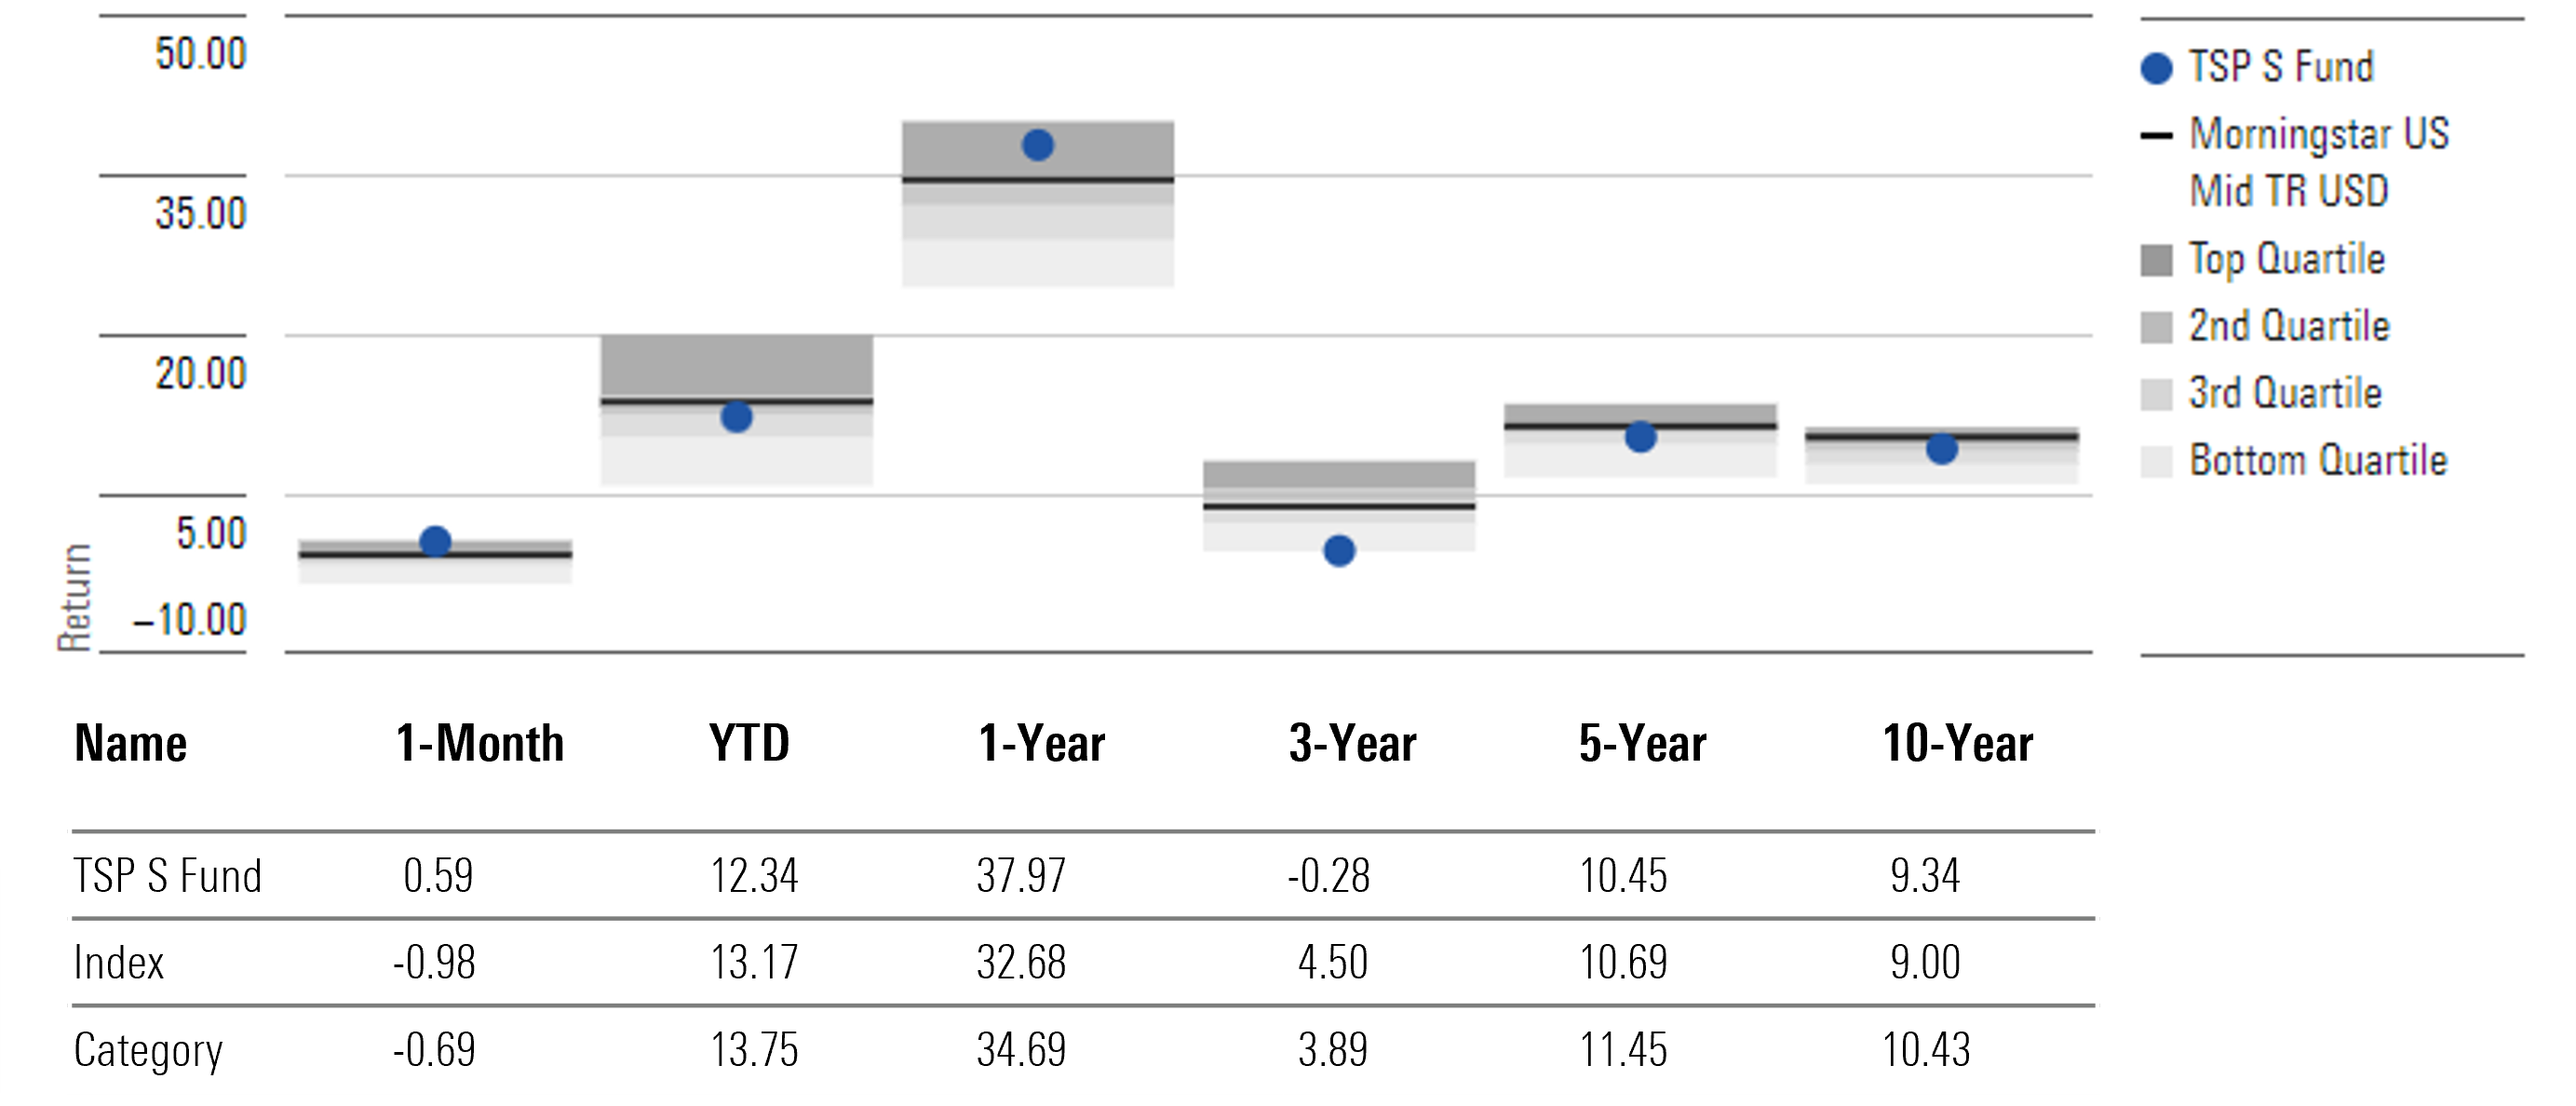
TSP S Fund’s large-cap holdings have had outsize impacts on the portfolio. For example, Tesla TSLA and other fast-growing technology names posted stellar returns in late 2020, taking the top spots in the portfolio and pushing it into the mid-growth category. Tesla’s weight in the portfolio shot up to more than 6% at the end of 2020 from about 1% at the end of 2019. The S&P 500 added Tesla in December 2020, and the fund subsequently sold its stake completely. The fund’s 31.9% gain in 2020 more than doubled the return of the typical mid-cap blend Morningstar Category peer. Those trends reversed in subsequent years. In 2022, for example, TSP S Fund’s 26.3% loss was more than 12 percentage points worse than the category average. TSP S Fund’s 10-year annualized gain through the end of October 2024 of 9.3% is slightly ahead of the category average of 9.0%, but investors have had to endure more volatility to get there.
TSP S Fund Annualized Returns Through Oct. 31, 2024
TSP I Fund—International Stocks
- Tracking Index: MSCI ACWI IMI ex China, HK, USA Index
- Funds with similar holdings: None that have the same China and Hong Kong market exclusions. Fidelity Total International Index FTIHX and iShares Core MSCI Total International Stock IXUS are the closest but include China and Hong Kong markets.
- Morningstar Category Index: MSCI ACWI Ex USA NR Index
- Morningstar Category: US Fund Foreign Large Blend
TSP announced at the end of October 2024 that TSP I Fund, also know as the TSP International Stock Index Investment Fund, had fully switched to tracking the MSCI ACWI IMI ex China, HK, USA Index from MSCI EAFE Index. Among other changes, this index swap resulted in a portfolio with more small- and mid-cap companies, as well as exposure to emerging-markets equities. Including emerging-markets stocks widens the scope of this fund relative to some foreign large-blend Morningstar Category peers. The average fund in the group allocates around one tenth of its portfolio to these stocks, while TSP I Fund has more than double that. This larger allocation may give the fund a leg up since emerging-markets stocks have historically paid for their higher volatility with strong returns during market rallies.
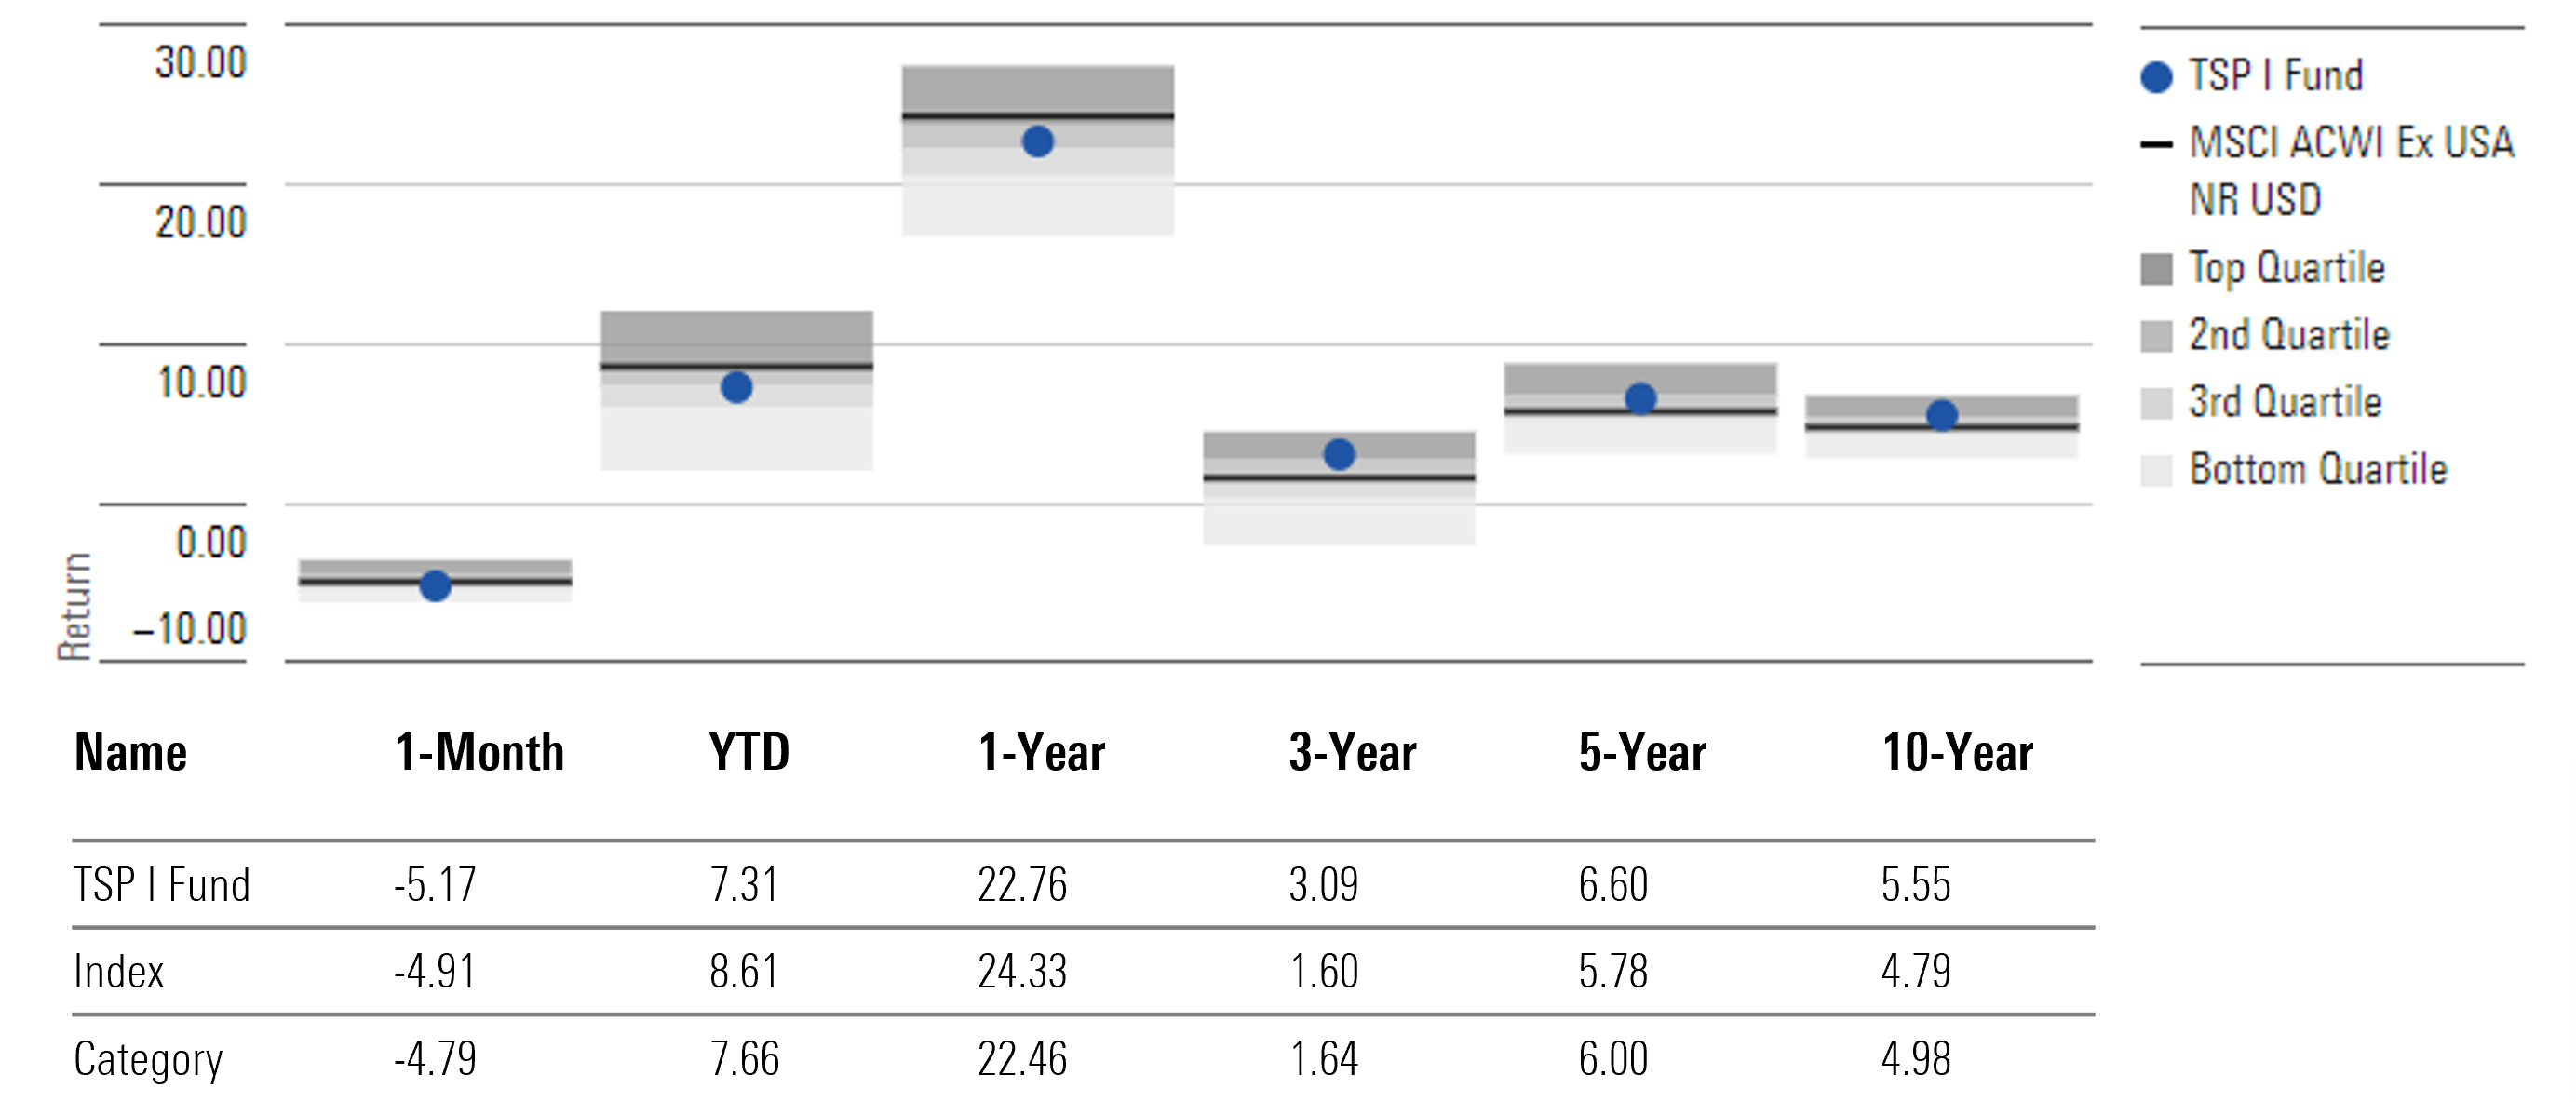
Emerging-markets stocks have struggled in recent years, though, so TSP I Fund’s lack of exposure to emerging markets for most of this time have helped results relative to other foreign large-blend funds. Over the last three years through October 2024, the fund’s 3.1% annualized gain has beaten the peer average by 1.5 percentage points and ranked in the category’s top quartile.
TSP I Fund Annualized Returns Through Oct. 31, 2024
TSP F Fund—US Bonds
- Tracking Index: Bloomberg US Aggregate Bond Index
- Funds with similar holdings: iShares Core US Aggregate Bond AGG, Schwab US Aggregate Bond SCHZ, SPDR Portfolio Aggregate Bond SPAB
- Morningstar Category Index: Bloomberg US Aggregate Bond Index
- Morningstar Category: US Fund Intermediate Core Bond
The TSP F Fund, also known as the TSP Fixed Income Index Investment Fund, tracks the Bloomberg US Aggregate Bond Index, which includes taxable, investment-grade US bonds with at least one year until maturity. Issuing activity in that market, which is dominated by US Treasuries, dictates the portfolio’s composition. This index-based approach has merit, as the US investment-grade bond market is highly efficient and liquid, providing TSP F Fund an edge on pricier active strategies that must take greater risk to recoup their fees.
Over the last decade through October 2024, TSP F Fund’s 1.7% annualized gain has outpaced the typical intermediate core bond Morningstar Category peer by 23 basis points, largely thanks to its low fees. Performance patterns have been predictable in different market environments. Thanks to minimal credit risk, the fund performs better than peers when credit spreads widen but worse when they narrow. Fund performance may be more volatile than peers when interest rates fluctuate because the index has generally had slightly longer duration than the category average. However, the gap is small, meaning those deviations should be kept to a minimum.
TSP F Fund Annualized Returns Through Oct. 31, 2024

TSP G Fund—Ultrashort Bonds
- Tracking Index: Not applicable
- Funds with similar holdings: Not applicable
- Morningstar Category Index: Bloomberg Government/Corporate 1 Year Duration TR Index
- Morningstar Category: US Fund Ultrashort Bond
No investment fund quite resembles TSP G Fund, as we’ve written in articles such as, “How Good Is the Federal Government’s G Fund?” Also known as the TSP Government Securities Investment Fund, TSP G Fund pays investors the higher yield that comes from longer-term US government bonds, but it does so without the risk of their day-to-day market price fluctuations. For performance context purposes, we compare TSP G Fund with the ultrashort bond Morningstar Category. The fund has advantages over this category, both from absolute and risk-adjusted return perspectives, because TSP G Fund draws income from longer-maturity bonds. That’s somewhat balanced by the ability for funds in this category to invest in corporate bonds in addition to government ones.
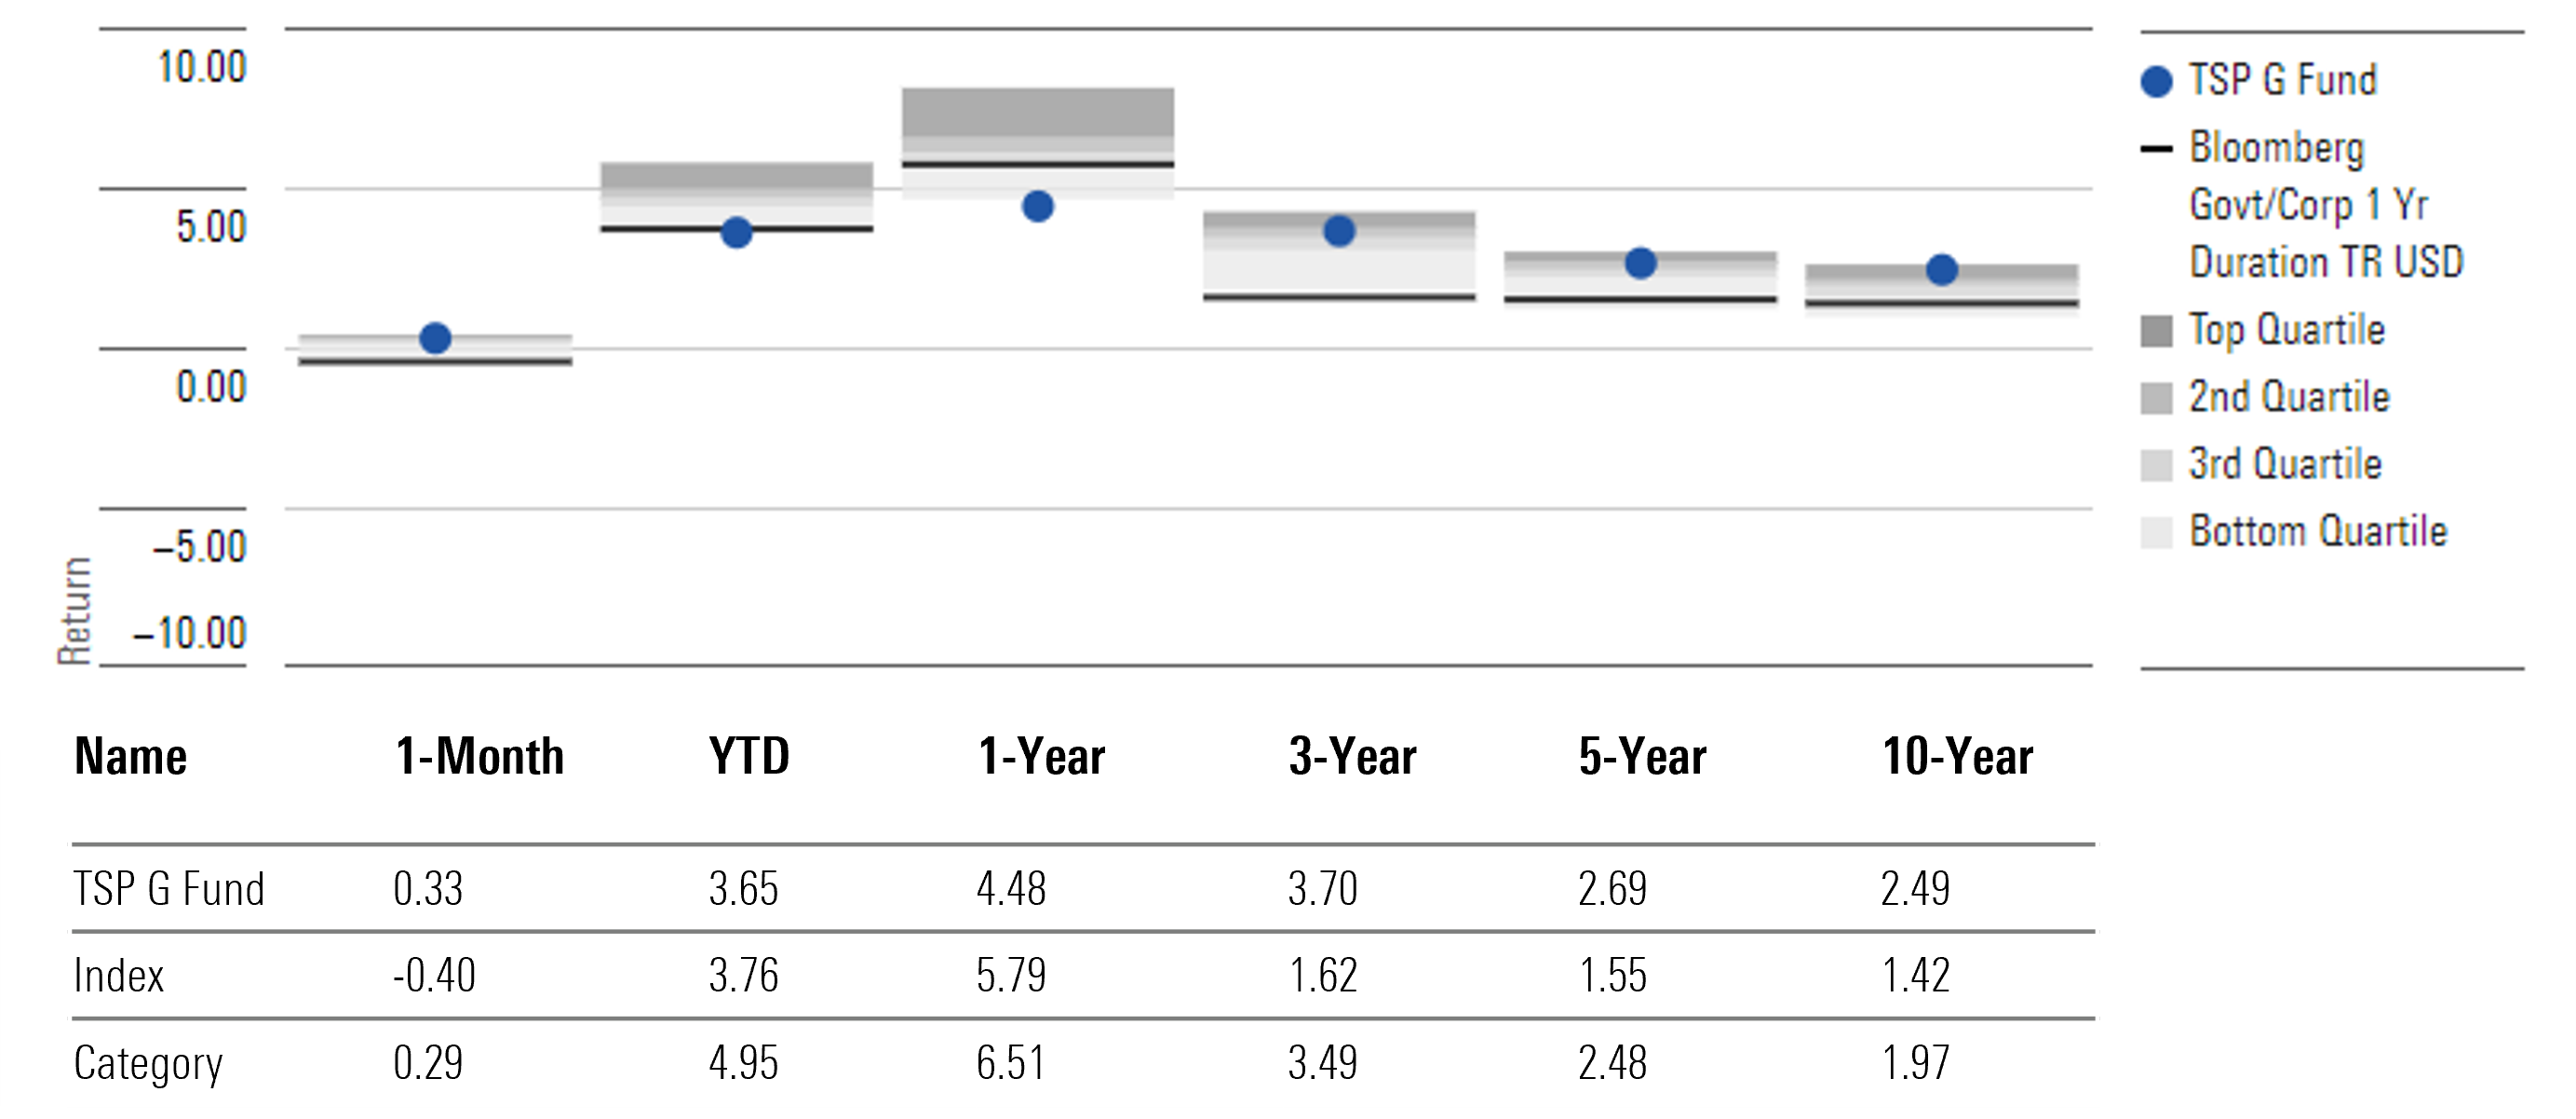
The fund’s income tailwind and low fee advantage have overcome its corporate credit headwind. Over the last three- and five-year periods through October 2024, TSP G Fund has outpaced the ultrashort bond category average by about 20 basis points annually. Over the 10-year period, it has come out on top by more than 50 basis points. With its low volatility, TSP G Fund has delivered superior risk-adjusted returns; it has a 10-year Sharpe ratio of 3.6 versus 0.1 for the category average.
TSP G Fund Annualized Returns Through Oct. 31, 2024
Lifecycle/Target-Date TSP Funds
The TSP L Funds, also known as the TSP Lifecycle Funds, are target-date funds that invest in a mix of the five individual TSP funds. The L Funds automatically become less equity-heavy over time, moving into bonds and the TSP G Fund as workers approach their retirement year.
Investors should generally choose the TSP L Fund number that matches most closely with their expected year of retirement. Using TSP investor demographics, TSP models the L Funds for an expected retirement age of 62. The typical TSP L 2025 investor, then, turned 61 years old in 2024. TSP only began offering target-date TSP L Funds in five-year increments starting in July 2020. Prior to that, the funds were offered in 10-year increments, so its funds “on the 5s,” such as TSP L 2025 and TSP L 2035, have limited track records. For each TSP L Fund detailed below, we use a general guideline of adding and subtracting two years to the target age to help investors decide which fund might be most appropriate for them; TSP L 2025, for instance, has a target age of 61 and may be appropriate for those between 59 and 63 years of age.
Whereas the TSP L Funds' equity allocation glide path was once notably light on equities, it‘s currently in the midst of a multiyear transition to a new glide path and now more closely resembles the typical target-date fund. The glide path is notably steeper than other target-date funds, though. This is most apparent in the “kink” in the TSP L Fund‘s equity asset-allocation glide path, when TSP L 2030 Fund begins a relatively steep path to a lower asset allocation; as of October 2024, TSP L 2030 Fund’s 60.1% of assets allocated to equities was almost double that of TSP L 2025 Fund’s 30.4% allocation. Rapidly moving out of equities courts timing risk, including the risk of selling out of stocks as markets are dropping and when account balances are at or near their highs.
The available TSP L Fund target-date funds include the following (age guidelines based on current year of 2024 and target retirement age of 62):
- TSP L Income: For investors already retired and/or 63 years and older
- TSP L 2025: For investors about 59 to 63 years
- TSP L 2030: For investors about 54 to 58 years
- TSP L 2035: For investors about 49 to 53 years
- TSP L 2040: For investors about 44 to 48 years
- TSP L 2045: For investors about 39 to 43 years
- TSP L 2050: For investors about 34 to 38 years
- TSP L 2055: For investors about 29 to 33 years
- TSP L 2060: For investors about 24 to 28 years
- TSP L 2065: For investors about 19 to 23 years
- TSP L 2070: For investors 18 years and younger
TSP L Income Fund
- Intended Investor: Those already retired and/or 63 years and older
- Morningstar Index: Morningstar Lifetime Moderate Income Index
- Morningstar Category: US Fund Target-Date Retirement
TSP L Income Fund’s relatively low equity allocation and considerable TSP G Fund allocation are defining features that have shaped the fund’s short- and longer-term relative results. In recent periods, strong equity markets have caused TSP L Income Fund to fall behind its target-date retirement Morningstar Category peers; in the past year through October 2024, for example, the fund’s 11.5% gain trailed the category average’s 16.2% return by 4.7 percentage points.
The fund‘s hefty investment in TSP G Fund, which stood at more than two thirds of the portfolio in October 2024, was an enormous help in years of rising interest rates, like 2022. That year, TSP F Fund, which tracks the broad market Bloomberg US Aggregate Bond Index, lost 12.8%; in contrast, TSP G Fund gained 3.0%. Most target-date funds have fixed-income allocations that more closely resemble TSP F Fund rather than TSP G Fund. As a result, in 2022, the typical category peer lost 12.7% while TSP L Income Fund lost a comparably more bearable 2.7%. Over the last decade through October 2024, TSP L Income Fund’s 4.3% annualized gain beat the category average by 45 basis points.
TSP L Income Fund Annualized Returns Through Oct. 31, 2024

TSP L 2025 Fund
- Intended Investor: Those planning to retire close to 2025 and about 59 to 63 years old
- Morningstar Index: Morningstar Lifetime Moderate 2025 Index
- Morningstar Category: US Fund Target-Date 2025
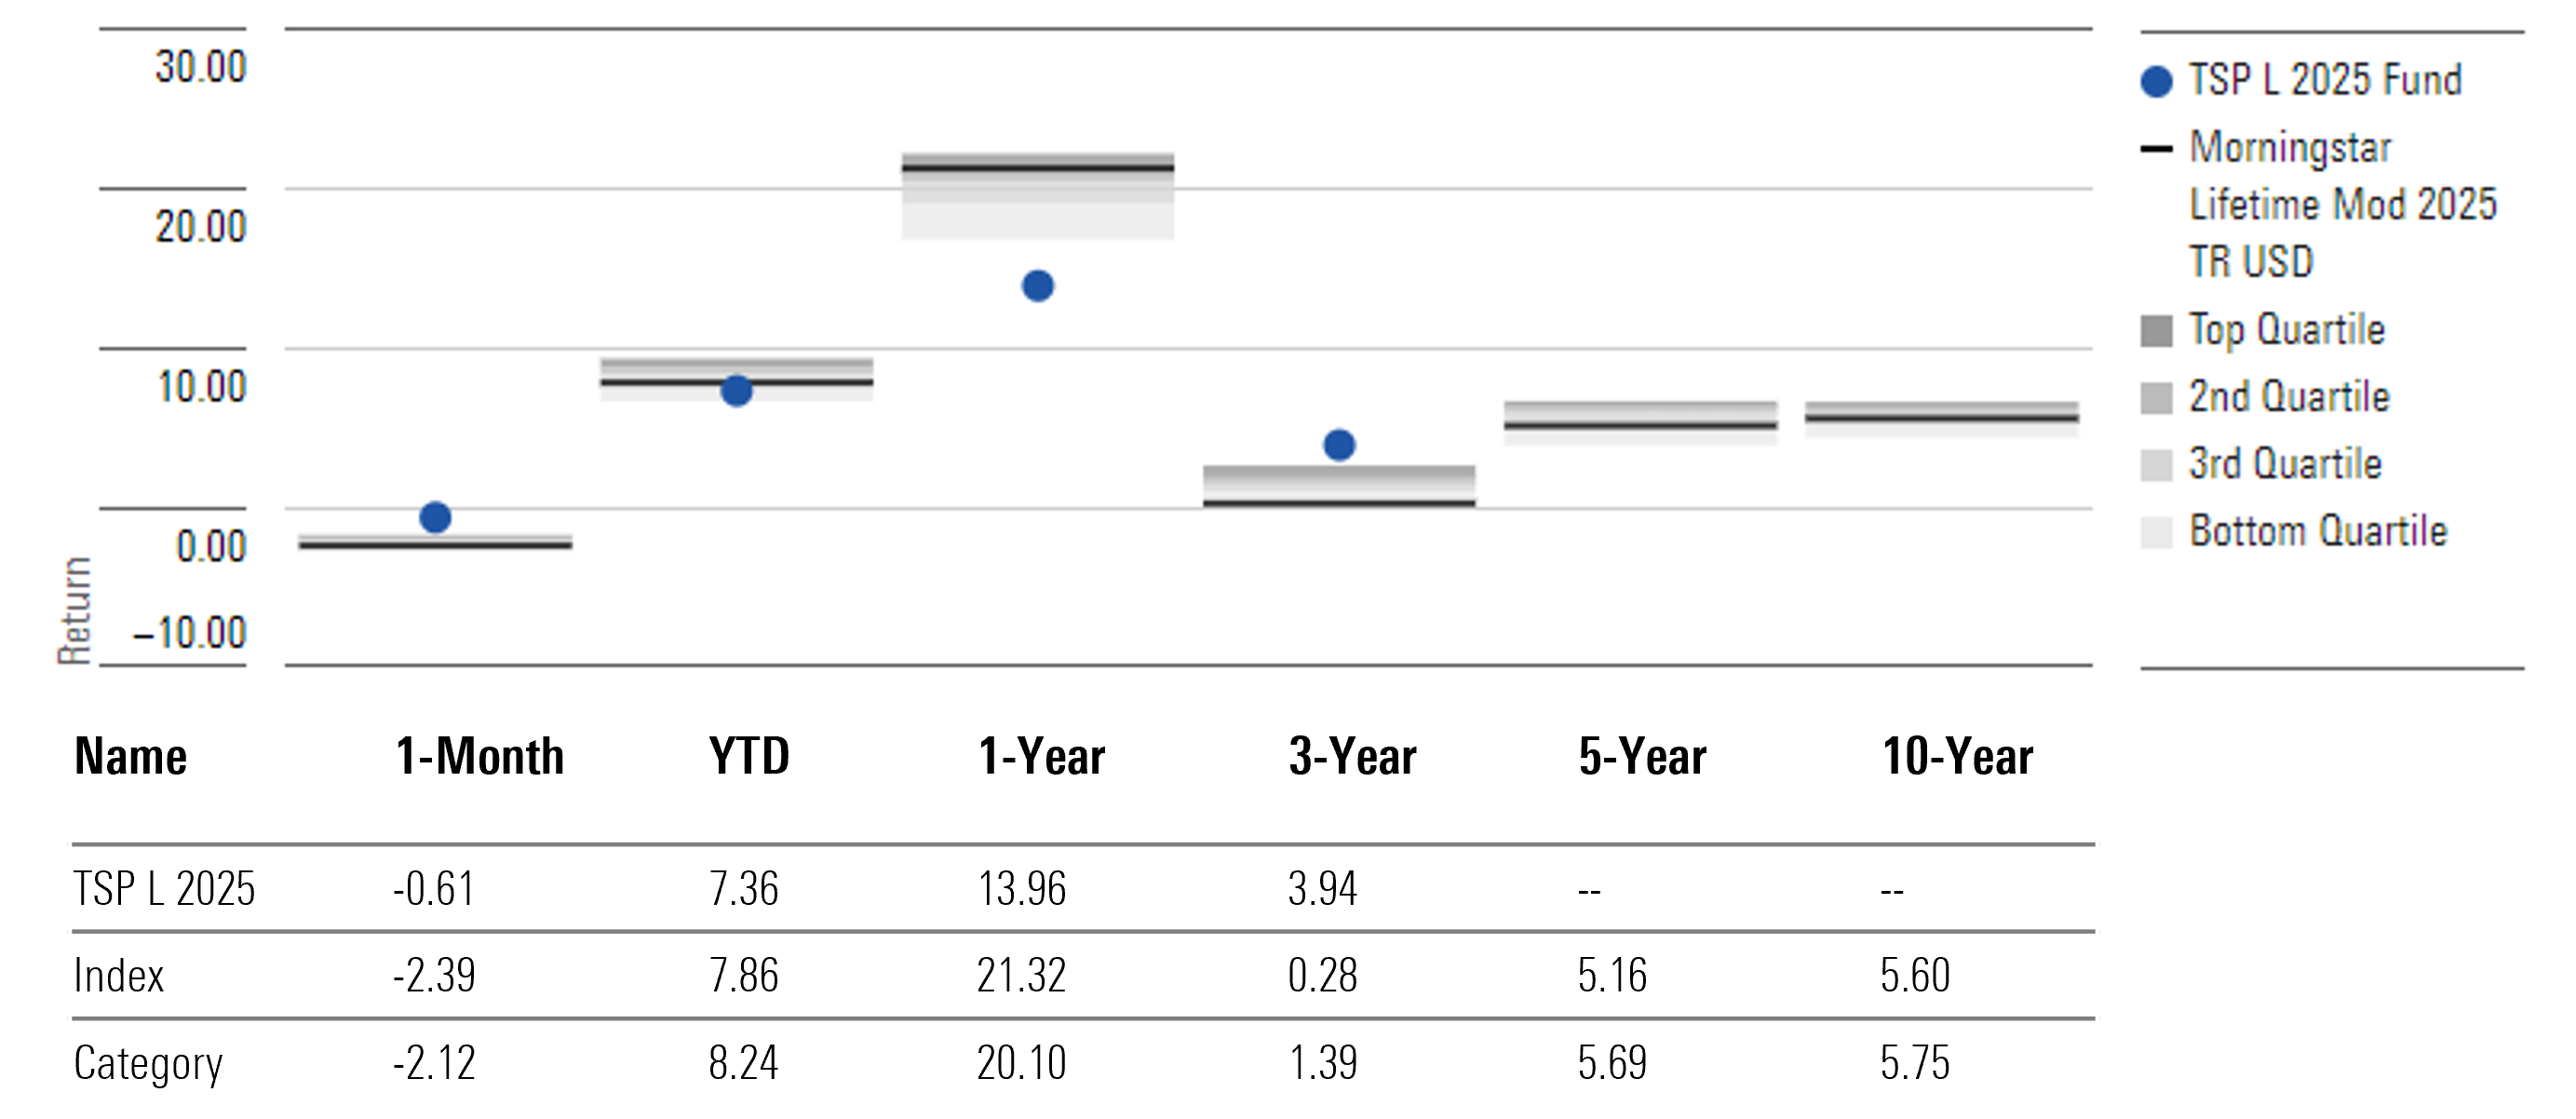
Since TSP L 2025 Fund’s July 2020 inception through October 2024, its 7.4% annualized gain comes out comfortably ahead of the target-date 2025 Morningstar Category average return of 6.0%. The fund’s hefty allocation to TSP G Fund—it comprised 63.9% of assets as of October 2024—proved a boon during a period when fixed-income markets generally lost money.
The TSP L Funds reach their final equity allocation landing point at the fund’s target year. As a result, assets in the TSP L 2025 Fund will automatically roll into TSP L Income Fund in July 2025.
TSP L 2025 Fund Annualized Returns Through Oct. 31, 2024
TSP L 2030 Fund
- Intended Investor: Those planning to retire close to 2030 and about 54 to 58 years old
- Morningstar Index: Morningstar Lifetime Moderate 2030 Index
- Morningstar Category: US Fund Target-Date 2030
TSP L 2030 Fund appears as a “kink” in the TSP L Fund‘s equity asset-allocation glide path, currently marking the point at which the funds begin a relatively steep path to a lower asset allocation; as of October 2024, TSP L 2030 Fund’s 60.1% of assets allocated to equities was almost double that of TSP L 2025 Fund’s 30.4% allocation. Rapidly moving out of equities courts timing risk, including the risk of selling out of stocks as markets are dropping and when account balances are at or near their highs.
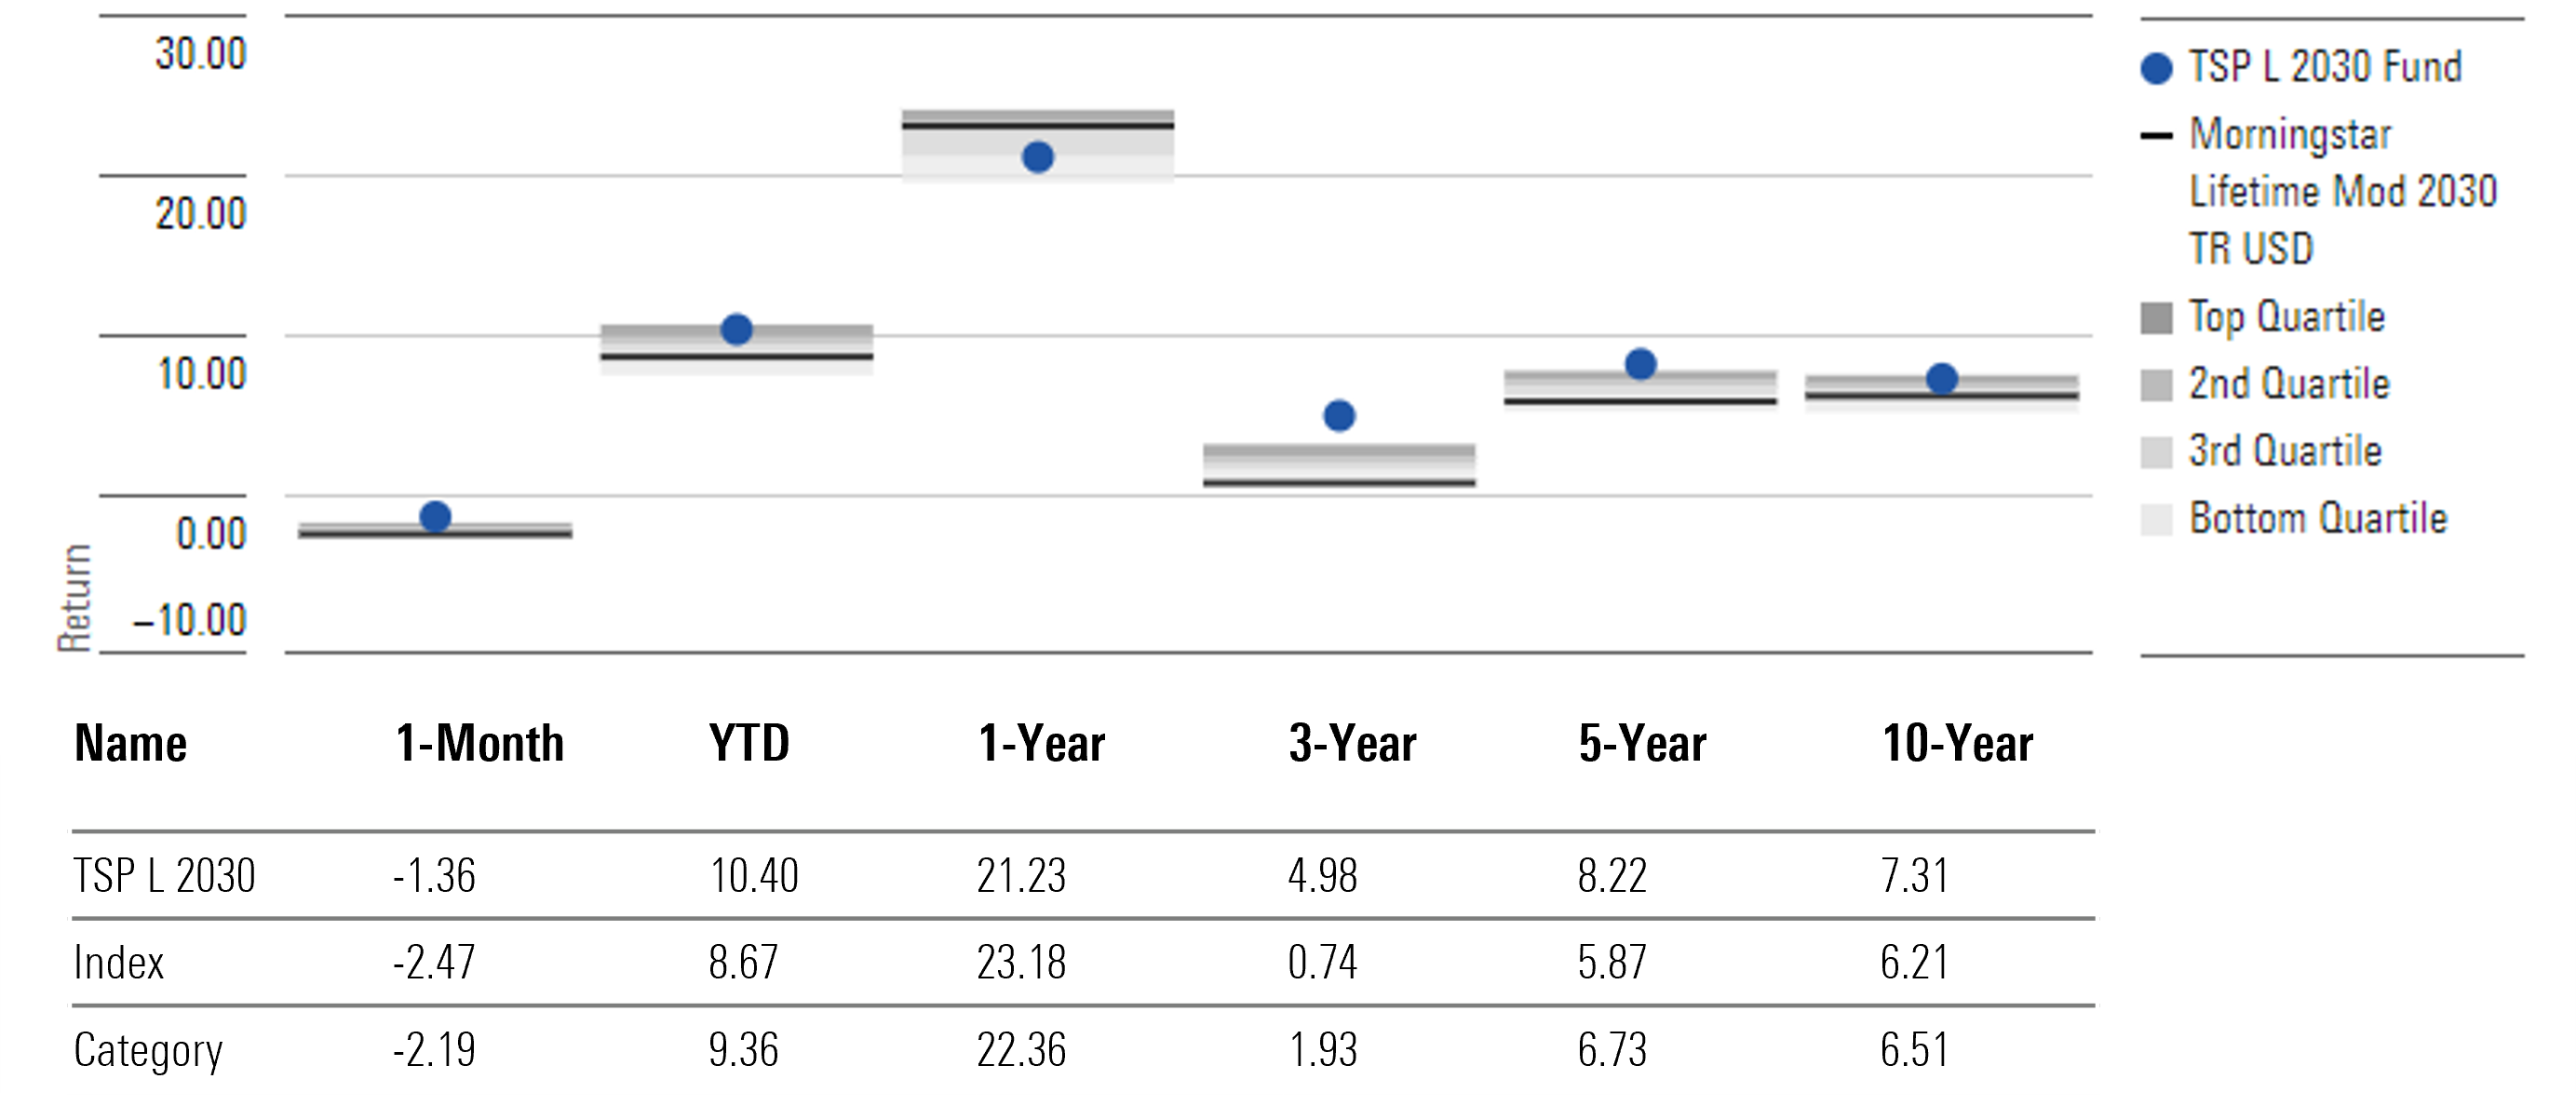
The “kink,” though, has also resulted in a greater weight to stocks compared with its target-date 2030 Morningstar Category peers, which averaged a 50.2% allocation. This has helped the fund’s 10-year annualized gain of 7.3% come out ahead of the category average’s 6.5% gain.
TSP L 2030 Fund Annualized Returns Through Oct. 31, 2024
TSP L 2035 Fund
- Intended Investor: Those planning to retire close to 2035 and about 49 to 53 years old
- Morningstar Index: Morningstar Lifetime Moderate 2035 Index
- Morningstar Category: US Fund Target-Date 2035
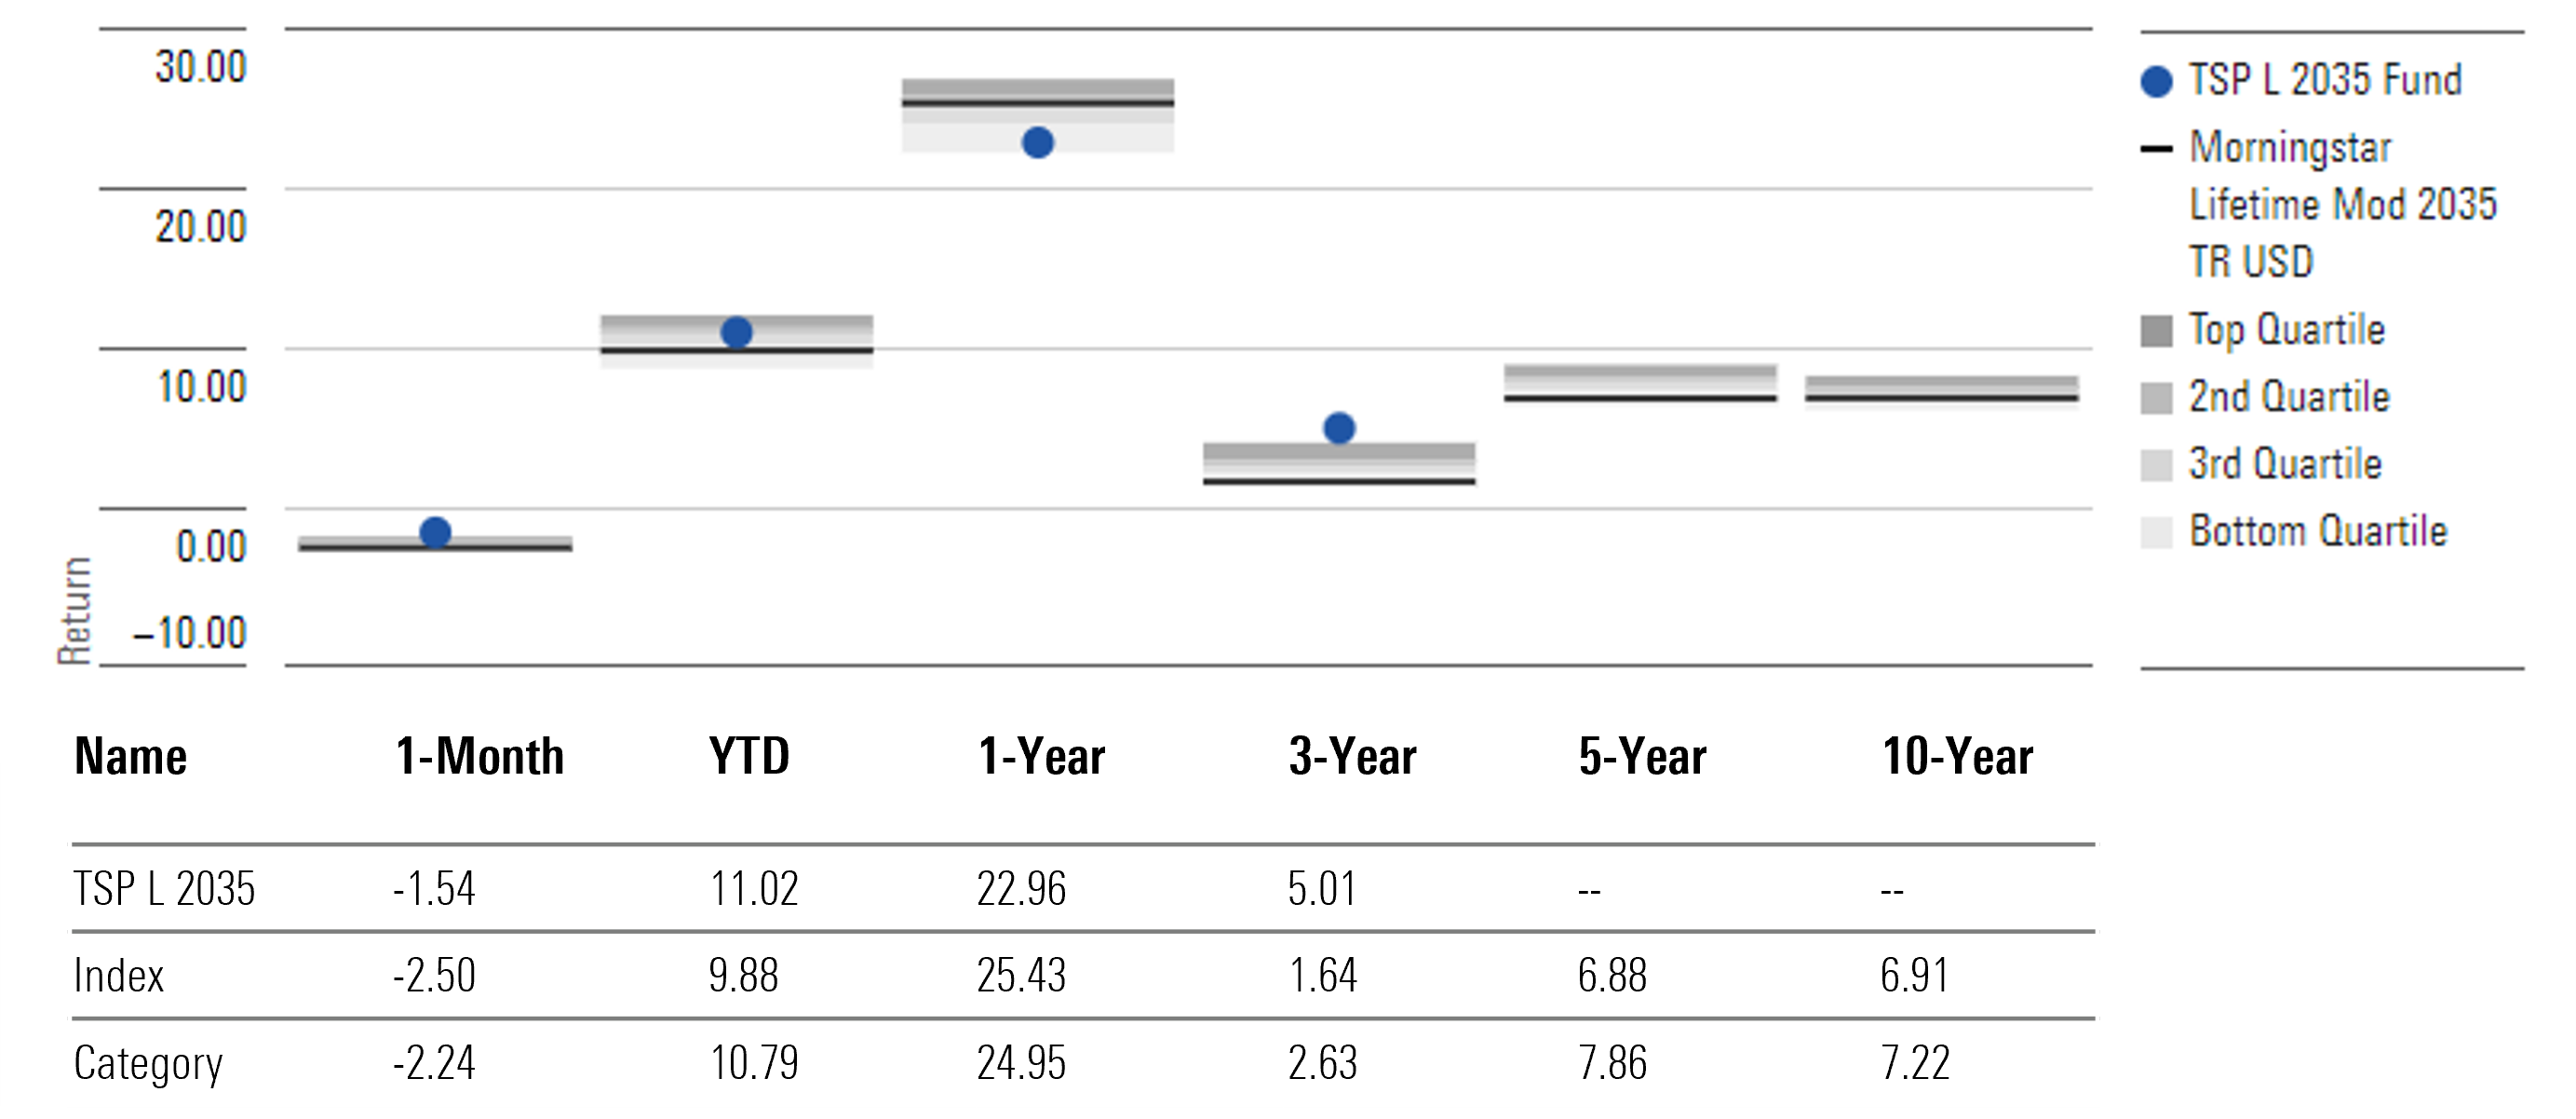
Since TSP L 2035 Fund’s July 2020 inception through October 2024, its 9.9% annualized gain was almost 1.2 percentage points greater than the target-date 2035 Morningstar Category average. The fund’s equity allocation of 65.9% as of October 2024 is higher than the category average allocation of 59.4%. The healthier equity allocation and the fund’s TSP G Fund allocation (27.4% as of October 2024) both aided results.
TSP L 2035 Fund Annualized Returns Through Oct. 31, 2024
TSP L 2040 Fund
- Intended Investor: Those planning to retire close to 2040 and about 44 to 48 years old
- Morningstar Index: Morningstar Lifetime Moderate 2040 Index
- Morningstar Category: US Fund Target-Date 2040
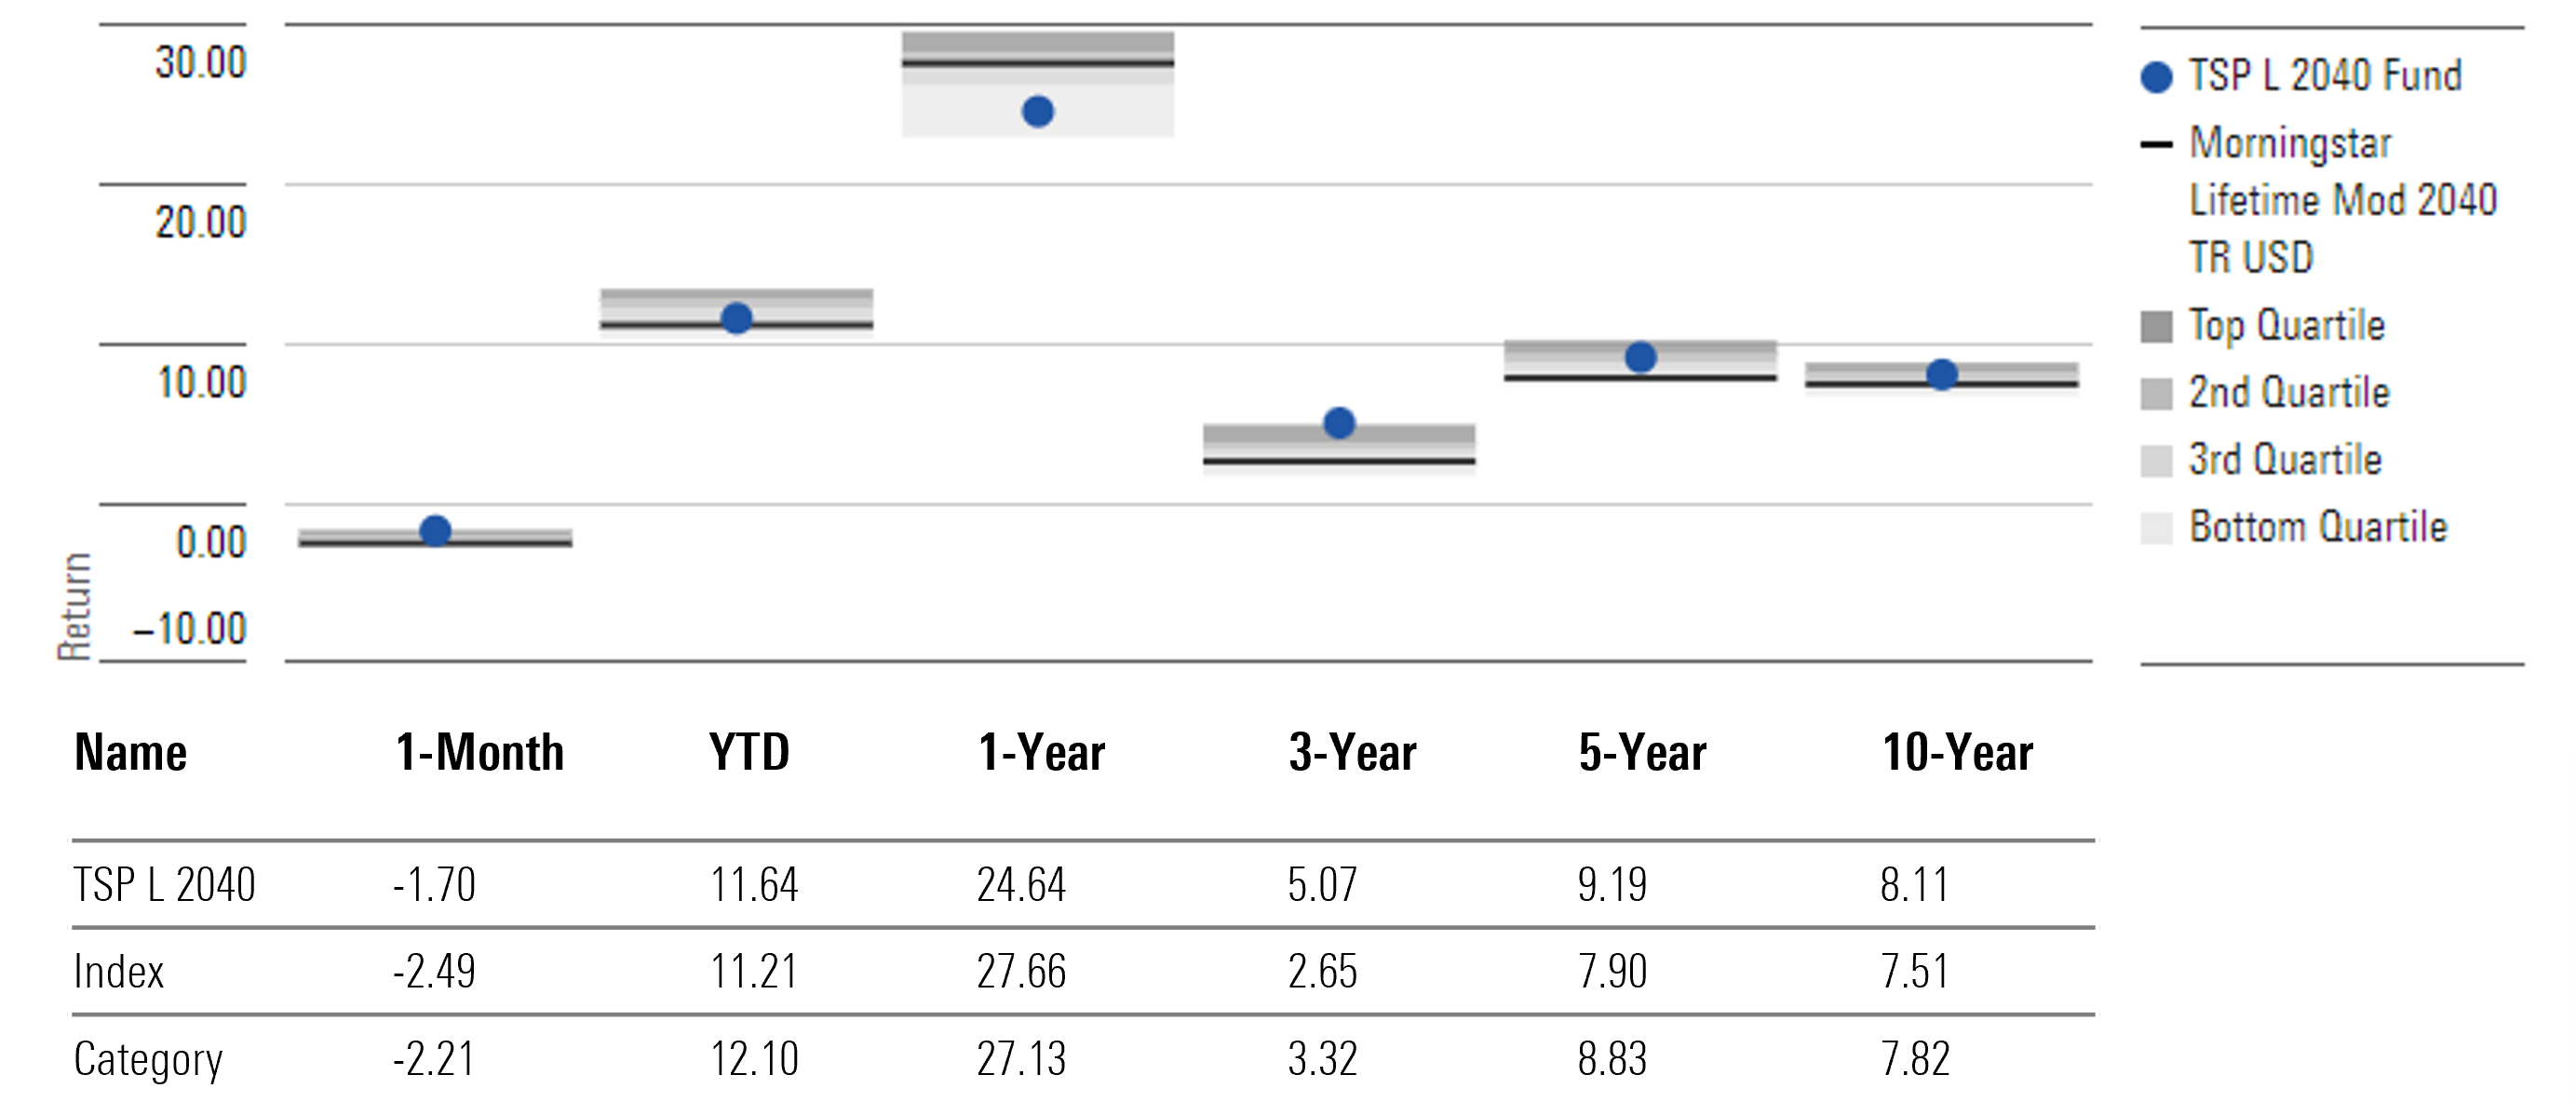
TSP L 2040 Fund’s 71.8% stock allocation as of October 2024 is about even with the target-date 2040 Morningstar Category average of 70.8%. Its bond sleeve, though, stands out for its large allocation to TSP G Fund, at 21.2% of the portfolio. TSP G Fund has delivered a reliable stream of positive gains year in and year out. This pattern held in 2022, when TSP G Fund gained 3.0% even as rising interest rates caused TSP F Fund to lose 12.8%. It applied in 2021, when TSP F Fund lost 1.5% and TSP G Fund gained 1.4%, representing 2.9 percentage points in outperformance for the latter. That’s helped TSP L 2040 keep ahead of peers over the decade through October 2024, when TSP L 2040 Fund’s 8.1% annualized return was about 30 basis points greater than its typical target-date 2040 peer.
TSP L 2040 Fund Annualized Returns Through Oct. 31, 2024
TSP L 2045 Fund
- Intended Investor: Those planning to retire close to 2045 and about 39 to 43 years old
- Morningstar Index: Morningstar Lifetime Moderate 2045 Index
- Morningstar Category: US Fund Target-Date 2045
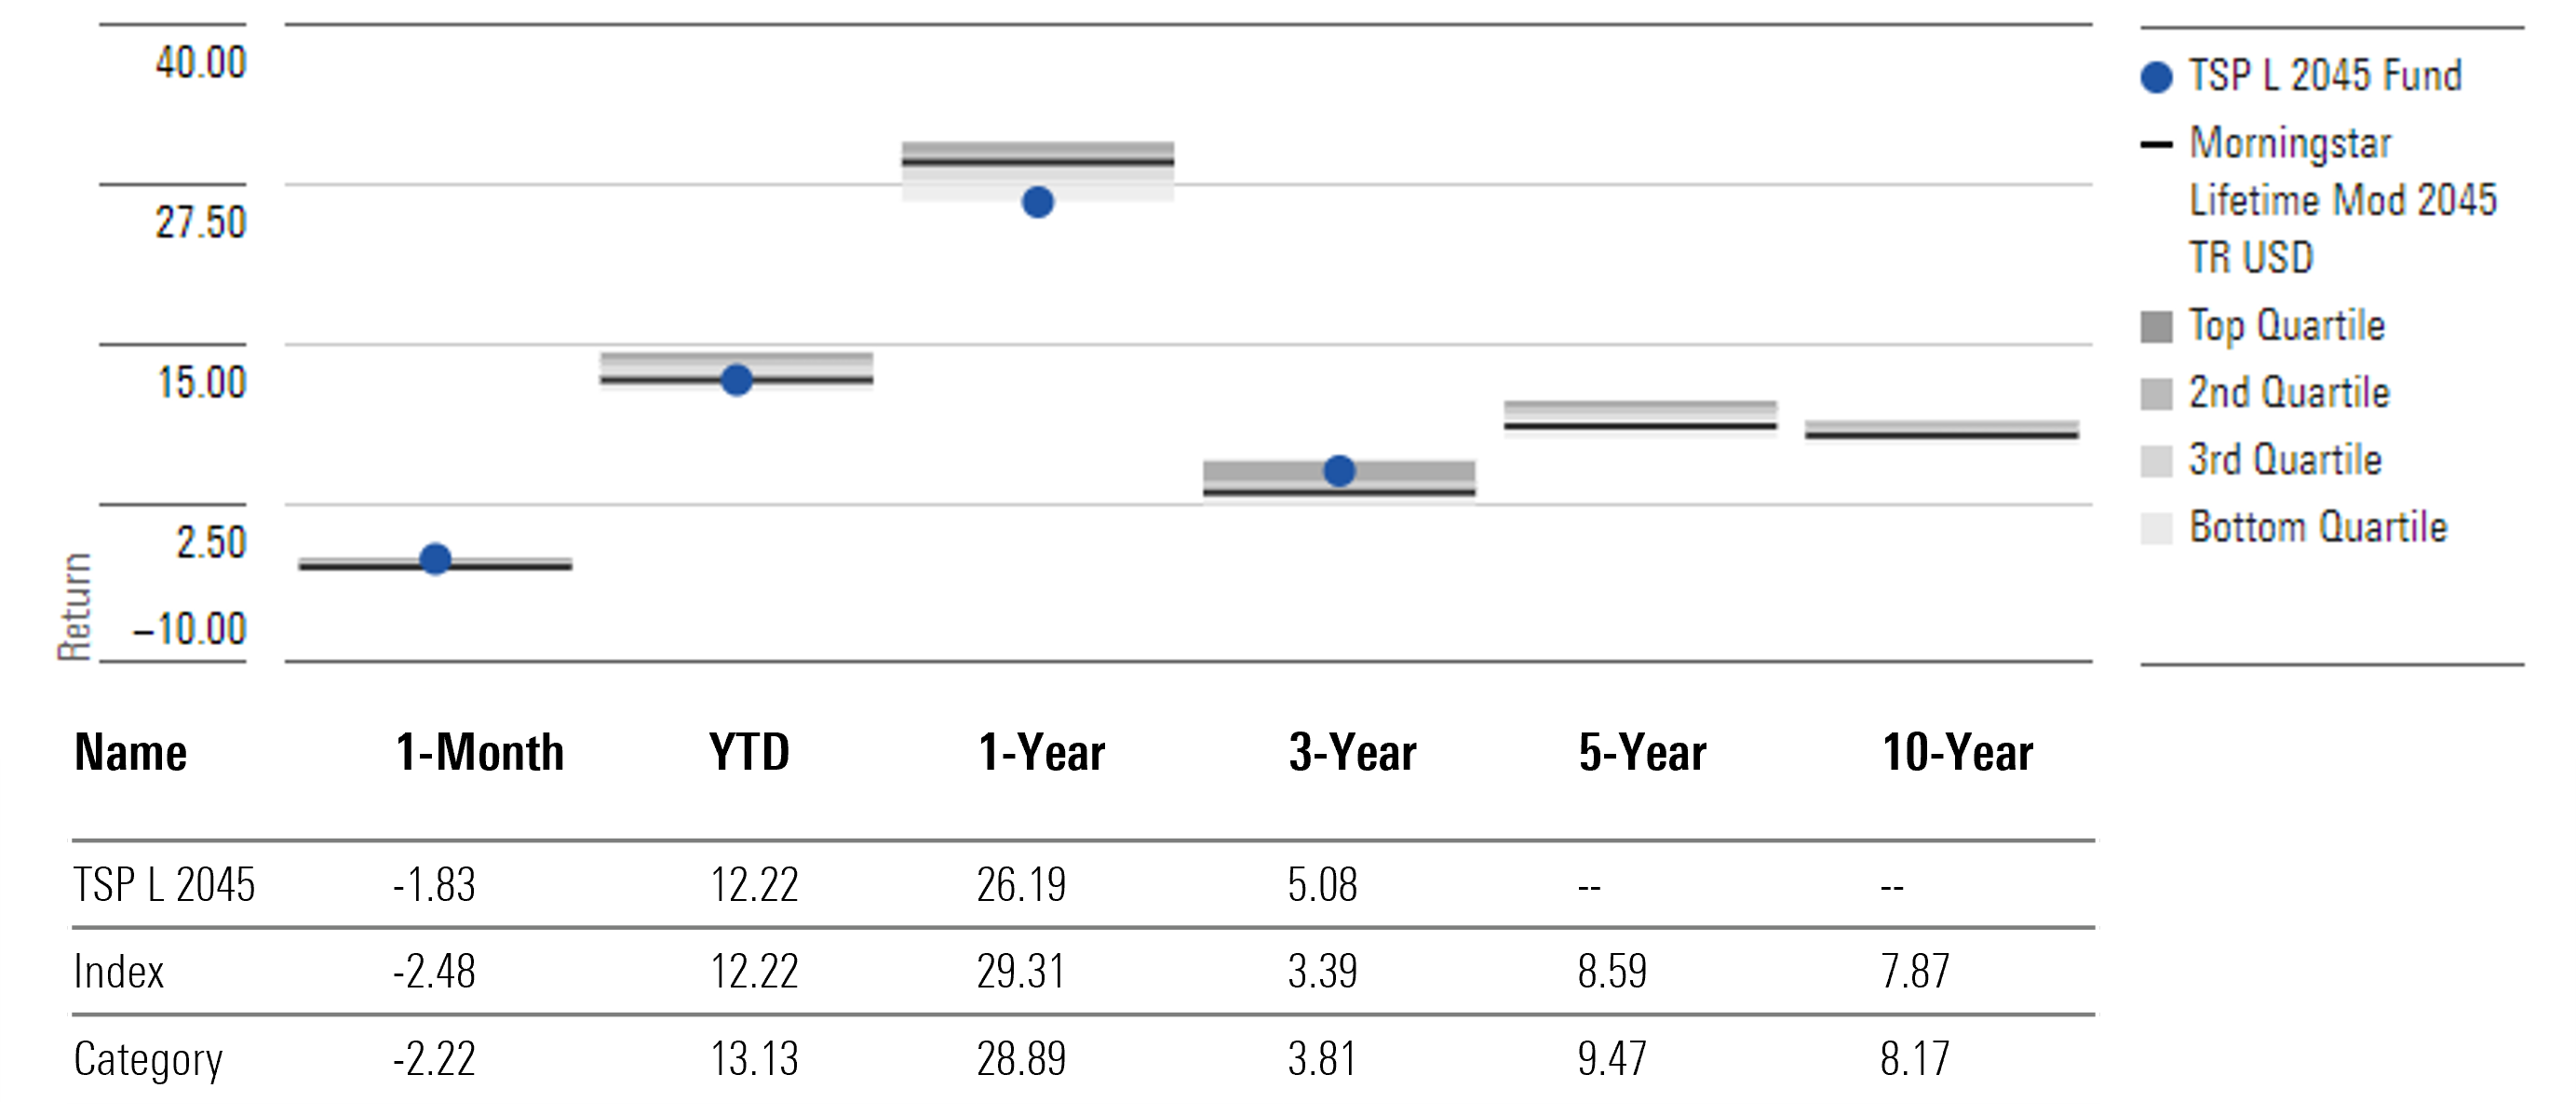
Since TSP L 2045 Fund’s July 2020 inception through October 2024, its 11.0% annualized gain was slightly ahead of the target-date 2045 Morningstar Category average of 10.9%. The fund’s 76.8% stock sleeve of October 2024 is somewhat lower than the category average’s 78.8% weight. While TSP L 2045 Fund’s lower equity allocation was a headwind to returns, lower relative allocations to non-US stocks and the fund’s TSP G Fund allocation (15.9% as of October 2024) helped to keep the fund ahead of the competition.
TSP L 2045 Fund Annualized Returns Through Oct. 31, 2024
TSP L 2050 Fund
- Intended Investor: Those planning to retire close to 2050 and about 34 to 38 years old
- Morningstar Index: Morningstar Lifetime Moderate 2050 Index
- Morningstar Category: US Fund Target-Date 2050
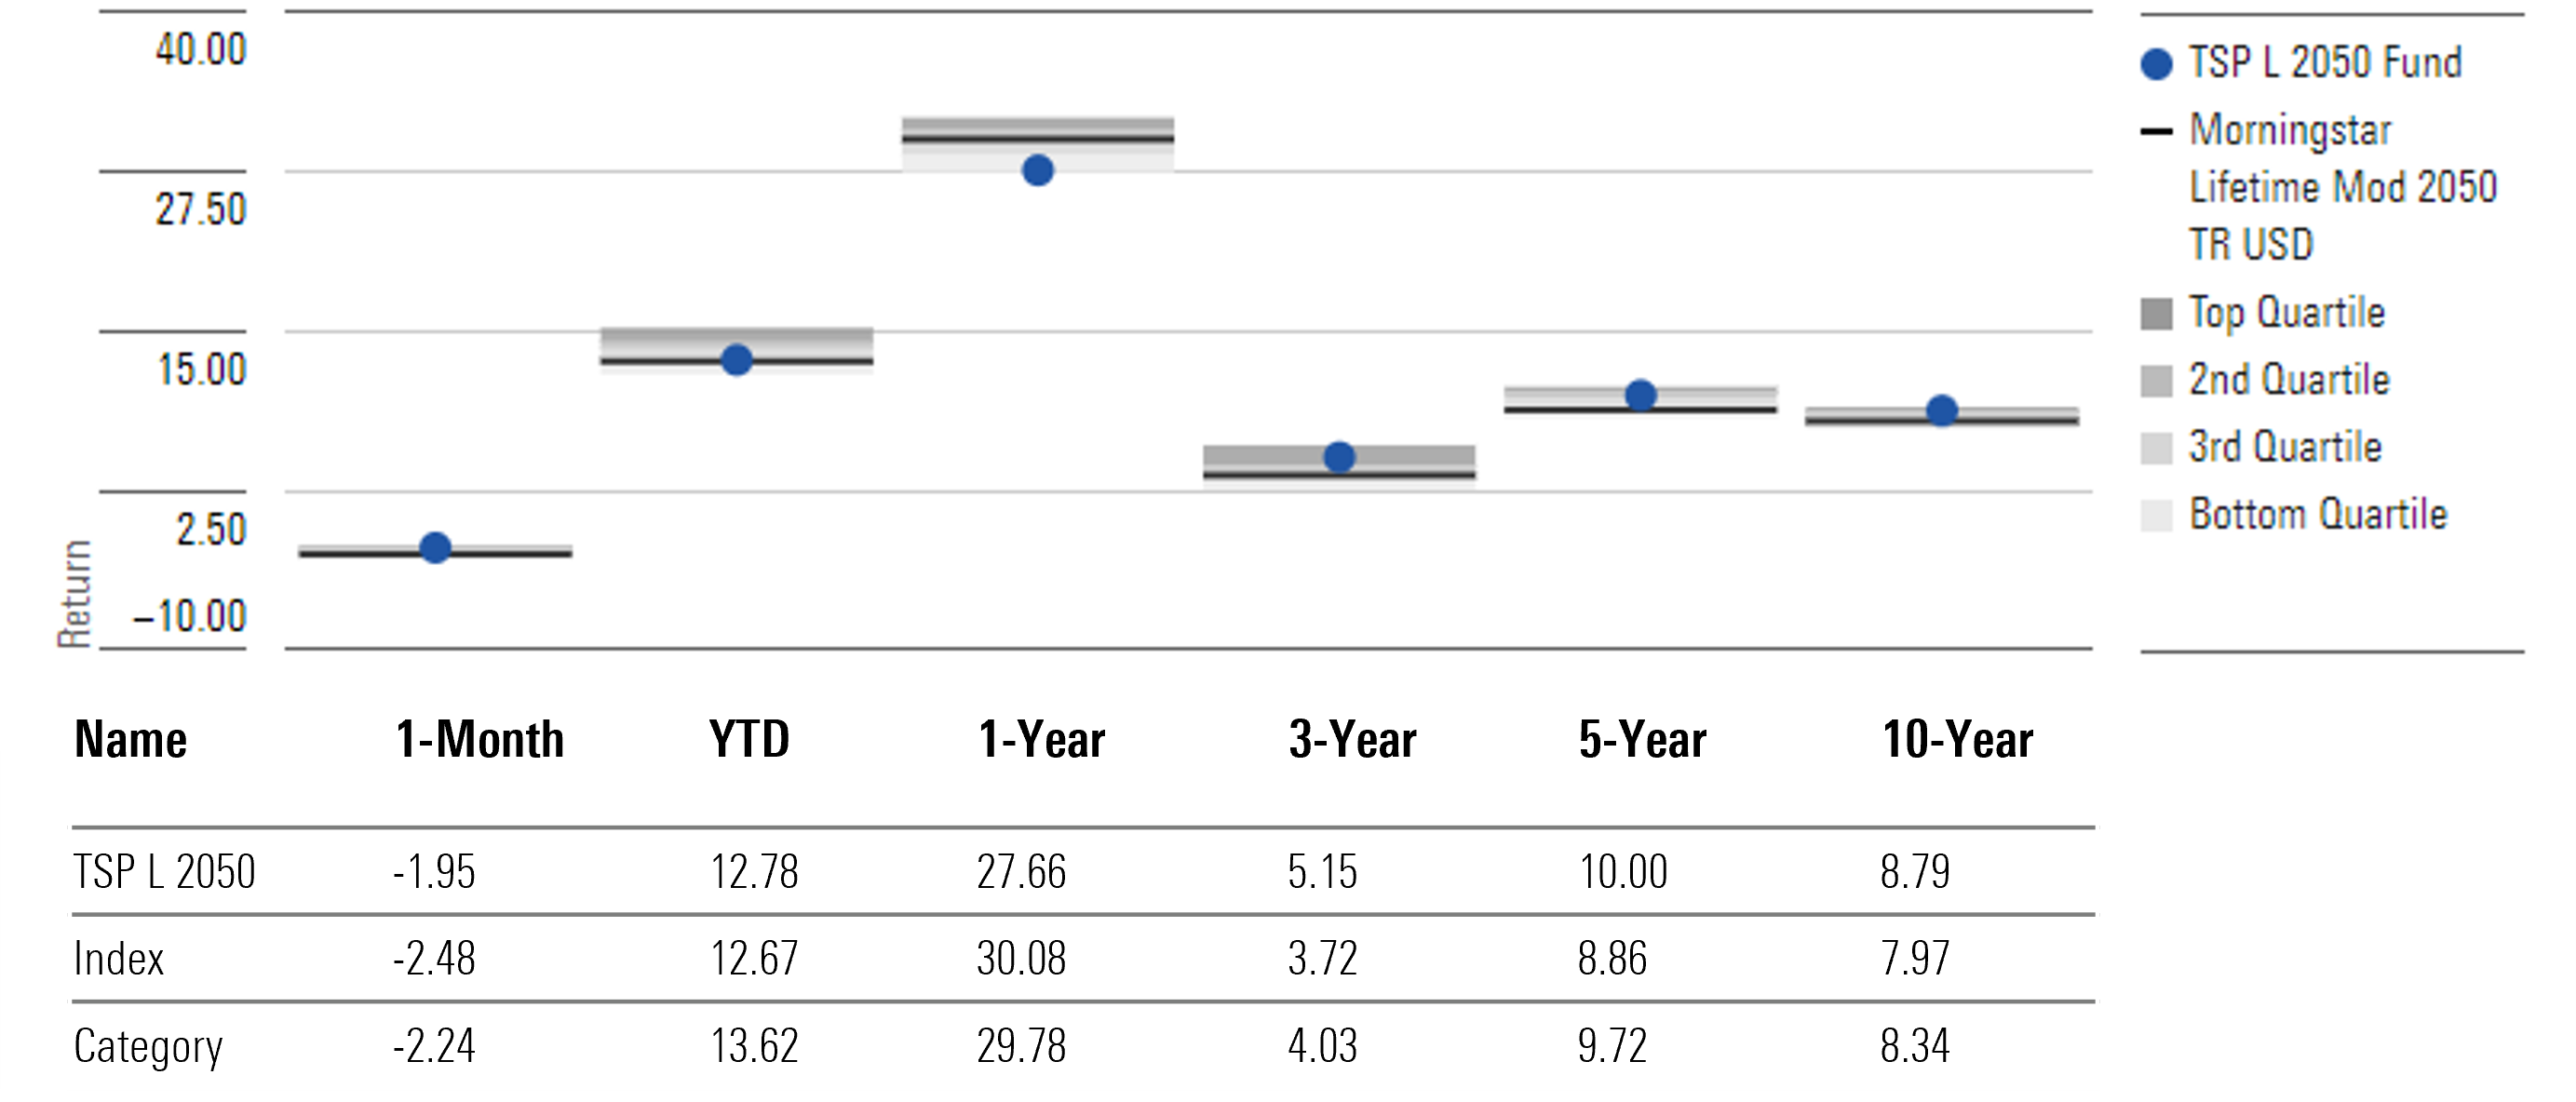
TSP L 2050 Fund’s 82% stock allocation as of October 2024 is about even with the target-date 2050 Morningstar Category average of 83%. Its bond sleeve, though stands out for its large allocation to TSP G Fund, at 11.1% of the portfolio. TSP G Fund has delivered a reliable stream of positive gains year in and year out. This pattern held in 2022, when TSP G Fund gained 3.0% even as rising interest rates caused TSP F Fund to lose 12.8%. It applied in 2021, when TSP F Fund lost 1.5% and TSP G Fund gained 1.4%, representing 2.9 percentage points in outperformance for the latter. That’s helped TSP L 2050 keep ahead of peers over the decade through October 2024, when TSP L 2040 Fund’s 8.8% annualized return was 45 basis points greater than its typical target-date 2050 peer.
TSP L 2050 Fund Annualized Returns Through Oct. 31, 2024
TSP L 2055 Fund
- Intended Investor: Those planning to retire close to 2055 and about 29 to 33 years old
- Morningstar Index: Morningstar Lifetime Moderate 2055 Index
- Morningstar Category: US Fund Target-Date 2055
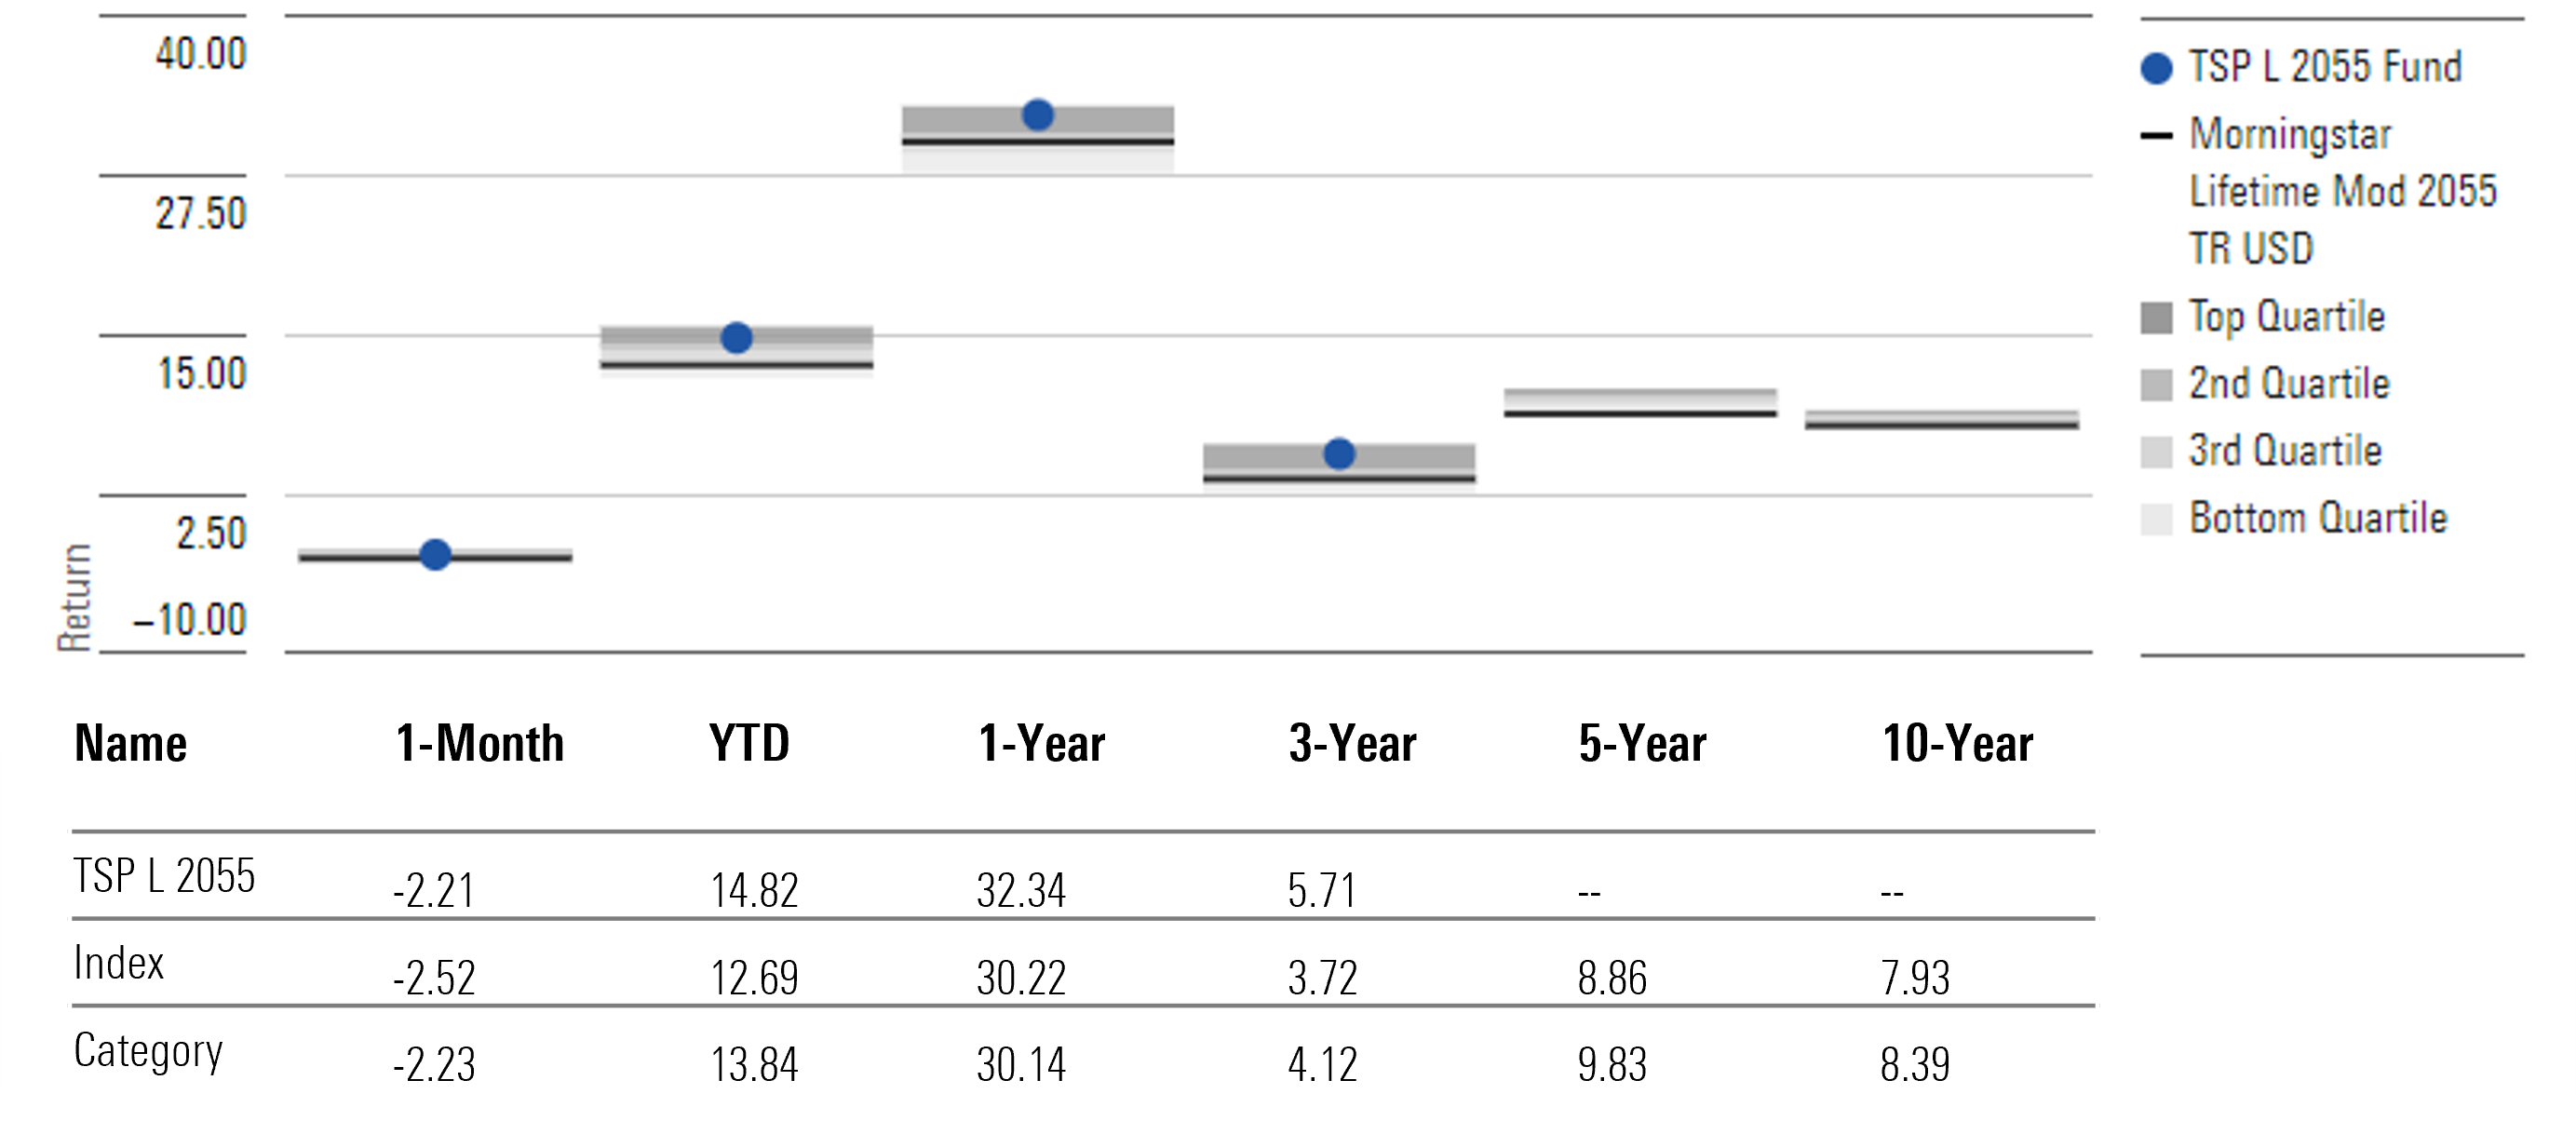
Since TSP L 2055 Fund’s July 2020 inception through October 2024, its 13.6% annualized return comfortably beat the target-date 2055 Morningstar Category average of 11.5% by 2.1 percentage points. The fund’s 99.0% stock sleeve as of October 2024 is about 17 percentage points greater than the category average’s 82.1% weight. That large differential helped supercharge this fund’s strong showing.
TSP L 2055 Fund Annualized Returns Through Oct. 31, 2024
TSP L 2060 Fund
- Intended Investor: Those planning to retire close to 2060 and about 24 to 28 years old
- Morningstar Index: Morningstar Lifetime Moderate 2060 Index
- Morningstar Category: US Fund Target-Date 2060
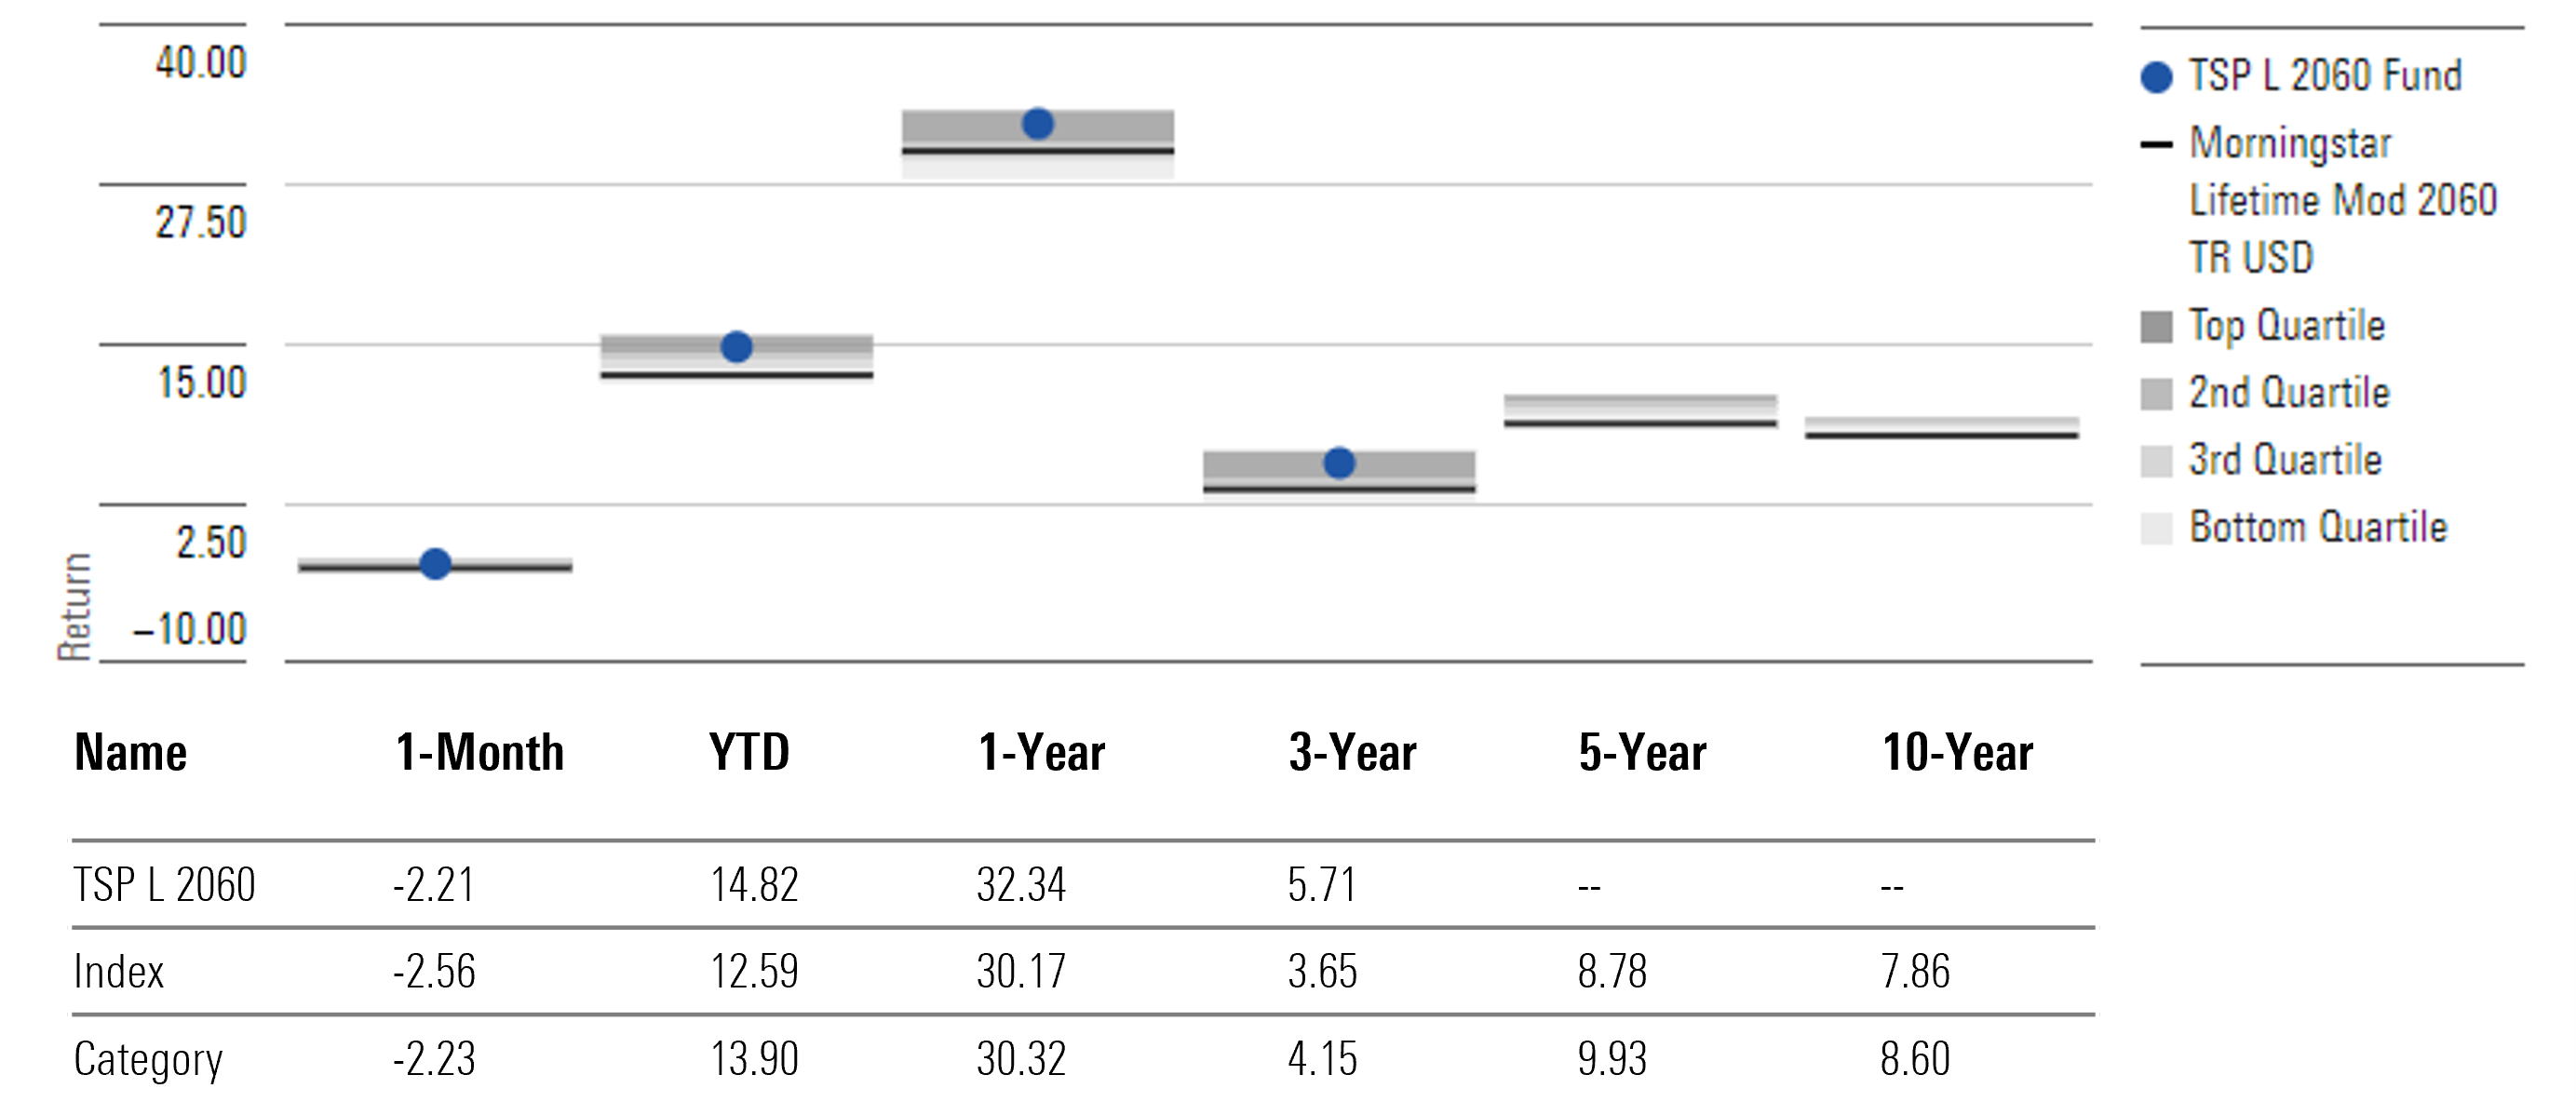
As a longer-dated fund meant for younger investors, TSP L 2060 Fund was launched relatively recently in July 2020, so its track record is short. Since TSP L 2060’s inception through October 2024, its 13.6% annualized gain soundly beat the target-date 2060 Morningstar Category average’s 11.6% return. The fund’s 99% stock allocation as of October 2024 puts it near the top end of the peer group, which averages 84% in stocks. A heavier allocation to stocks has been a boon to results.
TSP L 2060 Fund Annualized Returns Through Oct. 31, 2024
TSP L 2065 Fund
- Intended Investor: Those planning to retire close to 2065 and about 19 to 23 years old
- Morningstar Index: Morningstar Lifetime Moderate 2065 Index
- Morningstar Category: US Fund Target-Date 2065+
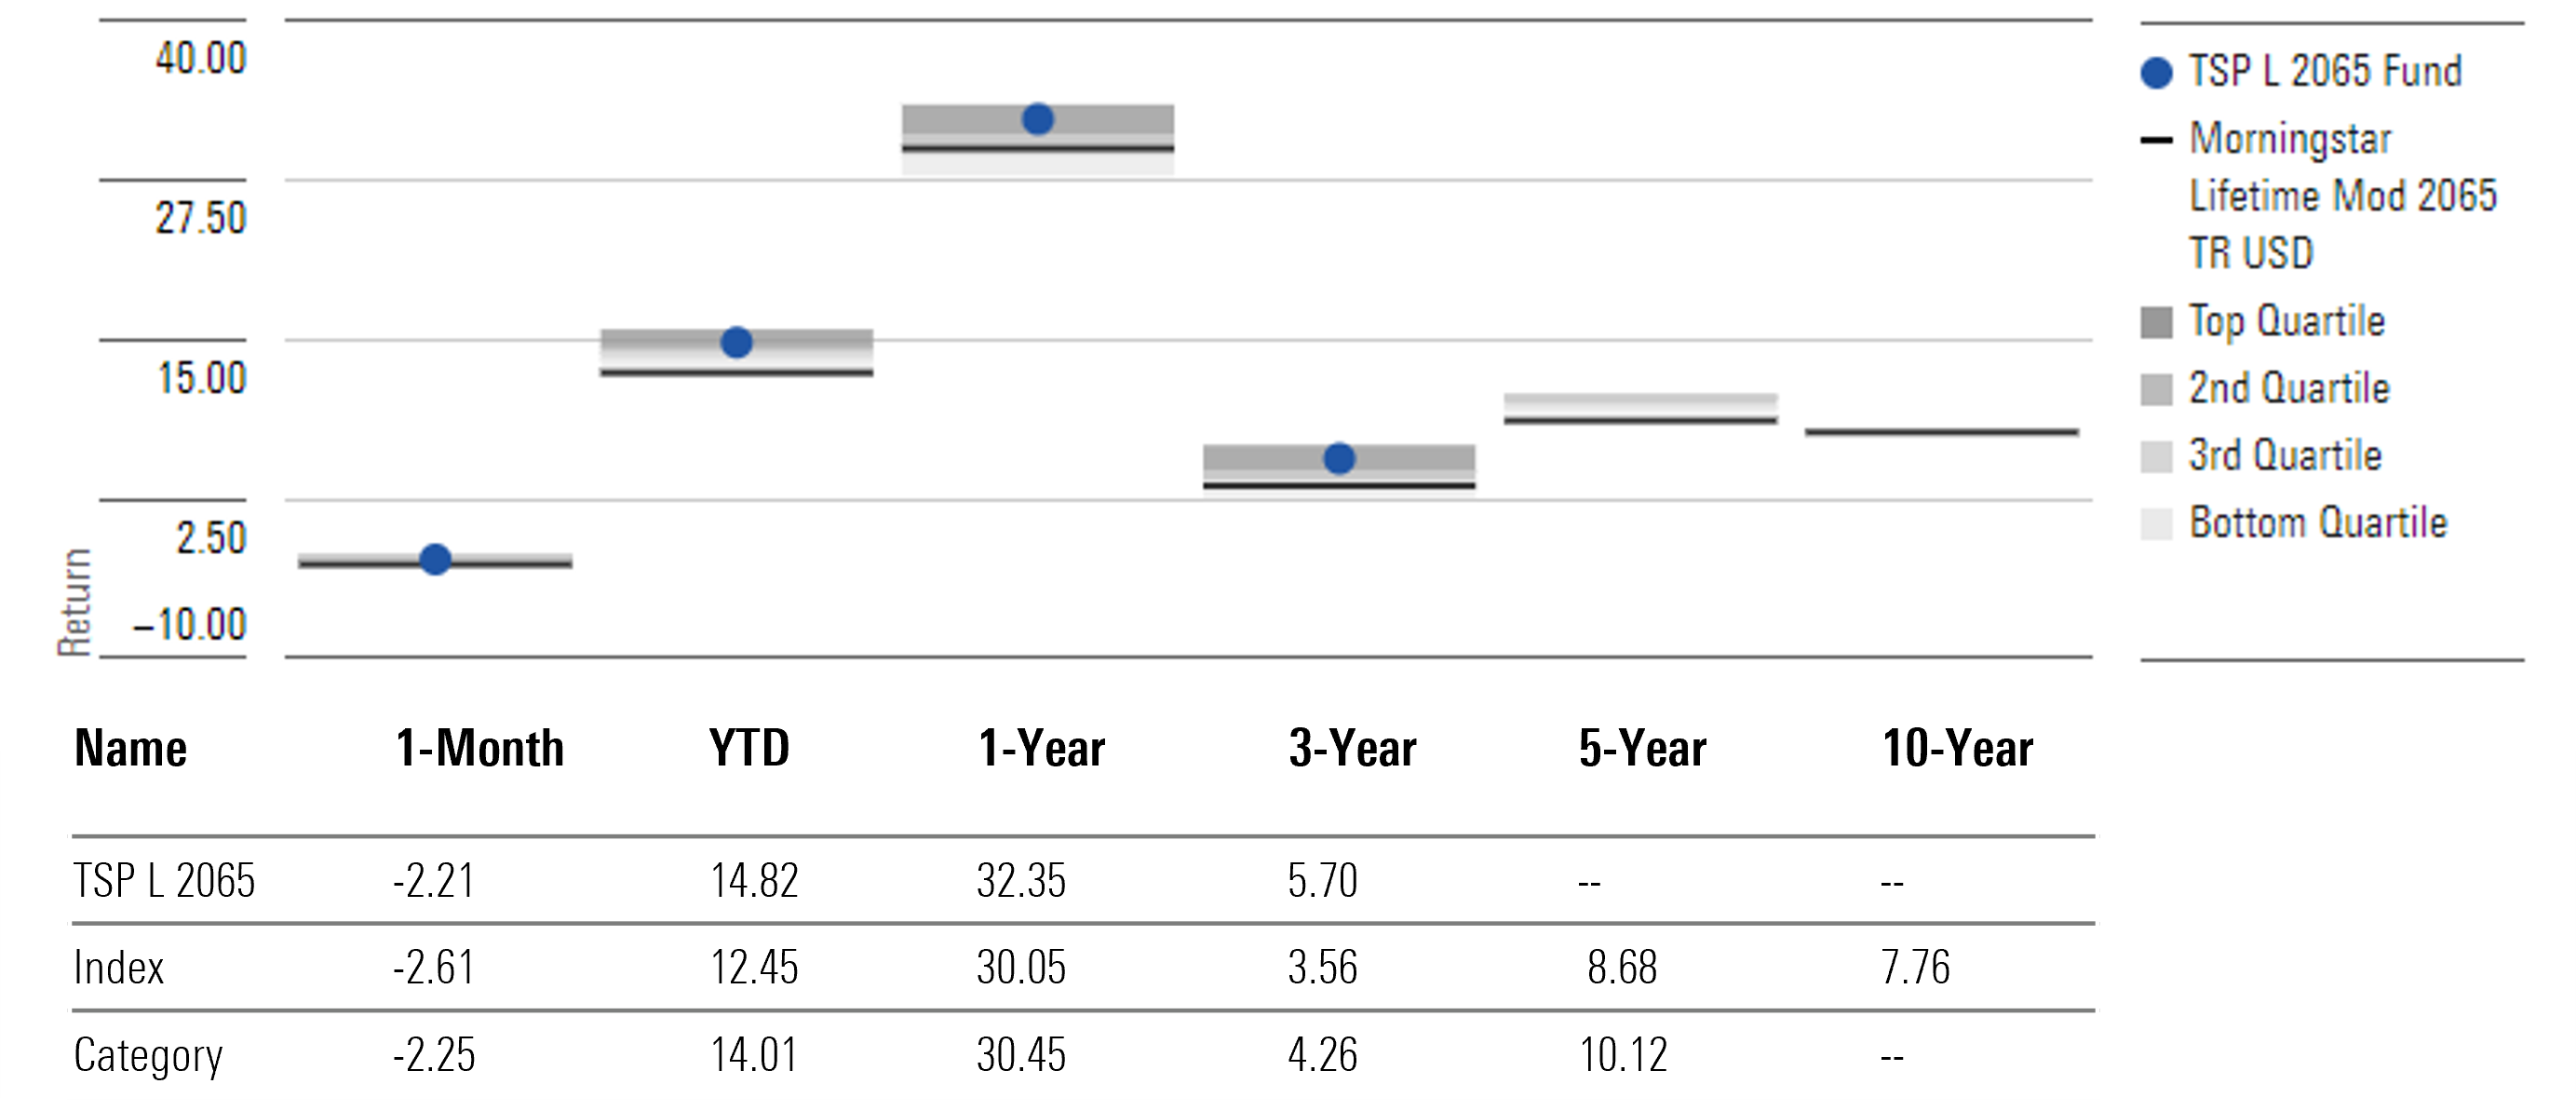
As a longer-dated fund meant for younger investors, TSP L 2065 Fund was launched relatively recently in July 2020, so its track record is short. Since TSP L 2065’s inception through October 2024, its 13.6% annualized return comfortably beat the target-date 2065+ Morningstar Category average of 11.8% by about 1.8 percentage points. The fund’s 99.0% stock sleeve is more than 20 percentage points greater than the category average’s 78.2% weight. That large differential helped supercharge the fund’s strong showing.
TSP L 2065 Fund Annualized Returns Through Oct. 31, 2024
TSP L 2070 Fund
- Intended Investor: Those planning to retire close to 2070 or later and 18 or younger
- Morningstar Index: Morningstar Lifetime Moderate 2065 Index
- Morningstar Category: US Fund Target-Date 2065+
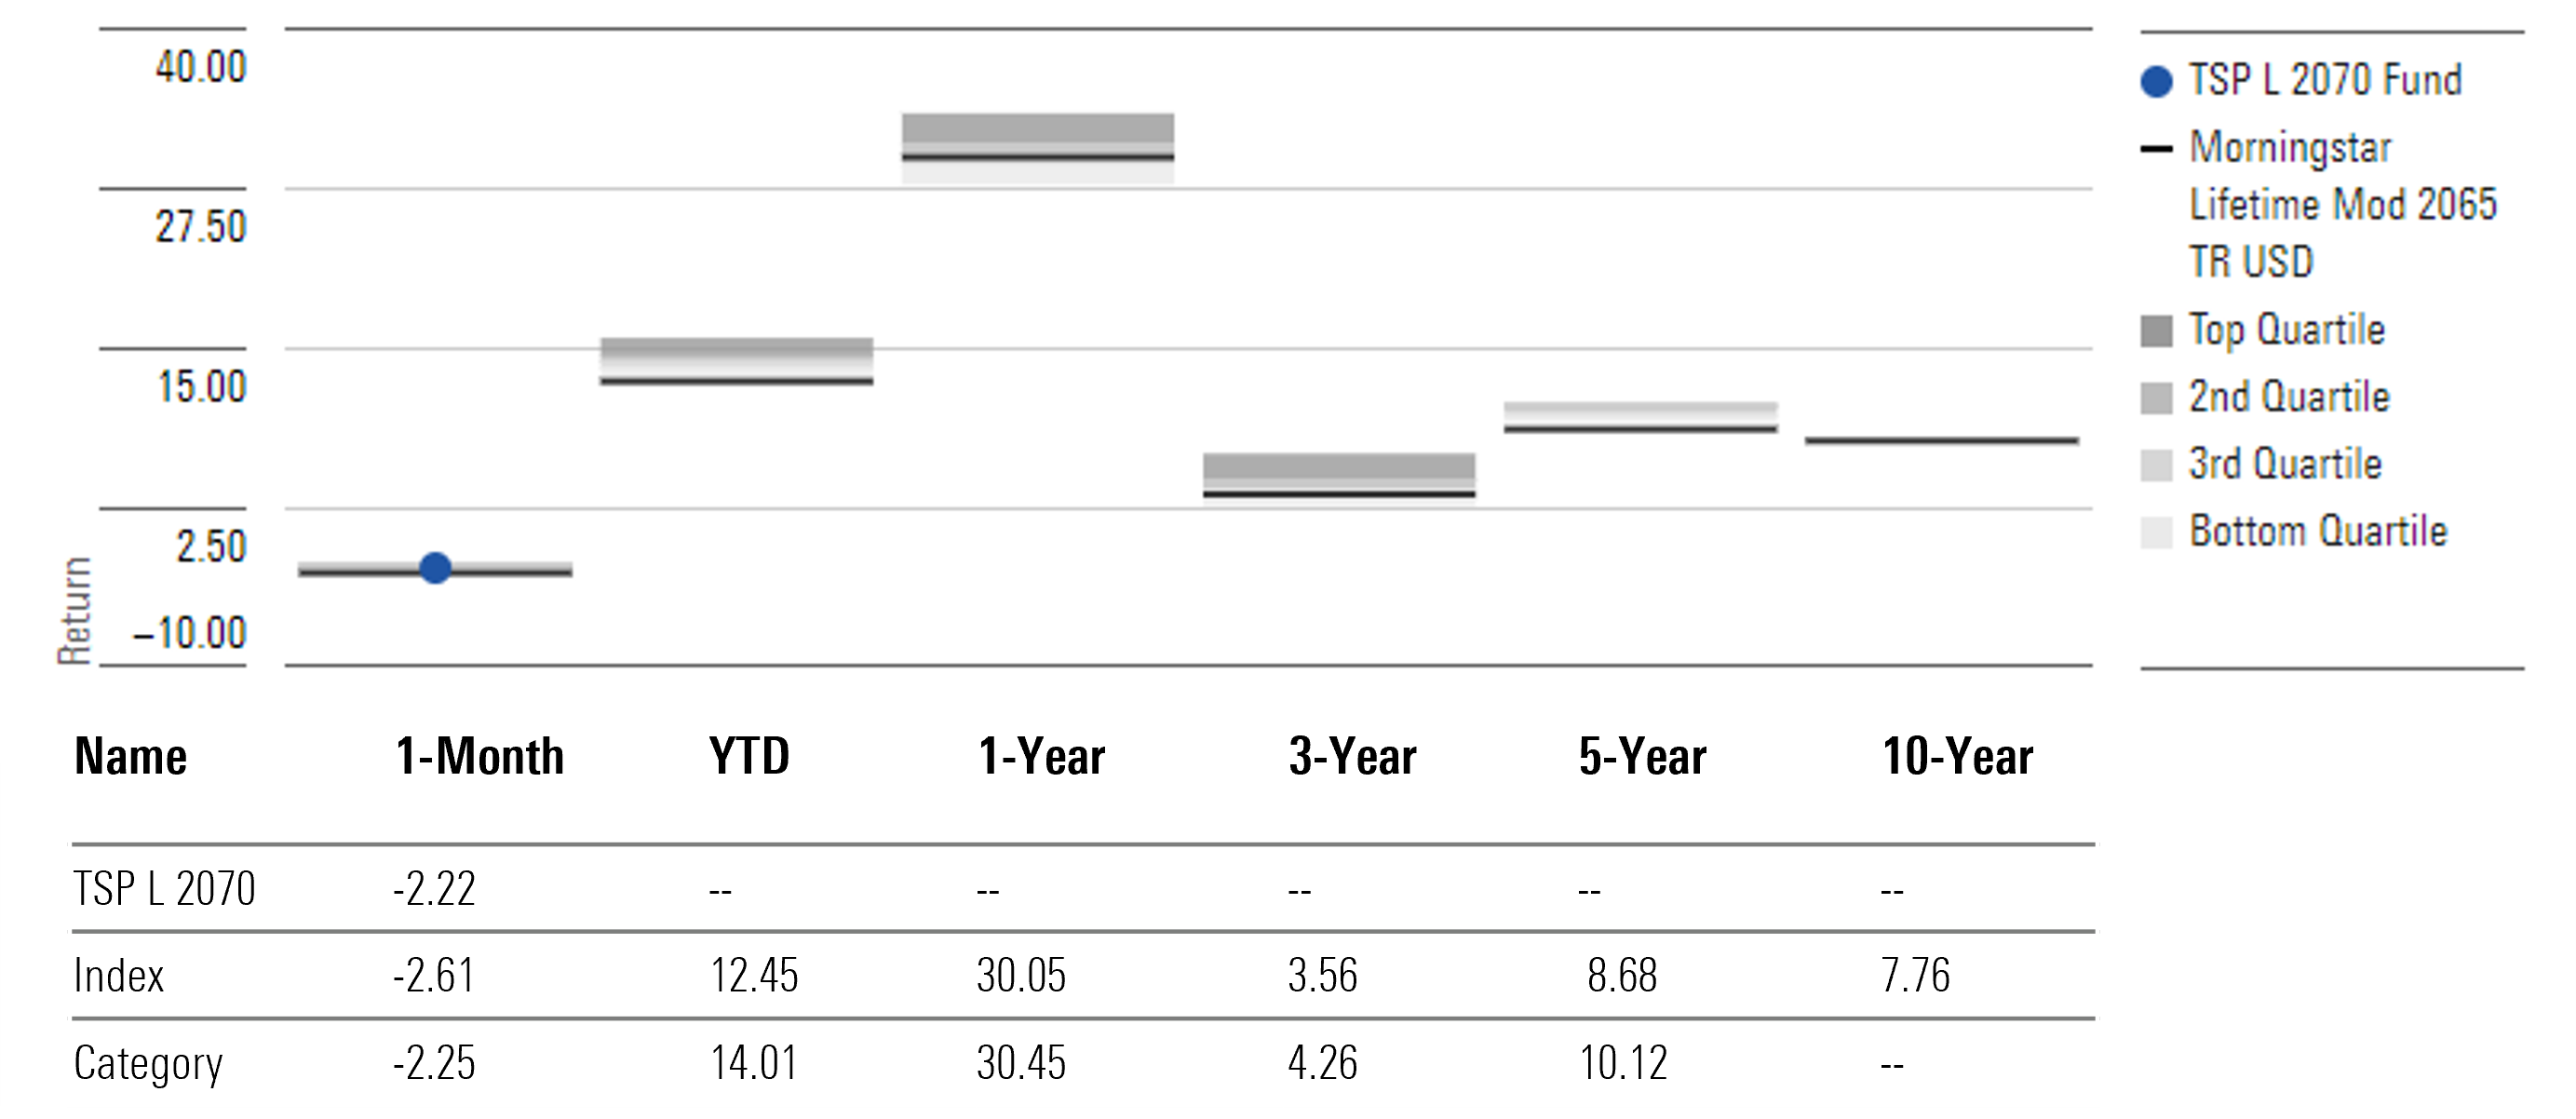
TSP L 2070 launched in late July 2024, so its performance history is limited. Over its first three full months from August to October 2024, its 1.7% gain fell slightly behind the target-date 2065+ Morningstar Category average return of 1.8%. As the TSP moves the L Funds toward their planned higher equity allocation glide path, the funds’ equity allocation will likely be greater than the target-date industry glide path average. This will make for potentially greater long-term returns, though volatility will generally increase as well.
TSP L 2070 Fund Annualized Returns Through Oct. 31, 2024
Morningstar analysts Mo’ath Almahasneh and Zachary Evans contributed to this article.
The author or authors do not own shares in any securities mentioned in this article. Find out about Morningstar’s editorial policies.

 United States