
If you split your portfolio evenly between stocks and bonds, half the time you’ll probably think you have too little risk and half the time you’ll feel like you have too much risk. That’s how diversification works. Something is always going to be underperforming.
For investors who turned to liquid alternatives to help broaden their portfolio’s diversification after the financial crisis, it has often been the part of the portfolio that’s been more disappointing than not.
How we measured the performance of liquid alternatives
To really gauge a liquid alternative fund’s performance, investors should go beyond looking at absolute returns. Liquid alts are supposed to add an additional layer of diversification to a portfolio, so it only makes sense to include them when evaluating a fund’s performance.
To see how these funds have fared over the last three and five years, we ran a simple test to evaluate whether liquid alternative funds would’ve improved the risk-adjusted returns of a hypothetical, basic 60/40 portfolio of stocks and bonds.
This framework for evaluating alternative funds builds upon the Morningstar Style Box TM for alternative funds, which makes it easier for investor to gauge a fund’s diversification characteristics. The alternatives style box is available in Morningstar Direct SM .
For this study, we used a simple formula to tell if the alternative fund could have potentially improved the portfolio, and if so, we used an optimization process to find out by how much it could have improved the portfolio’s risk-adjusted returns, measured by the Sharpe ratio.
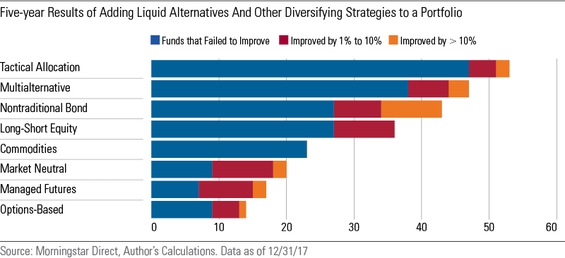
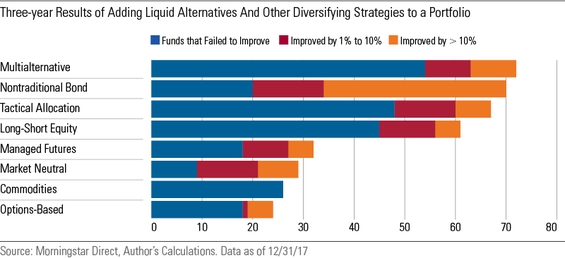
For comparison’s sake, we also ran the test with some other Morningstar Categories that are typically thought of as diversifying, like tactical allocation or nontraditional bond funds. The two charts below show the number of funds in each category that didn’t improve the portfolio (i.e. an investor would've been better off not owning them), that improved the portfolio’s Sharpe ratio by between 1% and 10% (these basically did no harm but didn’t offer much improvement either), and those that improved the Sharpe ratio by more than 10%.
How liquid alts fared over the last 5 years
How liquid alts fared over the last 3 years
Most liquid alternatives have not made a positive impact
According to our research, most funds failed to improve a traditional stock and bond portfolio over both time periods, although market neutral funds had a decent showing over both time periods and nontraditional bonds look particularly useful over the more recent time frame.
Indeed, it’s been a difficult period for most diversifying strategies, given the low volatility in equity markets as they've continued to march higher. Despite a recent uptick in short-term interest rates, it’s also been a largely favorable environment for bonds. Of course, this doesn’t mean that liquid alternatives can’t potentially help portfolios over the next three and five years. But so far, they haven’t been as helpful as many investors probably expected.
The rolling 5-year results of adding hedge funds to the traditional portfolio
Hedge funds haven’t fared much better recently either, which indicates that it may not be a structural problem with liquid alternatives that’s driving the poor results. One concern when hedge fund strategies started migrating over to mutual funds at a lower cost is that they would be watered down versions. That doesn’t appear to be the case, at least not yet.
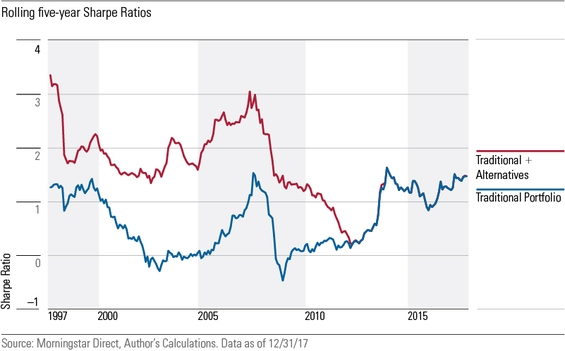
For illustrative purposes only.
Liquid alternative funds appear to be falling
One of the side effects of the strong traditional portfolio returns and the less-than-stellar results for many liquid alternatives has been an acceleration of closings of these funds. This makes picking them even more of a challenge for many investors.
The table below shows the 10 Morningstar Categories with the highest rate of obsolete funds over the five years ended May 31, 2018. To find the percentage of obsolete funds, we looked at total unique funds that existed over the period in each category and the number of unique funds that were liquidated or merged away over the period. We excluded categories with less than 50 total unique funds during the period.
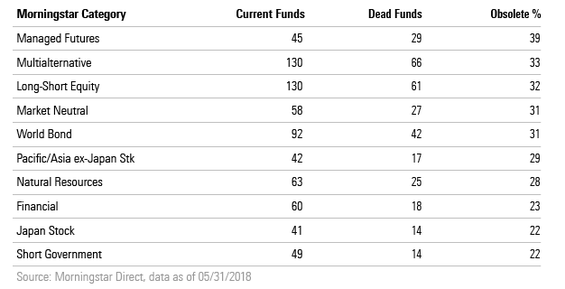
The four categories with the highest rate of fund deaths over the five years fell under the liquid alternatives umbrella. If an investor blindly bought a managed-futures, multialternative, long-short equity, or market-neutral fund over the past five years, there's about a 33% chance the fund no longer exists.
Read the full research paper " Liquid Alternatives Have Yet to Prove They Belong in Portfolios".
Please see below for important disclosure.
Important Disclosure
The information, data, analyses and opinions presented herein do not constitute investment advice; are provided solely for informational purposes and therefore are not an offer to buy or sell a security; and are not warranted to be correct, complete or accurate. The opinions expressed are as of the date written and are subject to change without notice. Except as otherwise required by law, Morningstar shall not be responsible for any trading decisions, damages or other losses resulting from, or related to, the information, data, analyses or opinions or their use. The information contained herein is the proprietary property of Morningstar and may not be reproduced, in whole or in part, or used in any manner, without the prior written consent of Morningstar. Investment research is produced and issued by subsidiaries of Morningstar, Inc. including, but not limited to, Morningstar Research Services LLC, registered with and governed by the U.S. Securities and Exchange Commission.