
Unhidden Gems
When it comes to stock funds, bigger can be better.
/s3.amazonaws.com/arc-authors/morningstar/fcc1768d-a037-447d-8b7d-b44a20e0fcf2.jpg)

Every March, basketball fans gather and root for the little schools in the NCAA tournaments. It’s fun to see the low-seeded teams from obscure schools knock off the giants.
And even in investing, it’s fun to pick an unknown fund or stock and see it go on a tear. There are some logical reasons for choosing these investments, too. Small-asset funds don’t have to dilute the managers’ strategies by adding more stocks or moving up in market capitalization.
But, I wondered, what are your odds of success? There also are clear downsides to smaller funds. They charge higher fees, and they are more likely to be liquidated or merged into other funds because they are not profitable. It’s also possible they can’t tap the resources that bigger funds can.
So, I decided to test equity funds of different sizes to see what the chances are at each level for good outcomes like outperformance or bad outcomes like mergers and underperformance. Is there a sweet spot? Let’s take a look.
How I Ran the Numbers
I started with the universe of all equity funds that existed 10 years ago and grouped them by their total assets as of April 2013. I used one share class for each fund so that funds with many share classes wouldn’t skew the results. I grouped the funds into these buckets of assets under management: less than $100 million, $100 million–$500 million, $500 million–$1 billion, $1 billion–$5 billion, $5 billion–$10 billion, $10 billion–$25 billion, $25 billion–$50 billion, and more than $50 billion.
I looked at ensuing relative performance over the next 10 years for each group as well as whether the fund survived the whole period. In addition, I drilled down to see if the results were different when I isolated actively managed funds and small-cap funds.
There were some surprises and some expected results.
Survivorship Rates by Fund Size
This part is not too surprising. Of the 1,099 funds with assets below $100 million to start, 584, or 53%, didn’t last 10 years. That obsolete rate declined rapidly as you moved up in fund size. It was 34% for $100 million–$500 million funds, 26% for $500 million–$1 billion funds, and just 9% for $5 billion–$10 billion funds. For the average investor, that kind of investment churn in small funds is easy to miss, but it’s pretty dramatic when you tally it up.
Success by Size
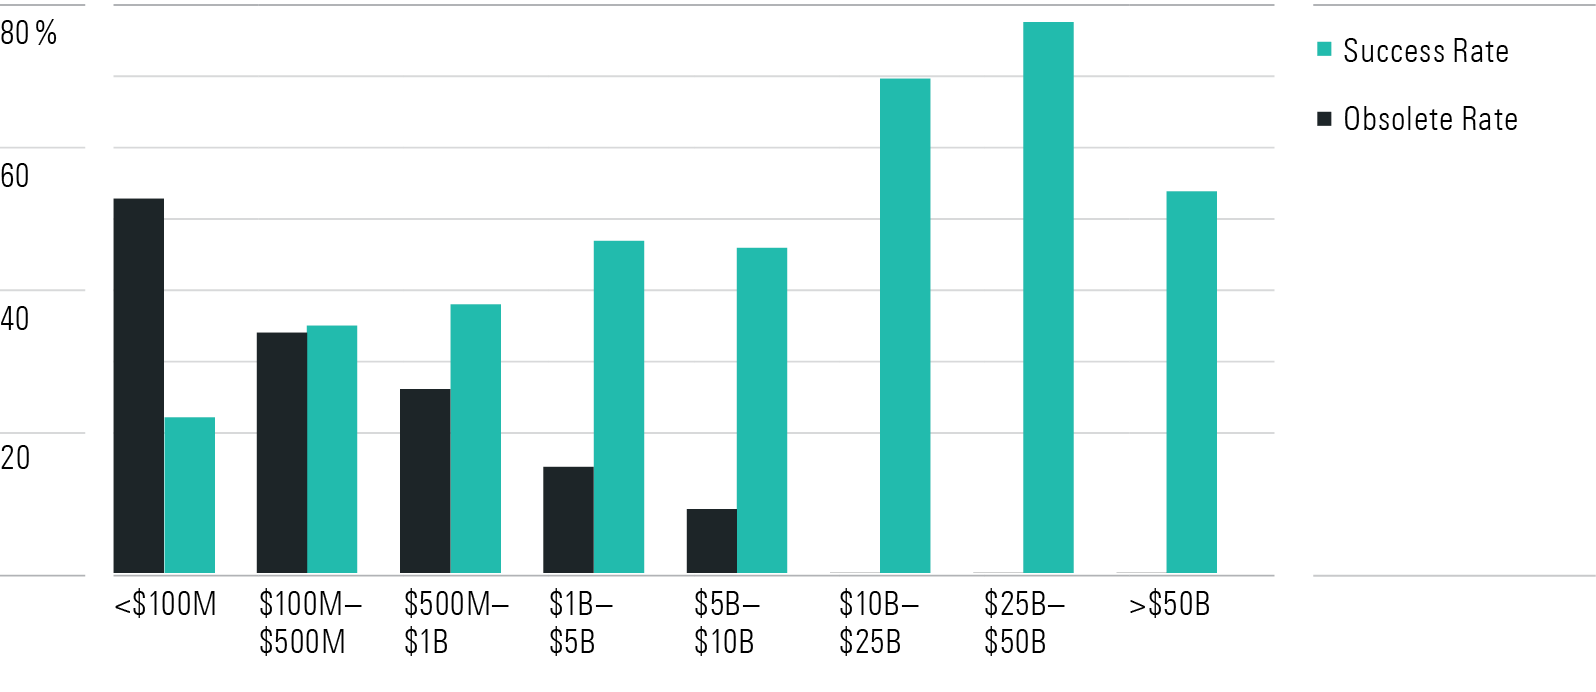
Success Rate by Fund Size
I created success rates years ago as a measure of the percentage of funds that survived and outperformed. It’s a simple way to avoid survivorship bias, in which results are skewed because the things that didn’t survive are excluded.
But did being more nimble help smaller funds to at least make up some ground lost by funds being merged away? The short answer is no.
Success rates were lowest for smaller funds and steadily rose from 22% for the smallest funds up to the 40s for funds between $1 billion and $10 billion, then jumped up to 70% for the next rung, all the way up to 78% for $25 billion–$50 billion funds, before dipping back down to 54% for the very largest funds.
This suggests that you’d want to see very appealing factors like low fees and great management before betting on a small fund. Large funds have several advantages. They have lower costs because fund management has tremendous economies of scale that drive costs down on a percentage-of-AUM basis as assets go up, allowing big funds to pass some of those savings on to investors. Large funds can hire top-flight investment professionals and provide them with all the resources they need. Big fund companies have armies of excellent analysts, quantitative researchers, traders, and support staff to get the most out of their portfolio managers’ talents.
I’m sure the likes of Fidelity and Vanguard very much agree with these points and would argue that big is beautiful.
What if We Isolate Active Funds?
Index funds are very scalable, with a few exceptions, so you’d expect only a very small impact on performance as assets increase. But we know some active strategies have real capacity constraints and occasionally fund companies mismanage asset size. So, what if we ran this data just on actively managed funds?
Active Fund Success Rates
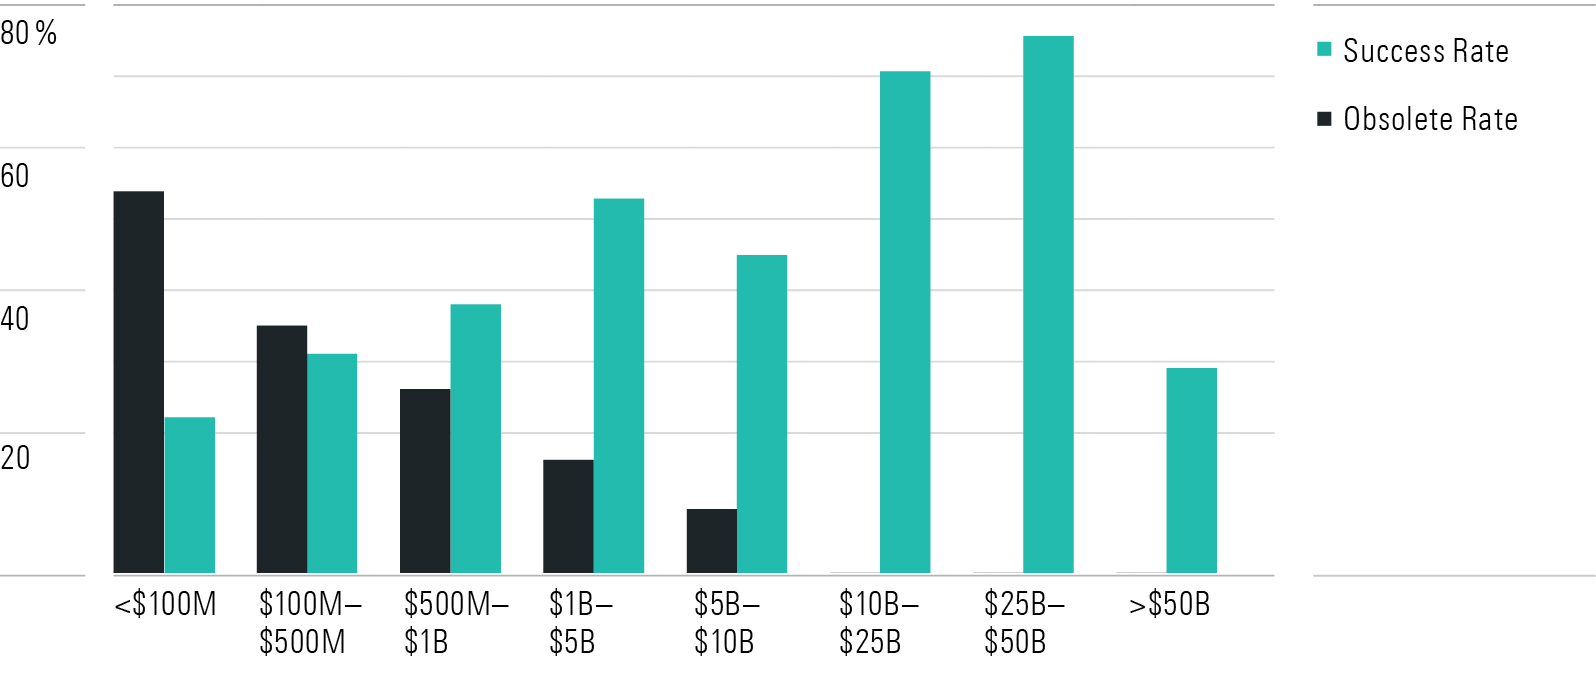
I was surprised to find that it barely moved the needle. The success rate for the smallest funds stayed at 22% when limited to active funds, the next group saw a slight dip from 35% to 31%, and the next one was unchanged at 38%. But the $1 billion–$5 billion asset group saw a bounce to a 53% success rate from 47%.
And at the top of the range, the success rate for actively managed funds above $50 billion fell sharply from 54% to 29%. As I said, indexing is very scalable, but we’ve seen giant equity funds occasionally struggle. But the lagging funds were not disasters. Most of those were funds like American Funds Growth Fund of America AGTHX and American Funds Capital World Growth and Income CWGIX, which put up third-quartile performance over that stretch. But it does underscore the difficulty in running giant actively managed funds.
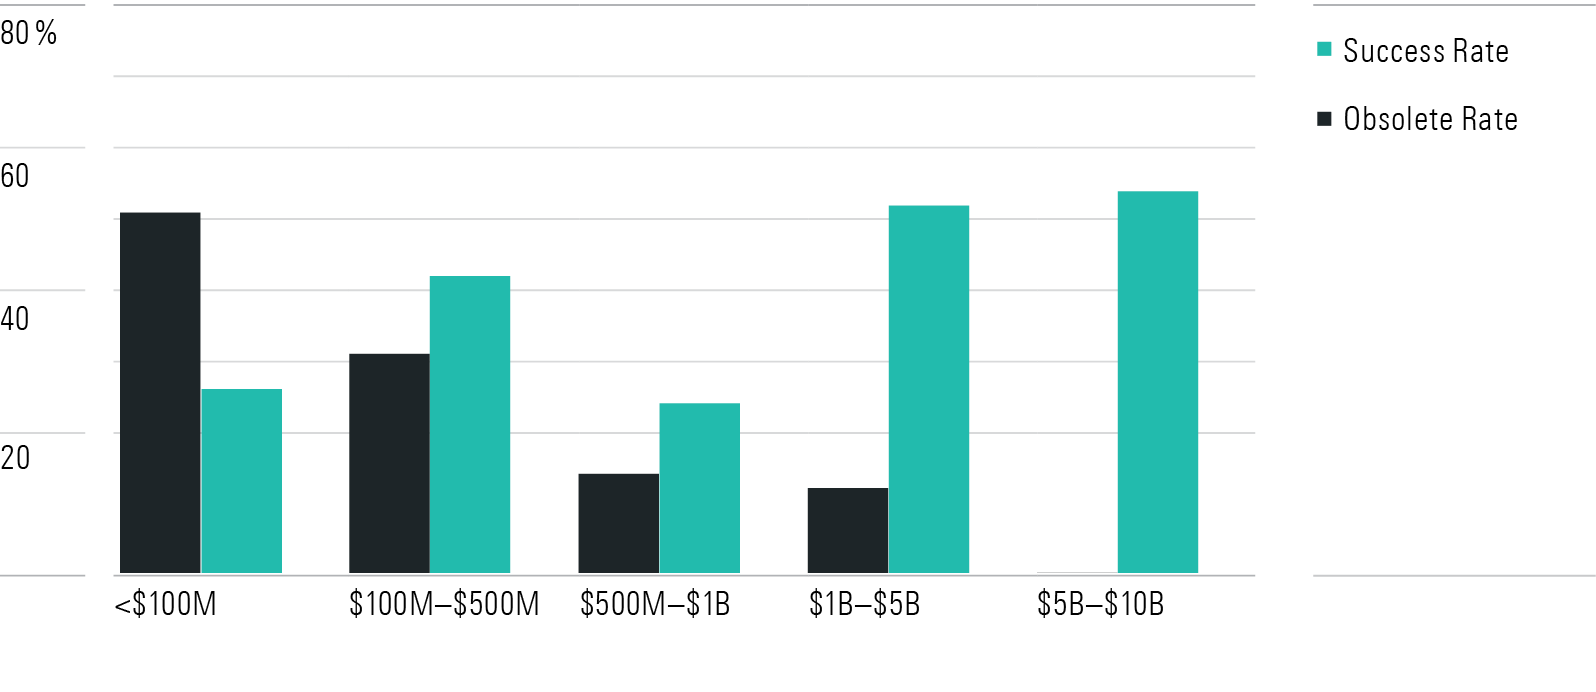
What About Small-Cap Funds?
A smaller asset base ought to have a greater impact on a small-cap fund than a large-cap fund, so I spliced the groups up by actively managed small-cap funds to see how they performed.
Interestingly, the success rates did improve for the smallest two buckets of funds. The smallest rose to a still lackluster 26% from 22%, while the $100 million–$500 million bucket bumped up to 42% from 31%. Yet, the best figures were for the $1 billion–$5 billion range and the $5 billion–$10 billion range, where success rates were 52% and 54%, respectively. The three largest buckets didn’t have enough active small-cap funds to measure.
Success Rates for Small-Cap Active Funds
Putting It to Use
In this article, I tested fund size in isolation. Yet, we know there are important things that can improve your chances of success such as low costs, a strong parent, and high manager investment. If you see some of those good qualities in a small fund, then it probably still has the makings of a good investment.
I’d certainly be interested in a new fund from a highly rated portfolio manager that is priced reasonably and fits within their skill set. Some of the big firms like Vanguard and T. Rowe Price set decent expense ratios on their funds from the beginning, and we know they are likely to attract assets over time.
I would be wary, though, of small funds from lesser-known fund companies or managers. Some middle-tier fund companies are happy to run a bunch of funds out and then just merge away those that don’t click with investors right away. Ten years ago, you could have bought tiny funds like Thesis Flexible, Grand Prix, and Wegener Adaptive Growth. They all had high fees, produced dismal returns, and then went away. There’s no need to put yourself through that.
A version of this article was published in the May 2023 issue of Morningstar FundInvestor. Download a complimentary copy of FundInvestor by visiting the website.
The author or authors do not own shares in any securities mentioned in this article. Find out about Morningstar’s editorial policies.
/cloudfront-us-east-1.images.arcpublishing.com/morningstar/FGC25JIKZ5EATCXF265D56SZTE.jpg)
/d10o6nnig0wrdw.cloudfront.net/04-25-2024/t_d30270f760794625a1e74b94c0d352af_name_file_960x540_1600_v4_.jpg)
/cloudfront-us-east-1.images.arcpublishing.com/morningstar/DOXM5RLEKJHX5B6OIEWSUMX6X4.png)
:quality(80)/s3.amazonaws.com/arc-authors/morningstar/fcc1768d-a037-447d-8b7d-b44a20e0fcf2.jpg)