
Why Pay Up for Bond Funds?
Fees predict bond fund performance, with cheaper funds consistently outperforming pricier offerings.
/s3.amazonaws.com/arc-authors/morningstar/550ce300-3ec1-4055-a24a-ba3a0b7abbdf.png)

As many know, 2022 was a historically bad year for bond investors. The Bloomberg U.S. Aggregate Bond Index—a proxy for the U.S. investment-grade bond market—fell 13%, its worst calendar year showing since the benchmark’s 1976 inception. Taxable bond funds fared little better, with the average fund tumbling more than 10% in 2022, the deepest calendar-year loss in at least 40 years.
Predictably, some have used last year’s drubbing to question whether low costs matter as much in bond funds as they do in other areas. After all, they argue, the cheapest low-cost index funds have generated pedestrian returns over the long haul. Moreover, they say, a passive approach will hardly protect one from the ravages of rising interest rates.
At first glance it seems like they might have a point. We sorted taxable bond funds by the expense ratios they reported for the years 2011 through 2019, grouping them into quartiles. Then we compared the subsequent average returns of funds in those fee quartiles in the three years that followed the year they reported their fees. Here’s what that picture looks like.
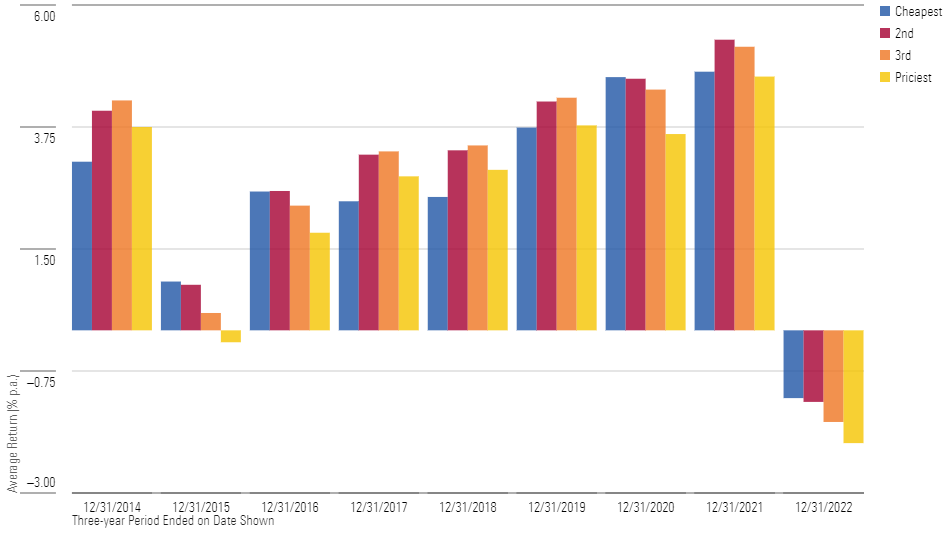
Overall, it’s mixed. The cheaper funds outgained the pricier funds in five of the nine rolling three-year periods, but it’s not like there was a rout. In fact, the cheapest quartile outperformed the priciest by only about 24 basis points per year, on average, which is not much to crow about.
Not So Fast
But on closer review a few things become apparent. For one, the priciest funds badly underperformed the cheapest in the three-years ended Dec. 31, 2022, a period that included last year’s selloff. That doesn’t mean passive bond funds fared markedly better amid rising rates. But it throws cold water on the notion you had to pay up to navigate choppy market conditions. The results suggest exactly the opposite was true.
In addition, the data in the previous chart didn’t consider differences in investing style. When we control for these differences—by grouping bond funds according to their Morningstar Category, sorting the funds into fee quartiles within those categories, and then tracking subsequent returns—a different picture takes shape.
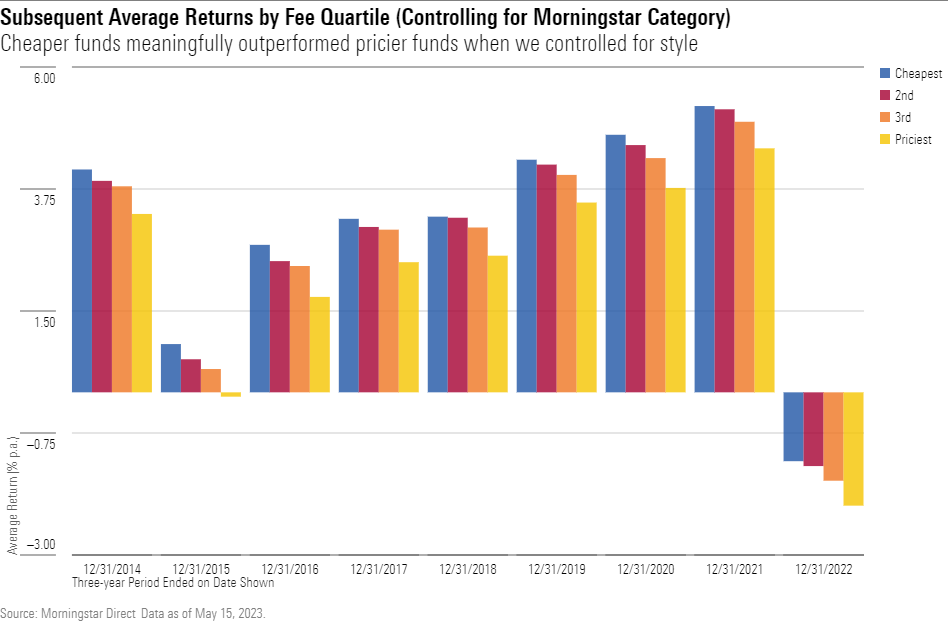
The cheapest funds outperformed the priciest like clockwork over every one of the subsequent three-year periods. And this was true in good times and bad. In fact, funds levying below-average expense ratios outgained those charging above-average expense ratios by a larger margin in the three years ended 2022 than they did in the three years ended 2019, which was a heady period for bonds.
In short, it appears fee differences have done a good job of predicting bond funds’ future relative performance, with cheaper funds consistently outdoing costlier funds. And that was no less true last year than it was in prior years when the bond bull market was still in full swing.
The Rest of the Story
Of course, that’s only part of the story. Costlier bond funds not only return less than cheaper funds, on average, but they’re more volatile. That’s apparent in the chart below, which is identical to the previous one but in this case plots out funds’ subsequent average standard deviation of returns.
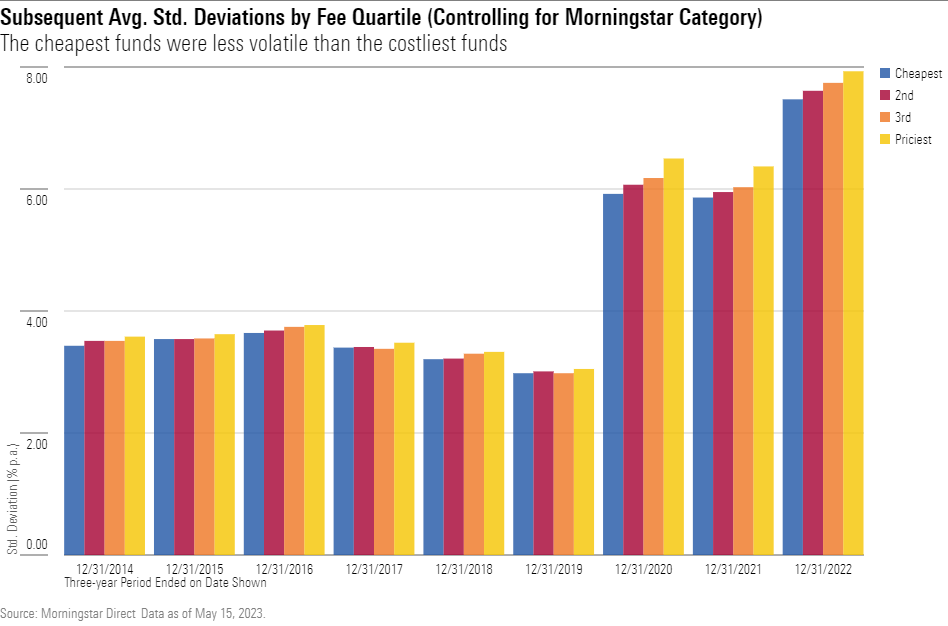
The cheapest funds were less volatile than the priciest funds in every rolling three-year period we examined and that became more pronounced in recent years, as interest rates rose.
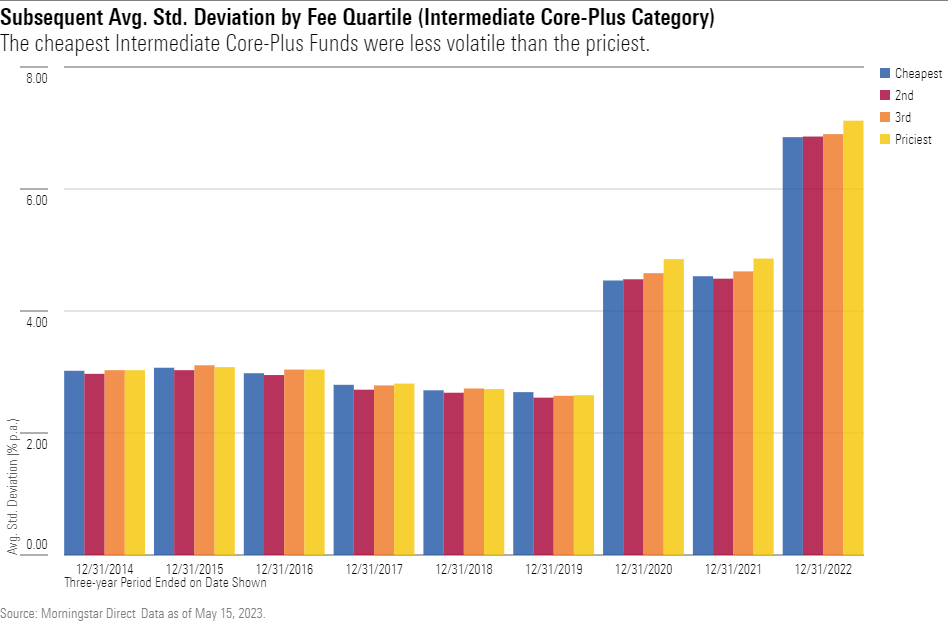
That’s not a coincidence. For even among funds of the same type, pricier offerings are more likely to take on higher risk to clear the higher fee hurdles they face. That’s evident when we zoom in on Morningstar Categories like intermediate core-plus bond, where the costliest funds were no less volatile than the cheapest, as shown below.
Conclusion
To be sure, these results don’t broadly invalidate the case for active bond investing, as many of the outperforming funds in the cheapest fee quartile are actively managed. But they also don’t provide evidence that fees are any less predictive in taxable bond funds than other areas we’ve examined. To the contrary, fees did a good job of predicting which funds were likelier to lead or lag, on average. What’s more, higher fee bond funds tended to be more volatile than the norm.
Given this, investors are well advised to avoid taxable bond funds that carry a steep price tag. These funds face steeper odds of outperforming and are likelier to be more volatile along the way.
Correction: (May 16, 2023): A previous version of this article included an outdated name for the Bloomberg U.S. Aggregate Bond Index. The inception year for the benchmark was also corrected to 1976.
The author or authors do not own shares in any securities mentioned in this article. Find out about Morningstar’s editorial policies.
:quality(80)/cloudfront-us-east-1.images.arcpublishing.com/morningstar/OMVK3XQEVFDRHGPHSQPIBDENQE.jpg)
:quality(80)/cloudfront-us-east-1.images.arcpublishing.com/morningstar/WJS7WXEWB5GVXMAD4CEAM5FE4A.png)
:quality(80)/cloudfront-us-east-1.images.arcpublishing.com/morningstar/NOBU6DPVYRBQPCDFK3WJ45RH3Q.png)