
Passive Funds Beat Active Amid This Year’s Market Volatility
Long-term trends help investors identify where to go active despite a challenging 12 months for active funds.


Elections, executive orders, tariffs, and geopolitical risks made for a roller-coaster ride during the 12 months through June 2025. Conventional wisdom says active managers should better manage those complexities, but performance says otherwise.
Of the 3,200 active funds included in our analysis, 33% survived and outperformed their average passive peer during the 12 months through June 2025.
We further analyze these findings in the midyear 2025 installment of the Morningstar Active/Passive Barometer, a semiannual report that measures the performance of US active funds against passive peers in their respective Morningstar Categories.
The Active/Passive Barometer spans over 9,200 unique funds that accounted for approximately $24 trillion in assets, or about 68% of the US fund market.
Most Active Managers Failed to Capitalize on Volatility in 2025
Headlines about active managers’ superiority in navigating turbulence often decorate market declines. The data rarely backs this up—at least for the average active manager.
The latest volatility was no different. Just one in three active managers survived and outperformed their average peer over the 12 months through June 2025.
Fixed-income categories faced the largest declines among asset classes included in this report. Stubborn long-term rates and periods of widening credit spreads left riskier strategies in the cold. The changing shape of the yield curve drove the biggest decline in success rates of this report in the corporate bond category. Passive corporate bond funds concentrated in the sweet spot on the yield curve between five and seven years to maturity.
This raised a nearly impossible hurdle for active managers, especially their fee disadvantage. This culminated in a 60-percentage-point decline to a 3.9% success rate for the 12 months through June 2025.
Changing Treasury Par Yield Curve Over the Past 12 Months
Benefit From 12-Month Interest Rate Changes at Points Along the Yield Curve
Success rates fell in US stocks (down 13 percentage points to 31%) and real estate (down 38 percentage points to 25%) as well. The only year-over-year increases occurred in international stock categories, which jumped 8 percentage points to 52%, excluding the global large-blend category.
Year-Over-Year Change in Active Funds' One-Year Success Rate by Category (%)
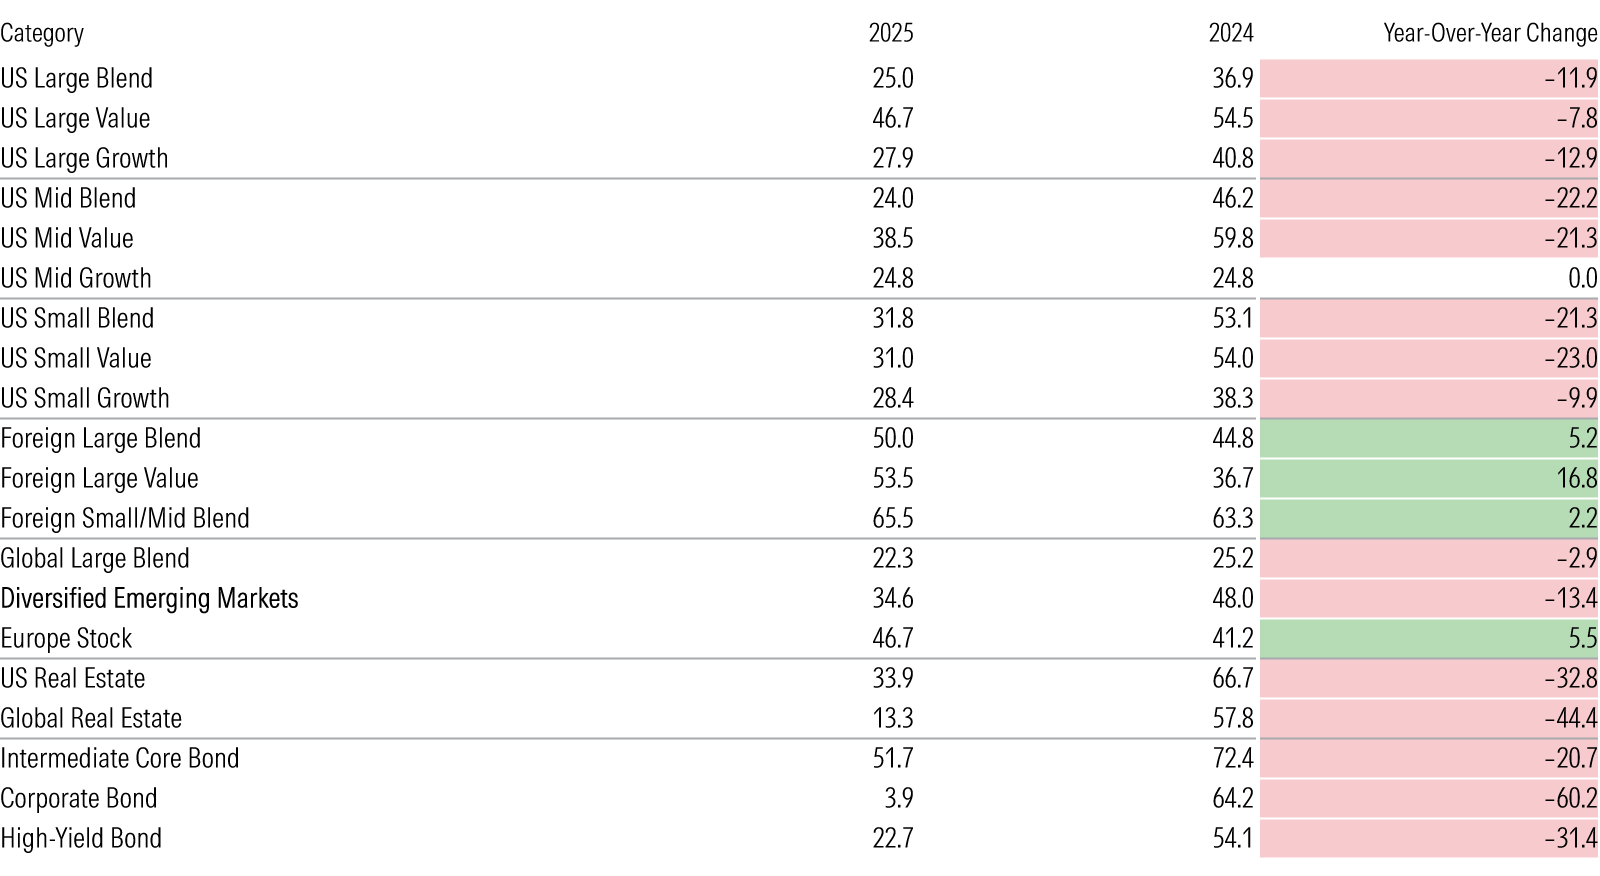
But one year isn’t a sufficient time horizon from which to draw conclusions. Success rates can fluctuate wildly from year to year, depending on what’s going on in markets.
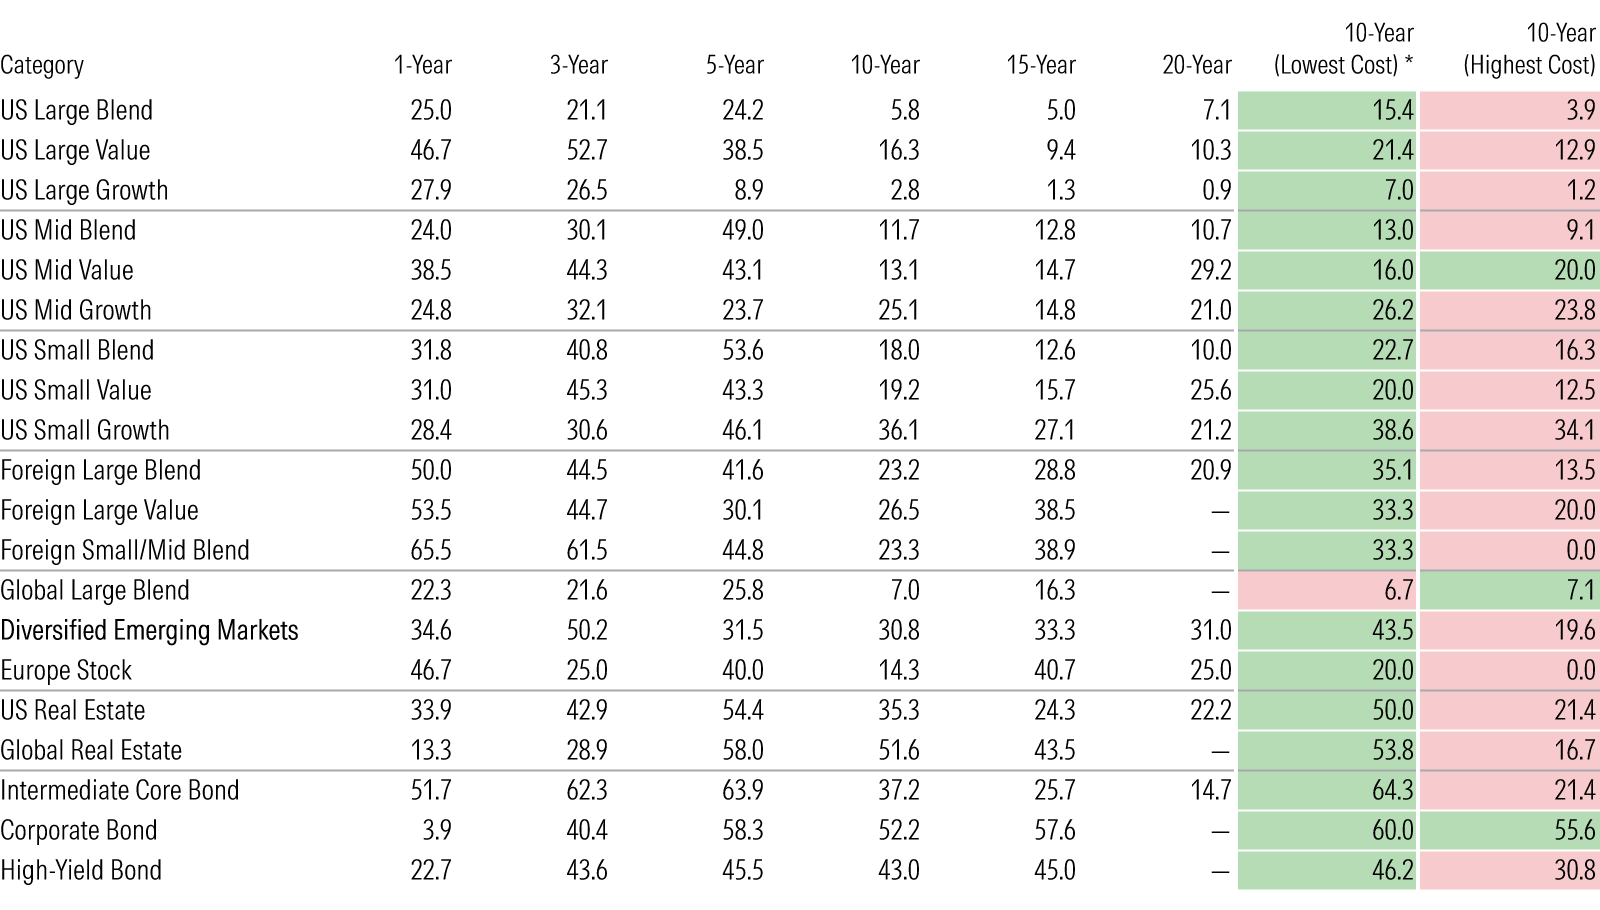
Longer horizons provide stronger signals that investors can incorporate in their selection process. In general, actively managed funds have failed to survive and beat their benchmarks, especially over longer time horizons. About one out of every five active funds topped the average of their passive rivals over the 10-year period ended June 2025.
But success rates vary across categories. Long-term success rates were highest among bond and real estate funds, where active management may hold the upper hand. Investors can use this data to identify areas of the market where they have better odds of picking winning active funds.
Active Funds' Success Rate by Category (%)
Sizing Returns of Passive and Active Investing
Success rates alone only tell half the story. The other half is the prospective payoff for choosing a winning fund versus the penalty for picking a loser. The Active/Passive Barometer plots this information in the form of the distribution of 10-year excess returns for surviving active funds versus the average of their passive peers.
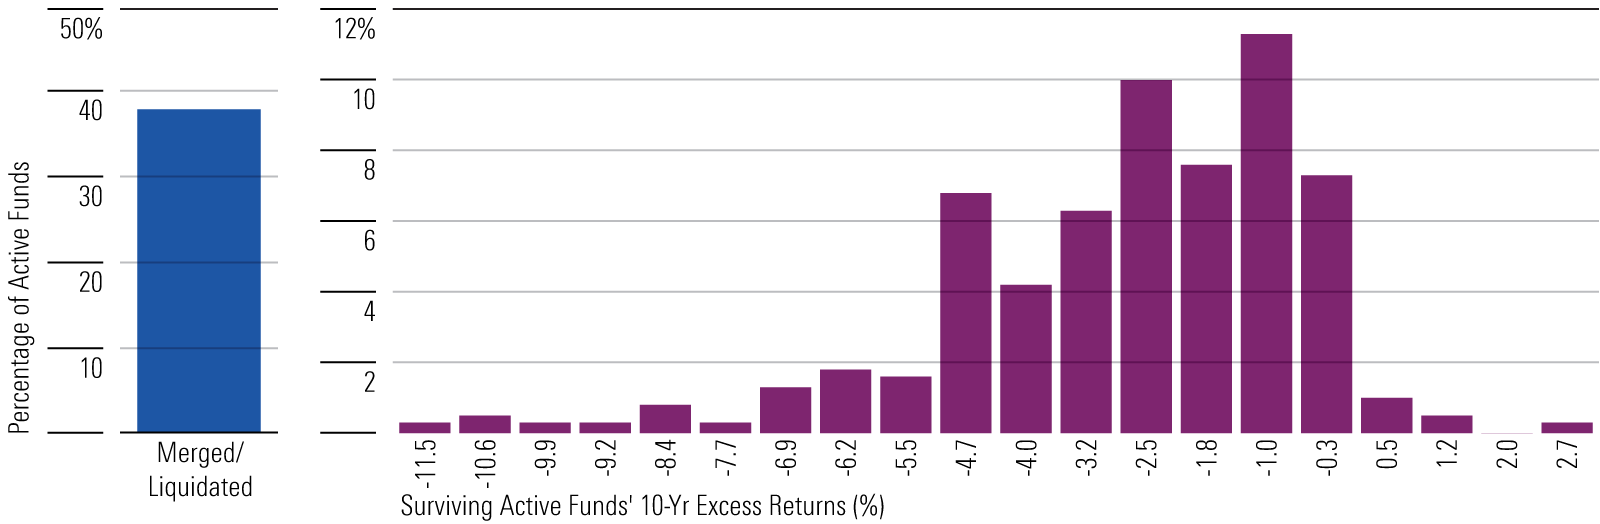
Much like success rates, these distributions vary by category. In the case of US large-cap funds, the distributions skew heavily negative. This paints a bleak picture for active funds in these categories. They have low long-term success rates, and penalties can be high for picking a loser.
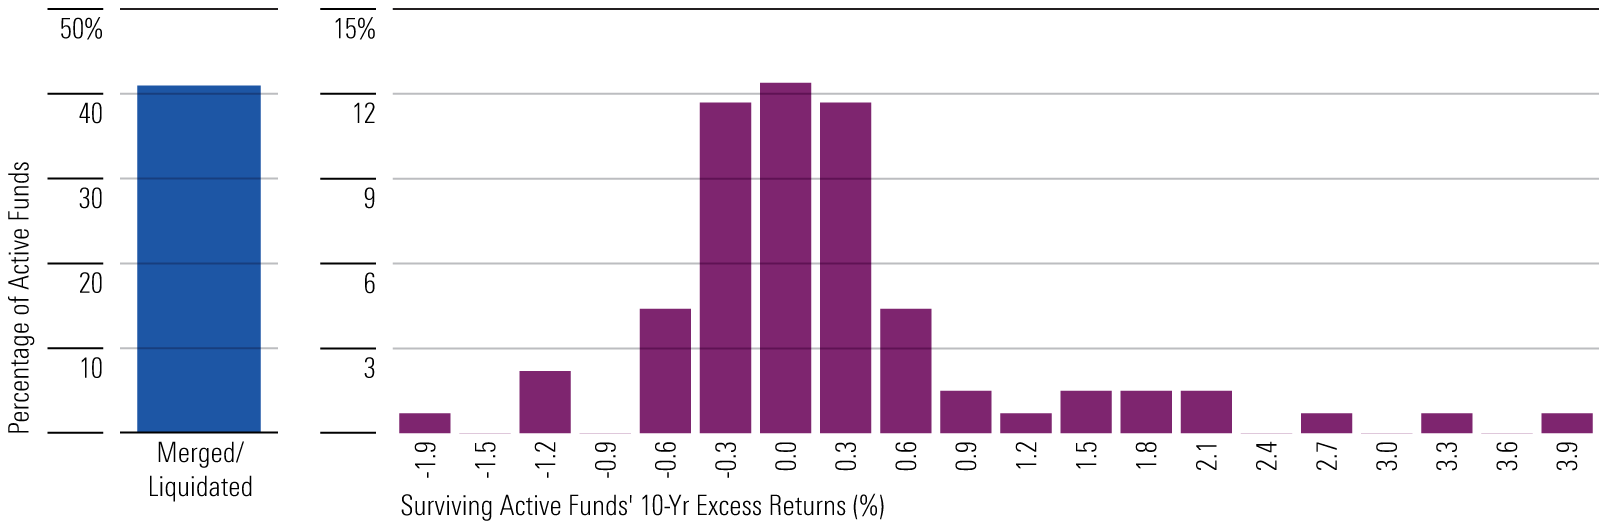
The opposite tends to be true of fixed-income and real estate categories, where long-term success rates have generally been higher and excess returns among surviving active managers skewed positive over the past decade.
The following charts show the distributions of excess returns for surviving active funds from the large-blend and intermediate-core bond categories as clear examples of skewed distributions.
Mortality and Distribution of 10-Year Annualized Excess Returns for Surviving Active Large-Blend Funds
Mortality and Distribution of 10-Year Annualized Excess Returns for Surviving Active Intermediate Core Bond Funds
Costs Matter for Both Passive and Active Funds
A signal that rings loud and clear in this dataset is that fees matter. Funds in the cheapest quintile succeeded more often than funds in the priciest one (27% success rate versus 15%) over the 10-year period through June 2025.
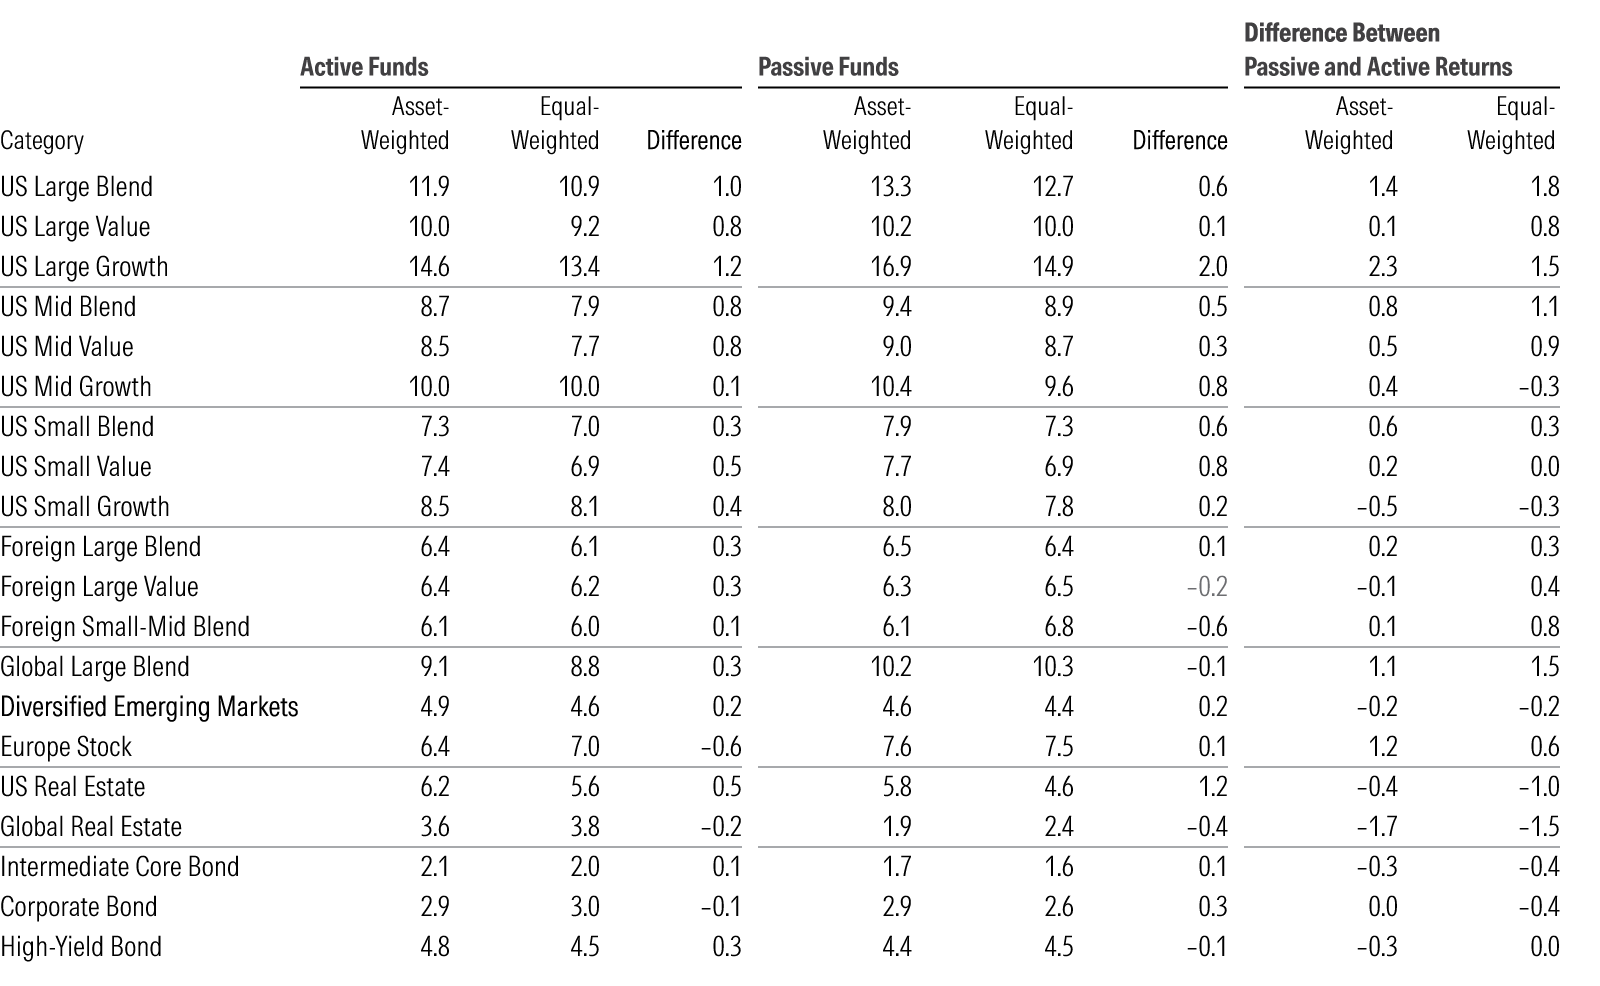
Investors have caught on. Over the past 10 years, the average dollar invested in active funds outperformed the average active fund in 17 of the 20 categories examined. That implies investors have found cheaper, higher-quality strategies.
Comparison of Asset- and Equal-Weighted 10-Year Returns (%)
The author or authors do not own shares in any securities mentioned in this article. Find out about Morningstar’s editorial policies.

 United States