
One More Reason for CEF Investors to Forget 2016
Winter melancholy and the infinite sadness of shrinking taxable CEF distribution rates.
/s3.amazonaws.com/arc-authors/morningstar/af89071a-fa91-434d-a760-d1277f0432b6.jpg)

Last month's review of municipal-bond closed-end funds noted their disappointing November performance, brought on by the implications of a new, tax-friendly administration and exacerbated by rising interest rates. This month we extend our theme of winter melancholy to taxable-bond CEFs, which posted 2016 distribution levels that were down 4% from their 2015 amounts—double the year-over-year change from 2014 to 2015. This month, we review the taxable-bond CEF asset class, as well as tools investors can use to assess a CEF's distribution.
What's in a Distribution? As a refresher, a CEF's distribution—the amount of income it returns to shareholders, usually on a monthly basis—can be composed of interest payments from bond holdings, dividends from stocks, short- or long-term capital gains, and return of capital. All closed-end funds are required to report the sources of their distributions on IRS form 1099-DIV, which many funds make available online. Morningstar consolidates the last four years of a closed-end fund's distribution history, which can be found on a fund's Quicktake page.
When Distribution Rates Go South Distributions are often what make closed-end funds an enticing investment for many income-seekers, and a fund may go to great lengths to keep its distribution payouts steady. While a fall in a fund's distribution rate can certainly disappoint existing shareholders, it is important to understand the factors behind any significant changes to a fund's distribution. A distribution which falls due to market conditions, like changes in interest rates, will have much different implications towards the fund's ability to meet future payouts, than a similar distribution cut due to a one-time shortfall.
While most CEFs have loose distribution targets, some have managed distribution policies, which require that the fund meets a certain distribution threshold in each distribution period. For all closed-end funds, but especially those with managed distribution policies, the inability to satisfy an expected distribution with income and capital gains can result in the fund supplementing its payout with ROC. Return of capital has the effect of reducing the fund's asset base (literally "returning" capital to its shareholders), but by satisfying an expected distribution rate, helps the fund control its share price and buffers existing shareholders against a sudden price drop.
Taxable Bonds: Where's the Money? Exhibit 1 shows a histogram of the year-over-year changes to taxable bond CEF distribution levels as of Dec. 31, 2016.

Using year-end data, we found that 78% of taxable-bond CEFs paid out less in 2016 than they did in 2015. This is up from 64% of funds during the year-over-year period ending in 2015. Notably, all taxable-bond CEFs with managed distribution policies supplemented their income with ROC, even if the funds exceeded their distribution amounts over the previous year. One of these,
On a category level, high-yield—the largest taxable-bond CEF category—saw its distributions fall the most. The average and median distribution changes for high-yield CEFs were negative 7% and negative 6% lower, respectively, than in 2015. On the face of it, this might be surprising, given that high-yield was 2016's best-performing fixed-income sector. But it is important to keep in mind that the factors which contribute to a fund's distribution make up only a portion of those which feed into its return. One reason behind 2016's fall in distribution rates could be the combination of these funds' use of leverage and the nonparallel shift in interest rates from December 2015 to December 2016. During this period, the rate on the short end of the yield curve increased more significantly than the long end. For high-yield funds that use leverage, this "flattening" means that the cost of borrowing went up at a greater rate than the amount of yield returned on longer-term assets.
Ultimately, while it can be near-impossible for the average investor to predict the magnitude of interest-rate changes, one can familiarize themselves with a fund's distribution history, to get a sense of how it might react if it cannot maintain its historical distribution levels. If a fund has a managed-distribution policy, consider if you are willing to receive a distribution funded by return of capital. If not, then a temporary decrease in a fund's distribution rate might be preferable, at the risk of a drop in share price.
CEF Discount Trends Despite some end-of-year volatility caused by interest rates rising, taxable-bond CEF discounts were considerably narrower at the end of the year than the beginning. The average taxable-bond CEF's discount was 4.38% at year-end, which was a sharp improvement from the 8.00% average discount they started the year at, despite the shrinking distributions. Municipal-bond CEF share prices saw more of a roller coaster. After starting the year at an average discount of 4.60%, they staged a strong rally mid-year and in August traded at an average premium to net asset value. Following the presidential election, the share prices plummeted though as the aforementioned rising rates and expectations of lower tax rates caused demand to soften. The average muni CEF's discount stood at 4.16% at year end. Exhibit 2 shows the average discounts for the three major CEF asset classes for the trailing three-year period.

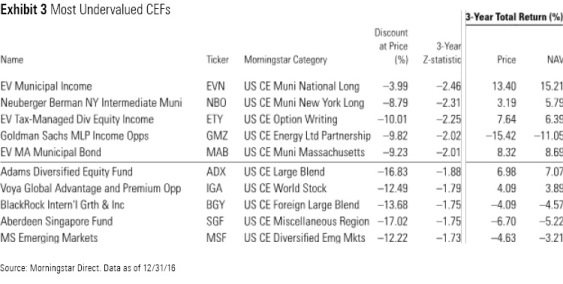
Valuations We use a z-statistic to measure whether a fund is "cheap" or "expensive." As background, the z-statistic measures how many standard deviations a fund's discount/premium is from its three-year average discount/premium. For instance, a fund with a z-statistic of negative 2 would be two standard deviations below its three-year average discount/premium. Funds with the lowest z-statistics are classified as relatively inexpensive, while those with the highest z-statistics are relatively expensive. We consider funds with a z-statistic of negative 2 or lower to be "statistically undervalued" and those with a z-statistic of 2 or higher to be "statistically overvalued." Typically, we prefer to use the three-year z-statistic which shows the funds that are most heavily discounted relative to their prices over the past three years.
Best- and Worst-Performing CEF Categories The best-performing CEF categories in December, not surprisingly, were equity-focused and bonds with lots of credit risk. The Federal Reserve raised interest rates in December, causing most bond CEFs to post losses last month. Spread-tightening (alongside an uptick in the stock market) counterbalanced some of those losses, especially for lower-rated corporate bonds. The worst-performing funds included a number of muni-bond categories, commodities, and healthcare stocks, which face a large amount of uncertainty over the future of the Affordable Care Act. The 10 best- and worst-performing CEF categories for December are listed below.

/cloudfront-us-east-1.images.arcpublishing.com/morningstar/EGA35LGTJFBVTDK3OCMQCHW7XQ.png)
/cloudfront-us-east-1.images.arcpublishing.com/morningstar/ZKOY2ZAHLJVJJMCLXHIVFME56M.jpg)
/d10o6nnig0wrdw.cloudfront.net/05-14-2024/t_958dc30e28aa4c8593f13c19505966e3_name_file_960x540_1600_v4_.jpg)
:quality(80)/s3.amazonaws.com/arc-authors/morningstar/af89071a-fa91-434d-a760-d1277f0432b6.jpg)