
The Most Persistent U.S. Equity Funds
Growth funds offer the greatest opportunity.
/s3.amazonaws.com/arc-authors/morningstar/1aafbfcc-e9cb-40cc-afaa-43cada43a932.jpg)

Excess Returns
I have learned my lesson. Last Tuesday’s column described a research method called “factor analysis,” then discussed its findings. A poor decision. My article was neither fish nor fowl. To mix the metaphor, it was a platypus. After squandering half of my virtual ink on the windup, I ended up shortchanging the main topic: how factor analysis supports Jack Bogle’s key investment precepts.
I will make no such blunder today. If you wish to understand in some detail how factor analysis works, here are three links. (Beware: They are not quick reads.) Otherwise, I will immediately cut to the chase: using factor analysis to identify U.S. stock funds that have notched persistently high excess returns.
Rather than compare a fund’s performance against either a peer group or common index, factor analysis creates a customized benchmark. Each fund is compared against an individualized model. This article addresses the “excess returns” that appear after applying that model—that is, the portion of fund performance that the factor-analysis technique cannot explain.
(A brief example: The model calculates that over a 10-year period, a fund using that particular investment strategy should have returned 8.5% per year. In fact, the fund gained an annualized 8.2%. Its excess returns are therefore negative 0.3%.)
This column will address three questions. One, how many funds posted high excess returns over two consecutive periods? Second, should we credit their portfolio managers for such success, or do those figures merely reflect the limitations of the factor-analysis model? Third, what are those winning funds?
Issue #1: How Many Funds?
I conducted the study screening for the oldest share class of all diversified U.S. equity funds, both open-end and exchange-traded, that existed from April 2013 through March 2023. For each half of the period, I calculated the funds’ excess returns (using a three-factor model) during that decade. I defined persistent funds as those with excess returns that ranked in the top decile on both occasions.
The study contained 1,655 funds. If the results were random, one fund in 100 would land in the top decile both times, making for median expectation of 17 funds. In fact, 32 funds hit the mark. It seems that true persistence does exist.
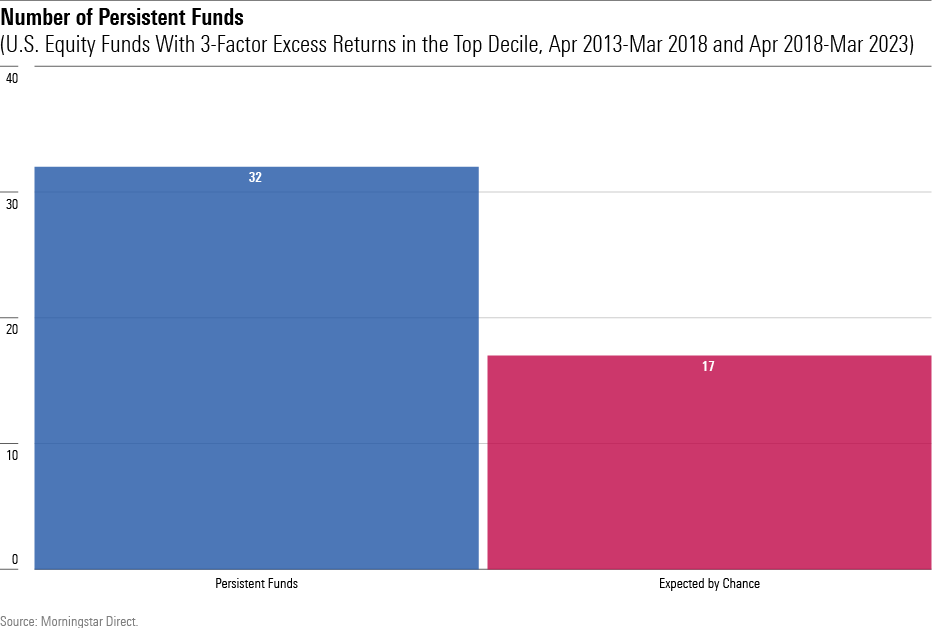
(Time for a quick brain teaser. What is the likelihood that those 32 funds passed the screens solely by chance? That is, if a 100-sided die were rolled 1,655 times, what is the probability that it would land on “7″ at least 32 times? My intuition told me that figure was quite small, say 1%. I greatly overstated the matter. The actual answer is 0.05%—once in every 2,000 simulations. A rare event indeed.)
Issue #2: Interpretation
Now comes the tricky part. That the findings are statistically significant is good news for those seeking persistently successful funds. However, as previously mentioned, that development could owe to the model’s imperfection. If the factor analysis houses a blind spot, those “excess returns” might be only sound and fury, signifying nothing about the abilities of the funds’ portfolio managers.
That concern is valid. As abnormally skilled managers presumably are scattered across the fund universe, rather than assigned only to funds that follow certain strategies, one would expect the winners’ list to be spread among the various fund categories. But that is not the case. Of the 32 funds with persistently high excess returns, a whopping 30 invest in some form of growth stocks.
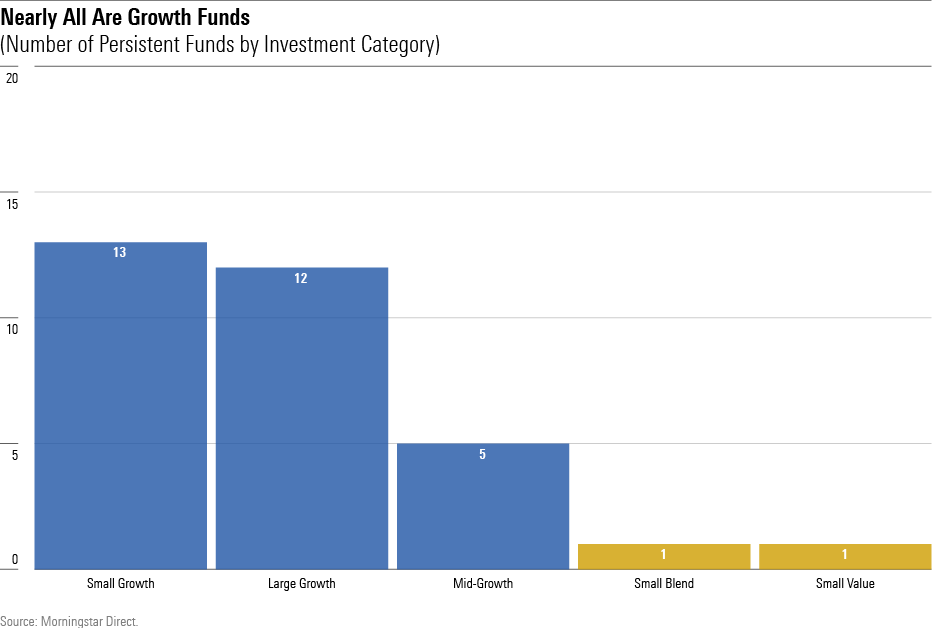
If that chart doesn’t lead you to suspect the model, then you trust too deeply. For one, the near-absence of blend- and value-style funds is disturbing. Simply by chance, roughly a dozen such funds should have exhibited persistent returns. It seems that the factor-analysis model treats blend and value funds too harshly. Second, should we really believe that there are 15 times as many exceptional managers running growth funds as with the other investment styles? Surely not.
However, there is an explanation that can at least partially salvage the reputation of factor analysis. For whatever reasons (I have some thoughts, but that is a subject for another column), actively managed small-growth mutual funds have performed better against their indexes than have other types of U.S. equity funds. Results vary according to the index selected, but on average active small-growth funds have beaten their benchmarks by 2 percentage points per year over the past decade before expenses, and about 50 basis points after costs.
Thus, one could plausibly make the following argument:
1) Growth-stock portfolio managers are not more capable than their peers.
2) However, they can more profitably employ their skills, because professional investment management fares unusually well against small-growth stocks.
Whether that claim is true, I cannot say. But the possibility justifies this article’s final section, which displays the exercise’s leading funds. (There would be little point in presenting them if the excess-return calculations were but noise.)
Issue #3: The Top-Scoring Funds
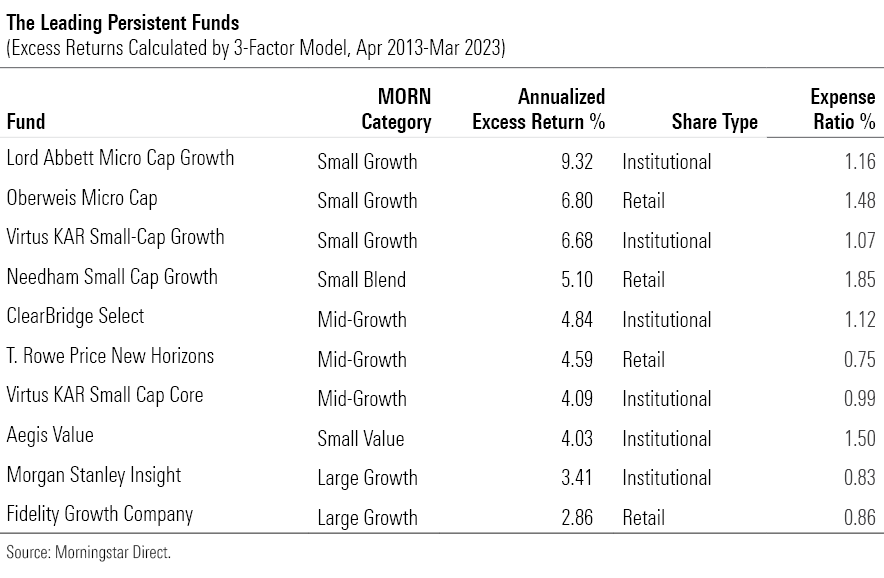
For this table, I pared the candidate lineup to 10 funds from 32. I selected the three small-growth and three mid-growth funds that registered the highest excess returns for their Morningstar Categories, along with the sole small-blend and small-value funds. Rounding out the list were the two best-scoring large-growth funds.
Along with each fund’s average annualized excess returns and category, the table shows its current expense ratio, as well as whether it is a retail or institutional share class. (If the latter, fear not. The fund may also have retail share classes, or it make its institutional shares available through some retail channels.)
Summary
Factor analysis boasts the advantage of being rigorous and sophisticated, thereby generating consistent results. But the method also carries a major drawback: The numbers cannot testify about their failings. Consequently, a factor model’s results imply too much certainty. As with human estimates, they contain errors, meaning that their output should also be consumed with generous amounts of salt.
But if used in combination with other information, excess returns can help with the task of identifying the industry’s best-run funds.
Correction: A previous version of this article transposed the average active small-growth funds results.
The author or authors do not own shares in any securities mentioned in this article. Find out about Morningstar’s editorial policies.
The opinions expressed here are the author’s. Morningstar values diversity of thought and publishes a broad range of viewpoints.
/cloudfront-us-east-1.images.arcpublishing.com/morningstar/G3DCA6SF2FAR5PKHPEXOIB6CWQ.jpg)
/cloudfront-us-east-1.images.arcpublishing.com/morningstar/6ZMXY4RCRNEADPDWYQVTTWALWM.jpg)
:quality(80)/s3.amazonaws.com/arc-authors/morningstar/1aafbfcc-e9cb-40cc-afaa-43cada43a932.jpg)