
Gotta Catch This Muni CEF
Nuveen Municipal Value is one of our top picks, despite a recent manager change.

Municipal closed-end funds have been one of this year's top-performing asset classes. Yet choosing one of these funds can be daunting given the complexities of both the municipal market and the CEF structure. The following is an excerpt from our latest Fund Analyst Report for
Nuveen Municipal Value retains a Morningstar Analyst Rating of Bronze following a change in leadership. The fund is supported by a deep and experienced investment team and a strong process and boasts a solid performance record, all of which support the Bronze rating.
Former manager Tom Spalding, who had been leader here since the fund’s 1987 inception, retired at the end of May 2016. He was replaced by Dan Close, who joined Nuveen in 2000 and has been a portfolio manager since 2007. While Spalding's departure is a loss, Close is experienced in his own right. He is comanager on the firm's Build America Bond funds and lead manager on a number of single-state muni funds. Nuveen has also indicated that nothing about the fund's process will change, which should contribute to a smooth transition.
The fund is backed by a large and experienced team, and Nuveen is an industry leader in both the muni and CEF markets. While the fund is more aggressive than many open-end fund peers, its limited use of leverage, large size, and liquidity on the secondary market make it more stable than most CEF peers.
Because the fund has a closed capital structure, the team is more willing to take on interest-rate and credit risks than many managers of open-end muni funds. As of May 2016, nearly 40% of the fund had a maturity of 20 years or more and almost one fifth of the fund was in BBB and junk-rated bonds. While Nuveen is generally comfortable taking measured risks, it will often match those risks against higher-quality or more-liquid assets. For example, this fund balances its riskier zero-coupon and tobacco bonds with high-quality callable bonds that help the portfolio remain liquid.
Performance The fund's performance has been impressive. At first glance, it trails its CEF peers, but that is a result of their extensive use of leverage. The fund's leverage stood at 1.4% as of May 31, 2016. This number has fluctuated between 1% and 2% during the past year, and the fund is allowed up to 10% leverage. New lead manager Dan Close has indicated that leverage will remain in the low single digits, in contrast to many peers that are leveraged 20%-30%.
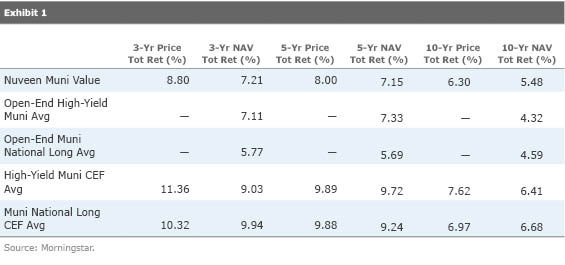
Compared with a more appropriate peer group of unleveraged, no-load mutual funds and CEFs, the fund has consistently outperformed. It ranked in the top 10% of that peer group over the trailing five- and 10-year periods through May 2016, returning 7.0% and 5.3% annualized, respectively, over the respective periods.
Exhibit 1 shows the CEF's performance versus both open-end and closed-end peers.
Despite our overall neutral view of Nuveen as a parent company, we believe its stewardship of its muni CEFs has been exemplary. Of note, the board of directors has been very active consolidating similar funds, conducting shelf offerings, and bringing distributions in line with earnings, all of which benefit long-term shareholders.
Valuation As of early July 2016, Nuveen Municipal Value was trading at a small 0.84% premium. This is in contrast to the previous three years, when the fund traded at an average discount of 3.8%. The discount began to close rapidly in early 2016 and eventually turned into a premium. While the fund looks expensive compared with the trailing three years, the current premium is more reasonable compared with the past five and 10 years. For example, the fund's five-year z-statistic is 1.2, while its 10-year z-statistic is only 0.6. Though it might be tempting to wait until the fund again trades at a discount to start a position, the current premium is not unreasonable by historical standards and we do not advocate buying CEFs solely for their discounts. Investors should be comfortable with the fund's process and long-term role in their portfolios.
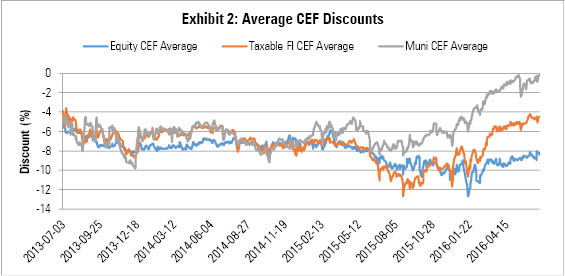
Discount Trends Nuveen Municipal Value's narrowing discount trend is similar to that of other muni CEFs. The average share price of muni CEFs continued on its impressive year-to-date rally in June. The average muni CEF was trading at par at the end of the month. It's the first time the average fund has traded at par since early 2013. The share prices of muni CEFs have been driven higher by strong demand for tax-free yields amid the continued sinking of interest rates. Taxable-bond CEFs have rallied, too, but still remain at an average discount of close to 5%. That's still an improvement over the almost 10% average discount at which they began the year. Taxable-bond CEFs tend to take on more credit risk than muni CEFs, which could help explain why they haven't rallied as close to par, with concerns over the strength of the economy being a key driver of the lower yields.
Exhibit 2 shows the three-year average discount for taxable-bond, equity, and muni CEFs.
Source: Morningstar
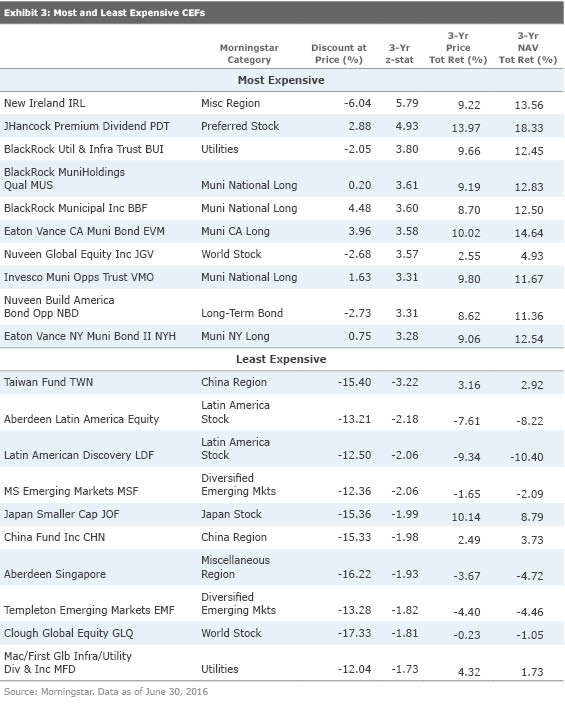
Most Overvalued and Undervalued CEFs The search for yield continues to be a common theme across the most overvalued CEFs based on three-year z-statistics. We use a z-statistic to measure whether a fund is "cheap" or "expensive." As background, the z-statistic measures how many standard deviations a fund's discount/premium is from its three-year average discount/premium. For instance, a fund with a z-statistic of negative 2 would be 2 standard deviations below its three-year average discount/premium. Funds with the lowest z-statistics are classified as relatively inexpensive, while those with the highest z-statistics are relatively expensive. We consider funds with a z-statistic of negative 2 or lower to be "statistically undervalued" and those with a z-statistic of 2 or higher to be "statistically overvalued." That said, the z-statistic does have its flaws.
The majority of the 10 most overvalued CEFs are muni offerings. The three-year z-statistic for these funds could be slightly deceiving. As we mentioned last month, the past three years have been unusually volatile for muni CEFs. On a three-year basis, the average muni CEF z-statistic is 2.22, but over five- and 10-year time frames, it's less than 1, which indicates the overall group is more or less fairly valued.
Exhibit 3 shows the 10 most over- and undervalued CEFs as of July 1.
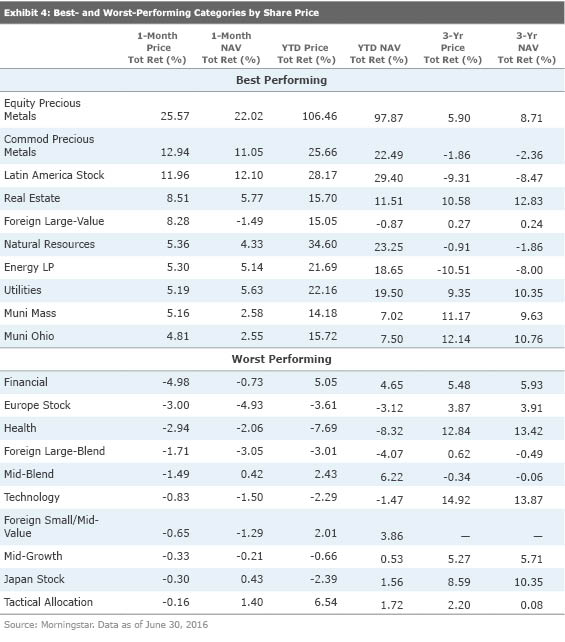
Best- and Worst-Performing CEF Categories Munis were not materially affected by the United Kingdom's vote to leave the European Union, but the surprising result did have significant ramifications elsewhere in CEFs. Financials and European equity CEFs saw the biggest one-month drops, shedding 5% and 3% of share price, respectively. European equities and foreign large-blend CEFs suffered the steepest net asset value losses, losing 5% and 3%.
The uncertainty the vote caused was a boon to equity and commodity precious metals. Equity precious metals CEFs gained 25% in share price for the month and have now more than doubled in value for the year to date.
Exhibit 4 shows the best- and worst-performing CEF categories ranked by share price return in June.
Conclusion Muni CEFs stole the spotlight in the first half of the year. Low interest rates in the United States and abroad have left munis as one of the few asset classes that offer both high-quality credit and relatively enticing yields. For long-term investors, muni CEFs like Nuveen Municipal Value continue to be an attractive option even after this year's strong rally in share prices.
Kathryn Wing contributed to this article.

 United States