
Busting the Myth That Active Funds Do Better in Bear Markets
Investors should focus on the long-term signals, pick their spots, and keep a close eye on costs, based on analysis from Morningstar's midyear Active/Passive Barometer.
/s3.amazonaws.com/arc-authors/morningstar/a90ba90e-1da2-48a4-98bf-a476620dbff0.jpg)
The coronavirus sell-off and subsequent rebound tested the narrative that active funds can navigate market volatility better than their index peers. The midyear installment of the Morningstar Active/Passive Barometer looks at active funds' performance through the first half of 2020 and shows that there's little merit to this notion. Morningstar Direct clients can download the full report.
Across the 20 Morningstar Categories examined in this latest report, 51% of active funds both survived and outperformed their average index peer during the first half of the year. Active funds' performance was neither categorically better nor worse than that of their index peers during this period.
When viewed as a whole, active funds had a roughly 50/50 chance of succeeding during the year's first half, although results varied widely across asset classes and categories. For example, actively managed U.S. stock funds didn't fare as well as foreign-stock funds. Just 48% of the former cohort outgained their average passive peer in the first six months of 2020, while nearly 60% of the latter group did.
Overall, active bond funds' showing was relatively poor. From January through June, 40% of active funds in the intermediate core bond, corporate-bond, and high-yield bond categories both lived and beat their average passive counterpart. Many bond funds were caught offside in a period that punished credit risk and rewarded interest-rate risk as credit spreads widened and rates fell.
But six months isn't a sufficient time horizon for investors to draw conclusions regarding their odds of partnering with successful active managers, as their success rates are very noisy over short time frames. They can fluctuate wildly from year to year, depending on what's going on in the markets and how that reflects on the systematic biases in their portfolios as well as in the indexes we measure them against. For example, many active bond funds tend to take more credit risk than their indexed peers. Their success rates tend to rise when this risk is rewarded and fall when credit markets are roiled, as they were earlier this year.
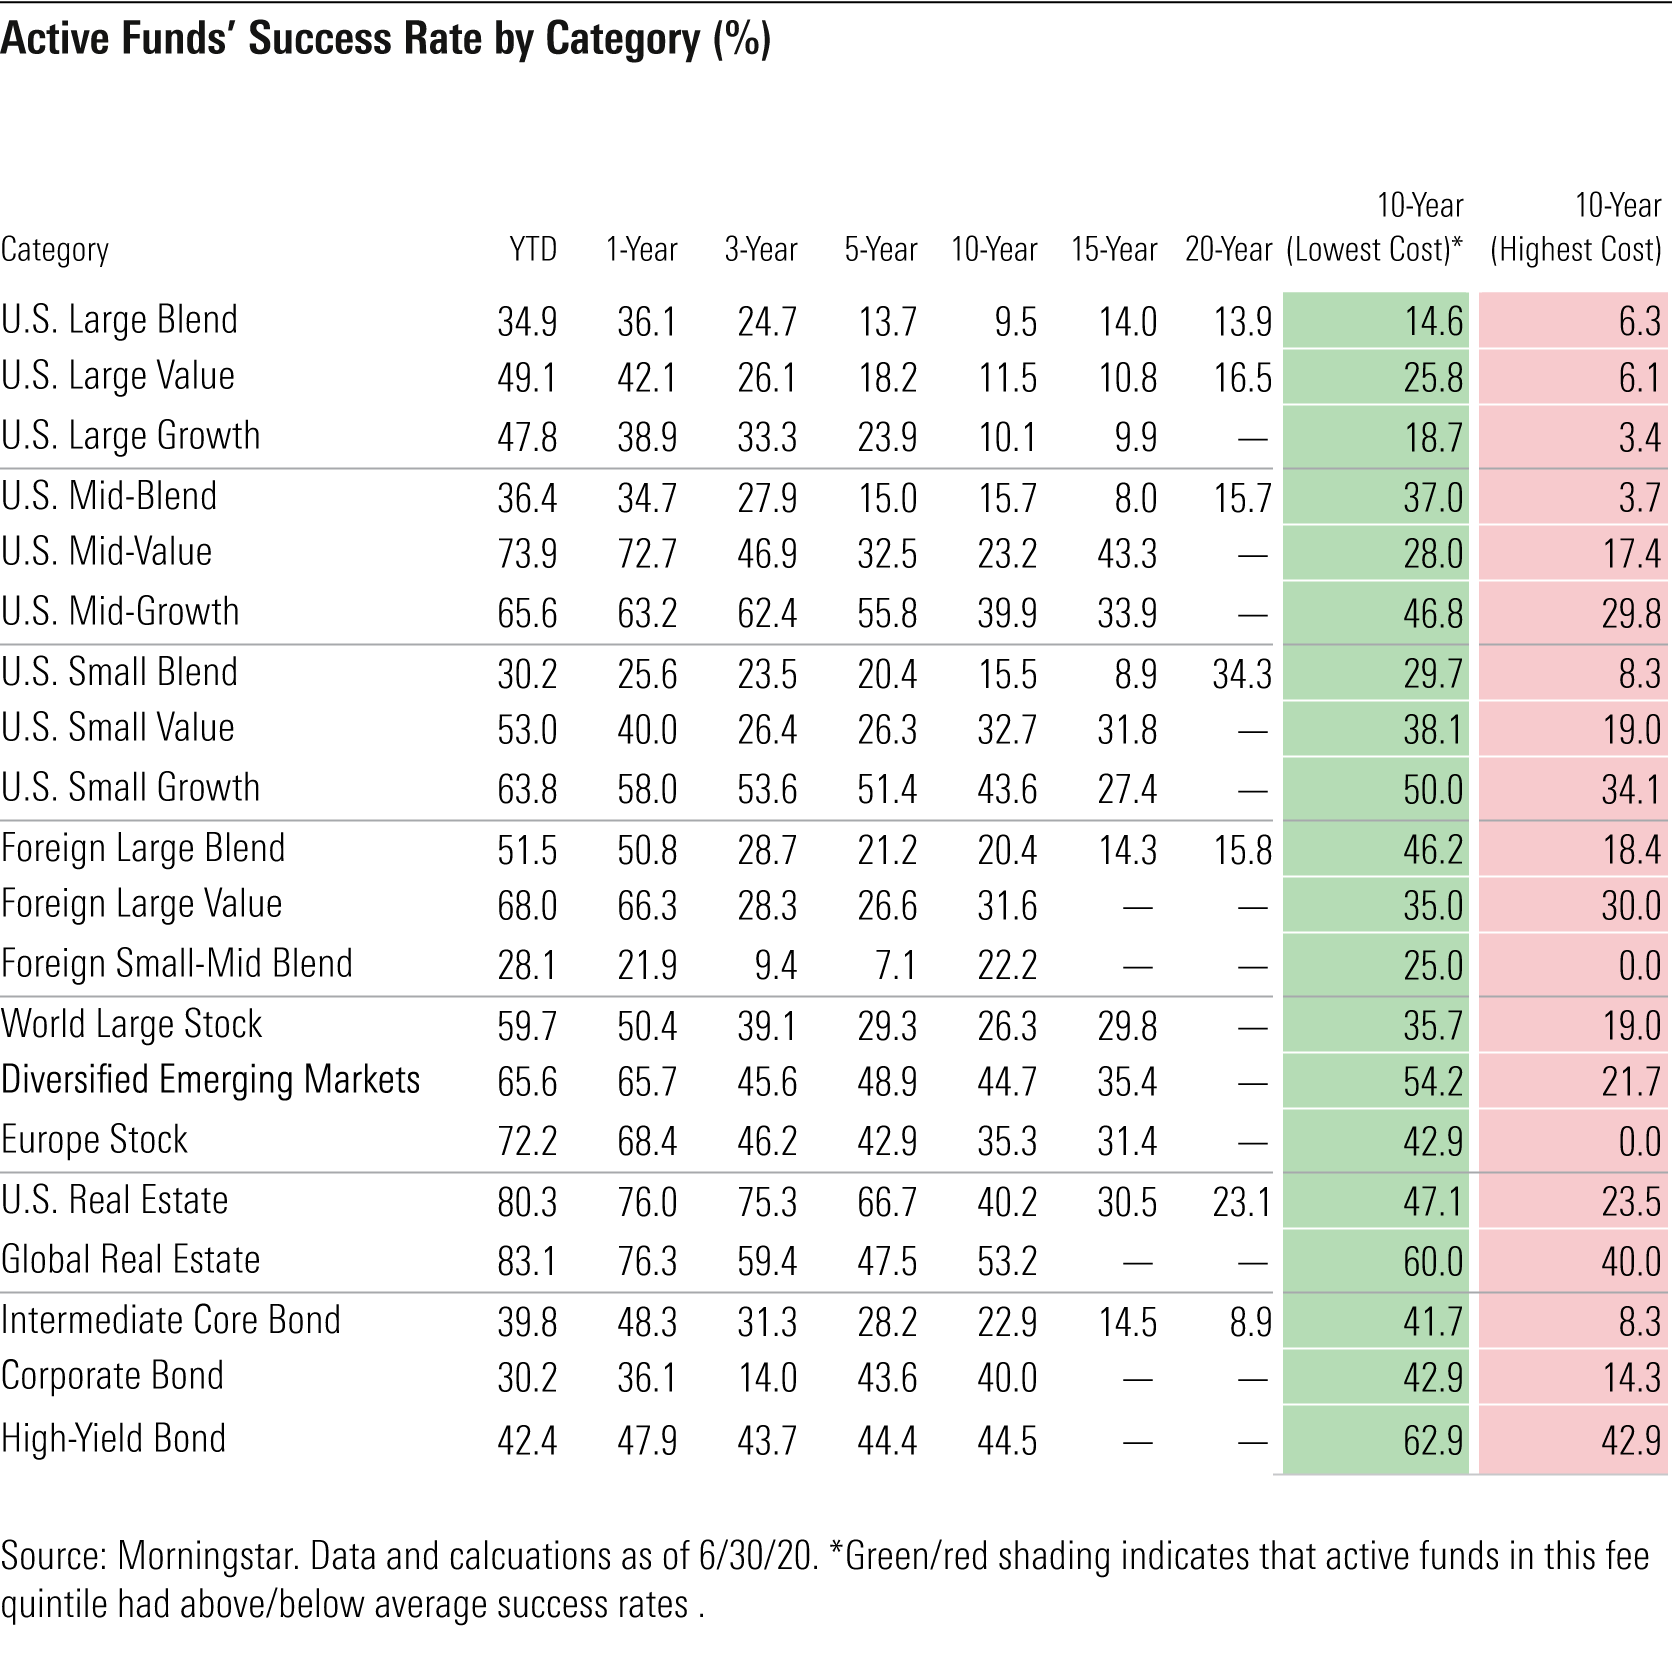
Looking back over longer horizons yields useful signals--data that investors can put into practice while selecting active funds. In general, actively managed funds have failed to survive and beat their benchmarks, especially over longer time horizons. Only 24% of all active funds topped the average of their passive rivals over the 10-year period ended June 2020.
However, success rates vary across categories. Long-term success rates were generally higher among foreign-stock, real estate, and bond funds and lowest among U.S. large-cap funds. Investors can use this data to home in on areas of the market where they have better odds of picking winning funds.
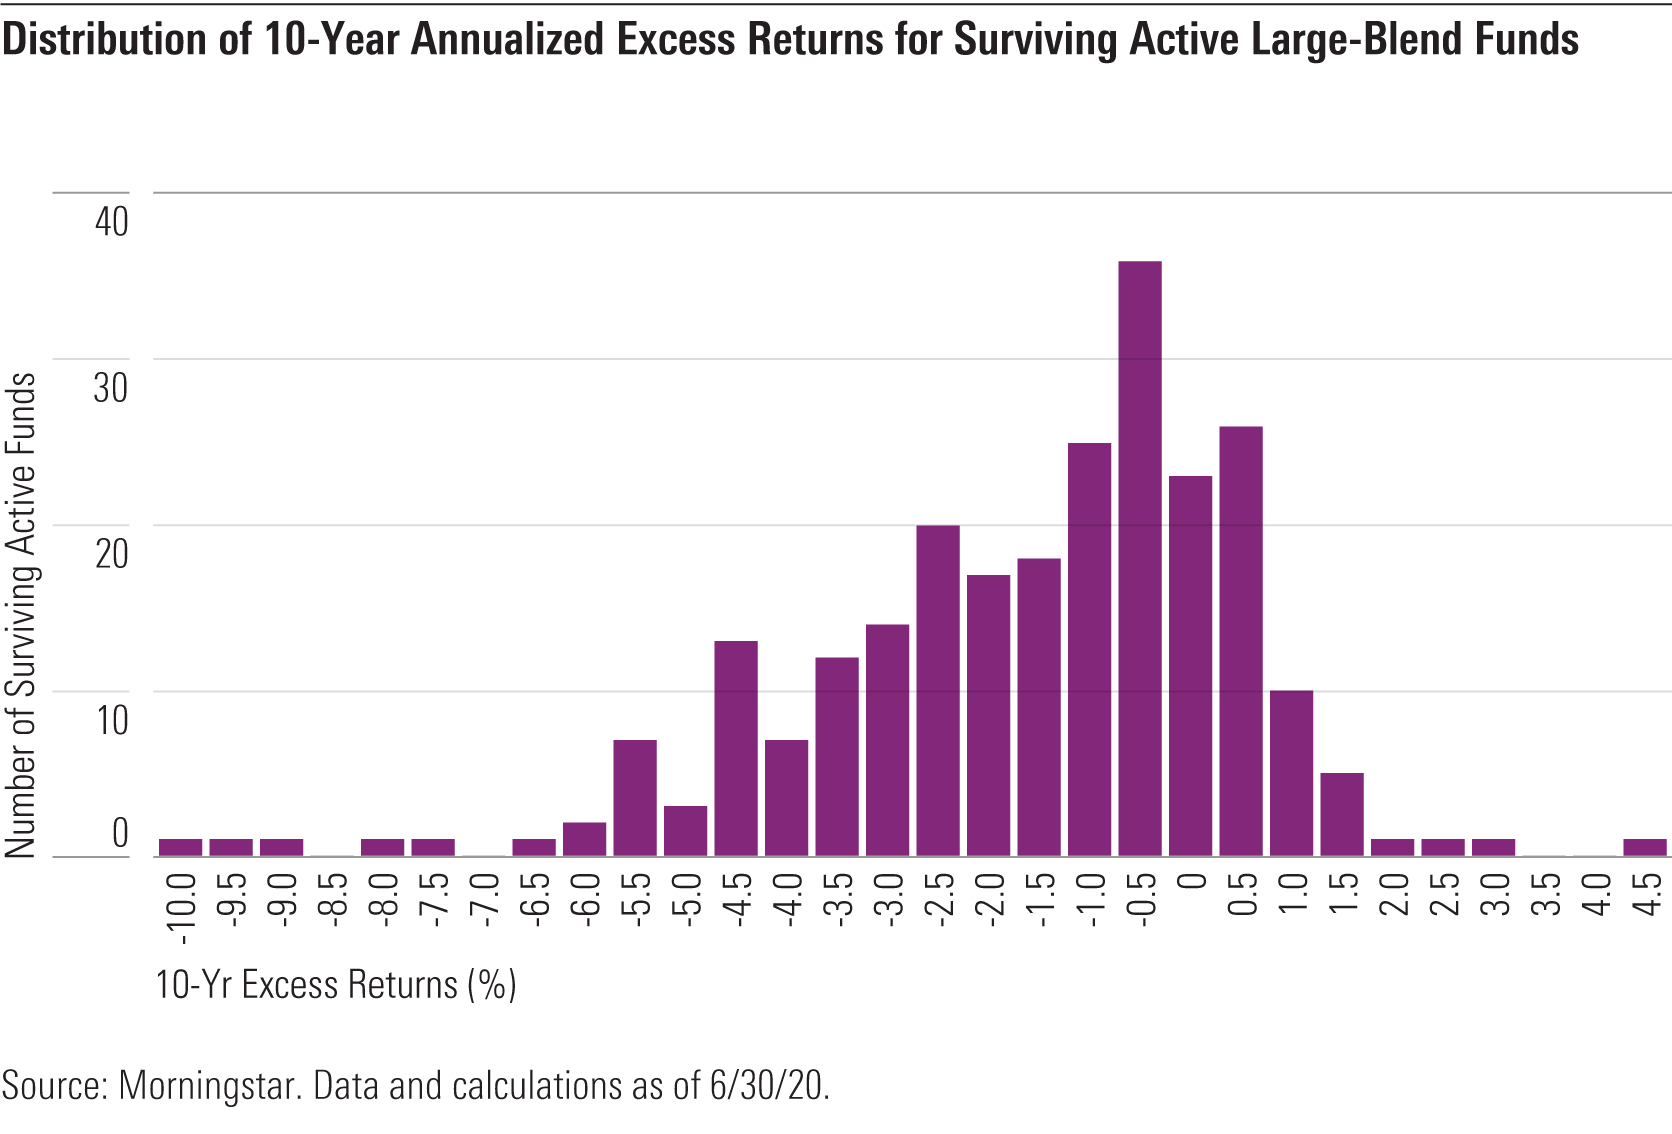
Sizing the Payoffs and Penalties Investors should understand the chances of finding a successful active fund as well as the size of the prospective payout for picking a winner and the penalty for landing on a loser. The Active/Passive Barometer contains this information in the form of plots of the distribution of 10-year excess returns for surviving active funds versus the average of their passive peers.
Much like success rates, these distributions vary widely across categories. In the case of U.S. large-cap funds, the distributions skew negative. When considered in conjunction with the low long-term success rates in these categories, this is an indication that the likelihood (as measured by their success rates) and performance penalty (as manifest in the negatively skewed distribution) for picking an underperforming manager tends to be greater than the probability and reward for finding a winner.
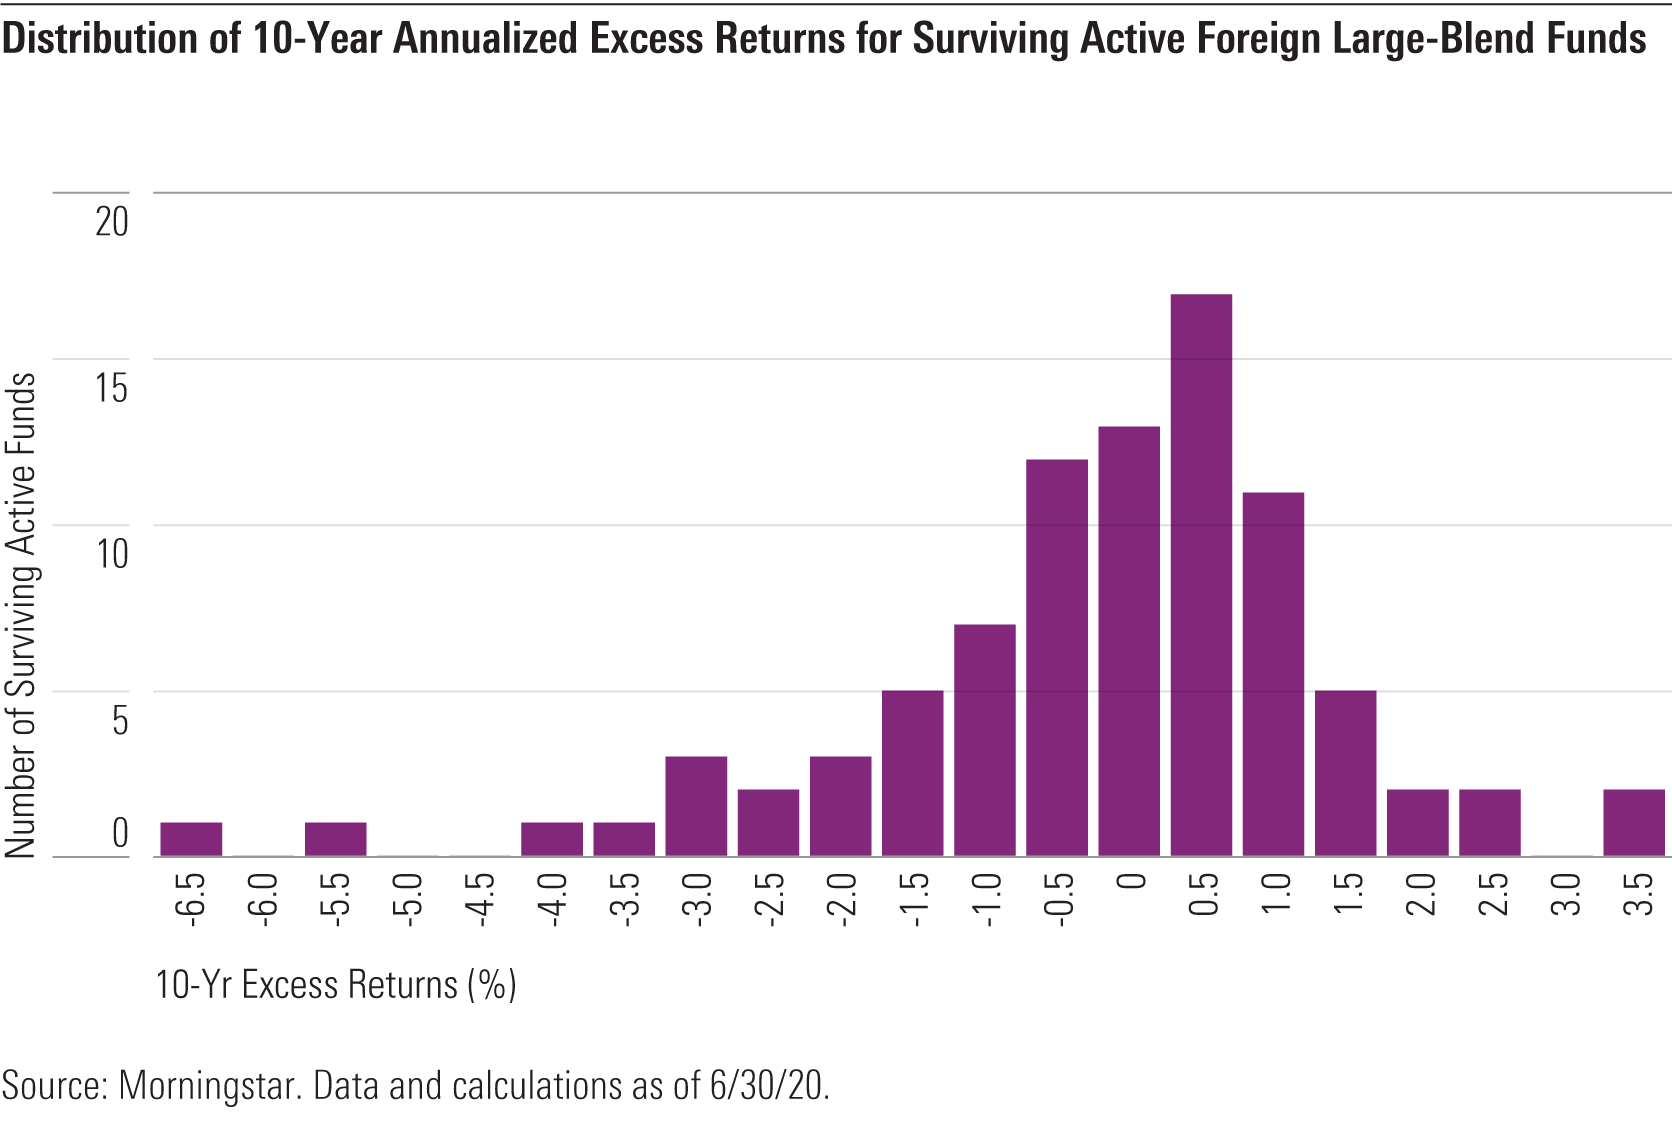
The inverse tends to be true of the fixed-income and foreign-stock categories examined, where long-term success rates have generally been higher and excess returns among surviving active managers skewed positive over the past decade. Exhibits 2 and 3 show the distributions of excess returns for surviving active funds from the large-blend and foreign large-blend categories.
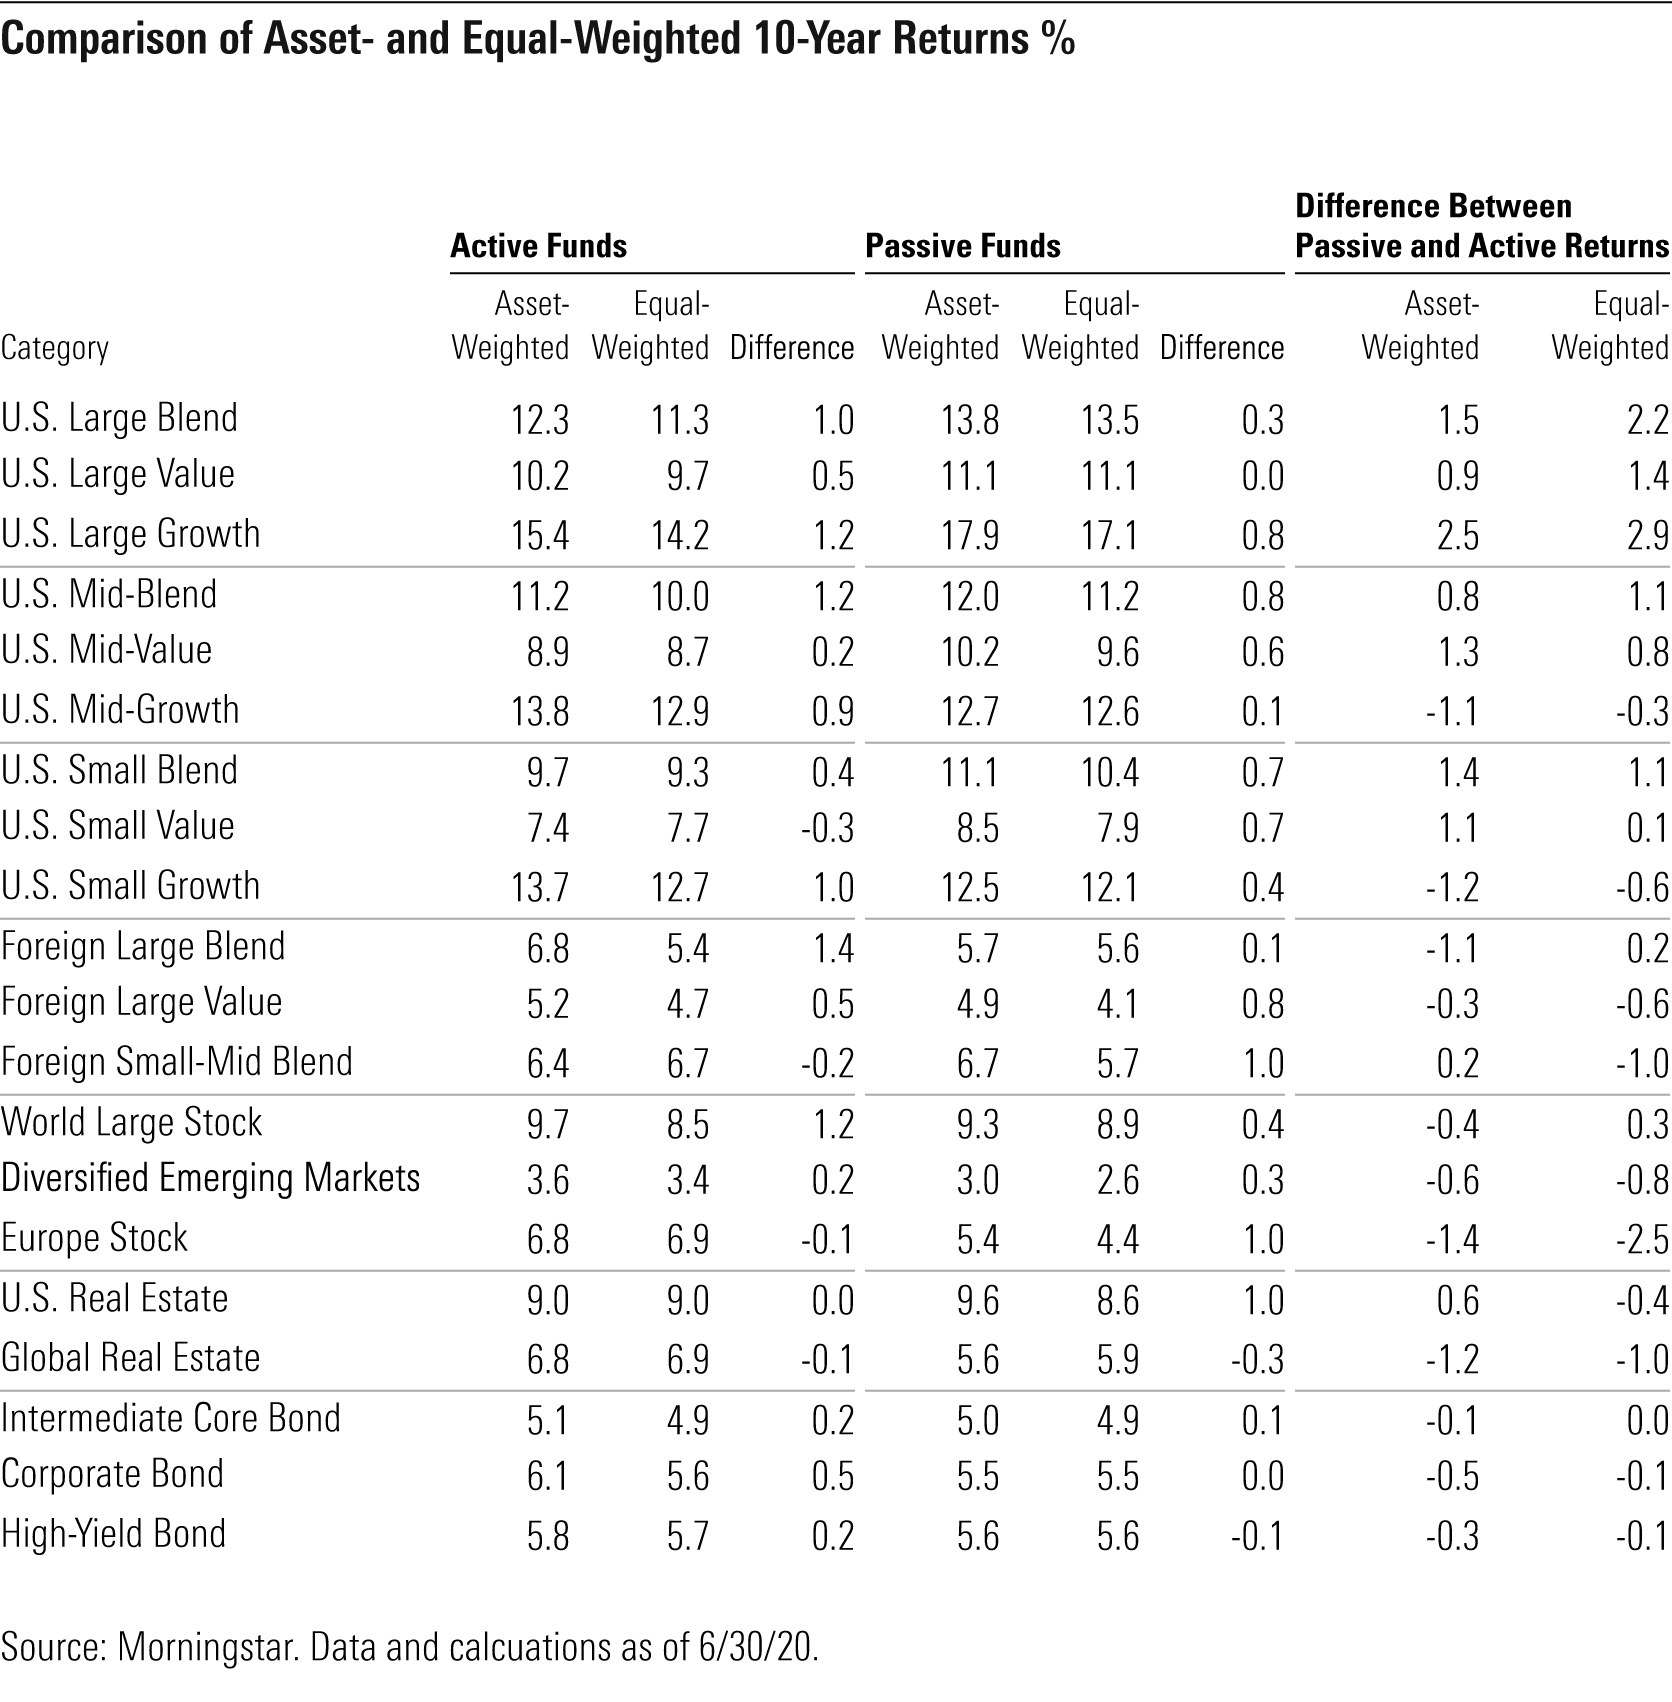
Most Investors Choose Above-Average Funds All averages have their flaws. And it is a flawed assumption that investors pick average funds.
Indeed, the data shows that the average dollar invested in active funds (asset-weighted average return) outperformed the average active fund (equal-weighted average return) in all but four categories over the past 10 years. This implies that investors have favored cheaper, higher-quality funds.
However, the average dollar in active funds does not always do better than the average dollar invested in passive ones. Looking at the difference between asset-weighted returns for active and passive funds can give investors a sense of where they've been best served by active managers.
The second column from the right in Exhibit 4 shows these figures for the 10-year period through June 2020. In general, investors fared better with index funds than active ones in U.S. stock categories and with active funds in fixed-income and foreign stock categories.
Costs Matter The signal that rings loud and clear in this data set is that fees matter. The cheapest funds succeeded about twice as often as the priciest ones (34% success rate versus 16% success rate) over the 10-year period ended June 30, 2020. This not only reflects cost advantages but also differences in survival, as 65% of the cheapest funds survived, whereas 49% of the most expensive did so.
If there's one near-certainty in investing, it is "you get what you don't pay for," as the Vanguard's late founder Jack Bogle said.
This article is adapted from research that was originally published in Morningstar Direct's Research Portal. If you're a user, you have access. If not, take a free trial.
/cloudfront-us-east-1.images.arcpublishing.com/morningstar/T2LGZCEHBZBJJPPKHO7Y4EEKSM.png)
/d10o6nnig0wrdw.cloudfront.net/07-25-2024/t_56eea4e8bb7d4b4fab9986001d5da1b6_name_file_960x540_1600_v4_.jpg)
/cloudfront-us-east-1.images.arcpublishing.com/morningstar/BU6RVFENPMQF4EOJ6ONIPW5W5Q.png)
:quality(80)/s3.amazonaws.com/arc-authors/morningstar/a90ba90e-1da2-48a4-98bf-a476620dbff0.jpg)