
Overview of the Morningstar Quantitative Rating for Funds
What is it, and what can it do for you?
/s3.amazonaws.com/arc-authors/morningstar/2ecd3ee2-4114-482f-836f-1872f2a7769a.jpg)

The Morningstar Quantitative Rating for funds provides investors with a forward-looking aptitude test. Designed to be philosophically analogous to the Morningstar Analyst Rating, MQR expands the coverage universe by nearly 10-fold. Seeking to identify funds that will outperform their category benchmark on a risk-adjusted basis over a full market cycle, the Morningstar Analyst Rating and MQR aim to uncover investment strategies with a competitive advantage.
To make an assessment, the Analyst Rating and the MQR evaluate funds on three pillars: People, Process, and Parent. These inputs, combined with the relative opportunity set, are used to calculate the fund’s expected gross alpha. Since a fund’s fees can vary by share class, net-of-fee expected alpha and the Overall Rating can stray by share class type for a single fund. Overall Ratings are divvied up into five distinct buckets: Gold, Silver, Bronze, Neutral, and Negative. Share classes with a negative net expected alpha can only receive a Neutral or Negative rating, and those with a positive net expected alpha can garner a medal (Gold, Silver, or Bronze). The breakpoints for these expected alpha producers are determined by a share class’ relative rank within its Morningstar Category—the top 15% earn a Gold, the next 35% earn a Silver, and the remaining 50% earn a Bronze. Higher ratings, therefore, signify greater confidence in the fund’s ability to outperform.
Assigning Morningstar Quantitative Pillar Ratings
When the MQR was created, historical analyst pillar scores were aggregated and fed into the model. In total, 180-plus attributes and 10,000-plus rating updates were considered in order to train the random forest model. After numerous iterations, only the attributes most crucial to classifying each pillar score were retained.
Each pillar rating is estimated using a random forest model. The output for these pillar models is a prediction on a scale of 0 to 1. The closer to 1 a fund’s estimated pillar rating is, the more likely that the true pillar rating is High or Above Average. Similarly, the closer to 0 a fund’s estimated pillar rating is, the more likely that the true pillar rating is Below Average or Low. The probabilities are translated into five ratings to match the analyst Pillar ratings: High, Above Average, Average, Below Average, Low.
These quantitative pillar scores are Parent, People, and Process, and each is determined by its own unique machine-learning model. This degree of specificity increases our ability to replicate analyst output by allowing for each pillar to be determined by a unique subset of data points.
The Parent Pillar represents Morningstar’s assessment of the stewardship quality of a firm. The model considers data points such as manager retention, fees, and the firm’s historical performance.
The People Pillar represents Morningstar’s assessment of management’s talent, tenure, and resources. The model considers data points such as the number of months since a management change and manager excess return.
Finally, the Process Pillar represents Morningstar’s assessment of a fund’s investment strategy and management’s ability to successfully execute this strategy over time. The model considers data points related to a fund’s investment strategy, such as the percentage of a fund’s assets in its top 10 holdings, whether the fund tracks an index, and several fee-related metrics.
The uniqueness of the data points used to predict each Pillar Rating illustrates the benefits of pillar-specific models. The above examples represent data points that are commonly considered by each model, but influential data points vary based on fund-specific circumstances. For a full list of data points that are used to train each model, see the Input Data Methodology document linked in this article’s References.
Off to a Strong Start
The Quantitative Rating has delivered so far. It is regularly evaluated in terms of how well it predicts the future success of funds relative to their peers. Exhibit 1 shows the results of a study where the fund universe was grouped into distinct buckets based on Quantitative Ratings. Bucket returns were determined by compiling each underlying fund’s return minus its category average return. There is clear, monotonic sorting of the five possible rating assignments by performance--Neutral-rated funds outperform Negative-rated, Bronze outperform Neutral, and so on.
Exhibit 1: MQR Efficacy Study
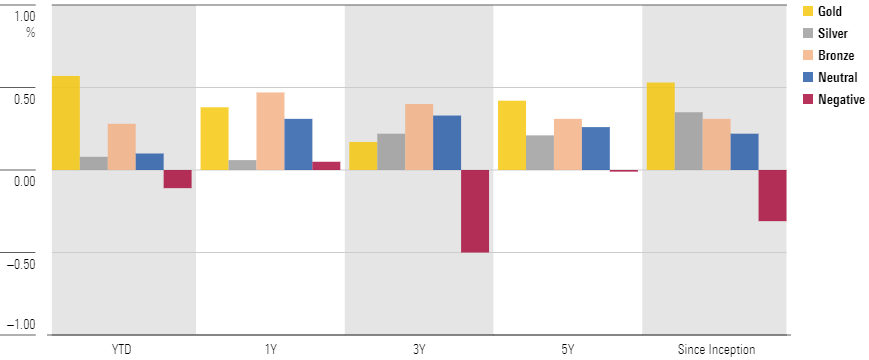
- source: Morningstar Analysts
The Quantitative Rating for funds is a viable tool for investors and an acceptable substitute when Morningstar Analysts do not cover a fund. There are unknowns. For example, it launched in 2017 and has not experienced a prolonged market downturn, so its performance in one is unknown. The Morningstar Quantitative Rating will continue to grow and improve. Coverage has increased fifteen-fold since its launch and the methodology will be updated based on data-driven studies.
/cloudfront-us-east-1.images.arcpublishing.com/morningstar/24UPFK5OBNANLM2B55TIWIK2S4.png)
/d10o6nnig0wrdw.cloudfront.net/04-25-2024/t_29c382728cbc4bf2aaef646d1589a188_name_file_960x540_1600_v4_.jpg)
/cloudfront-us-east-1.images.arcpublishing.com/morningstar/T2LGZCEHBZBJJPPKHO7Y4EEKSM.png)
:quality(80)/s3.amazonaws.com/arc-authors/morningstar/2ecd3ee2-4114-482f-836f-1872f2a7769a.jpg)