
4 Options-Based ETFs That Offer Something New
New ETFs are cheaper and more flexible than most buffer ETFs.
/s3.amazonaws.com/arc-authors/morningstar/5db00d6b-9c2f-4da7-8f94-da4290cf3b4a.jpg)
Define Your Outcome
Defined-outcome ETFs, also known as “buffer ETFs,” deliver investors a predefined range of outcomes over a set period. This range is determined by equity market performance and the options contracts that underlie each ETF. Depending on the strategy, this range is usually narrower than a basic 60/40 portfolio. This predictability of returns allows investors to easily evaluate the product’s risk/return characteristics, driving considerable interest in this group of options-based ETFs.
Assets in Defined-Outcome ETFs Climb Higher
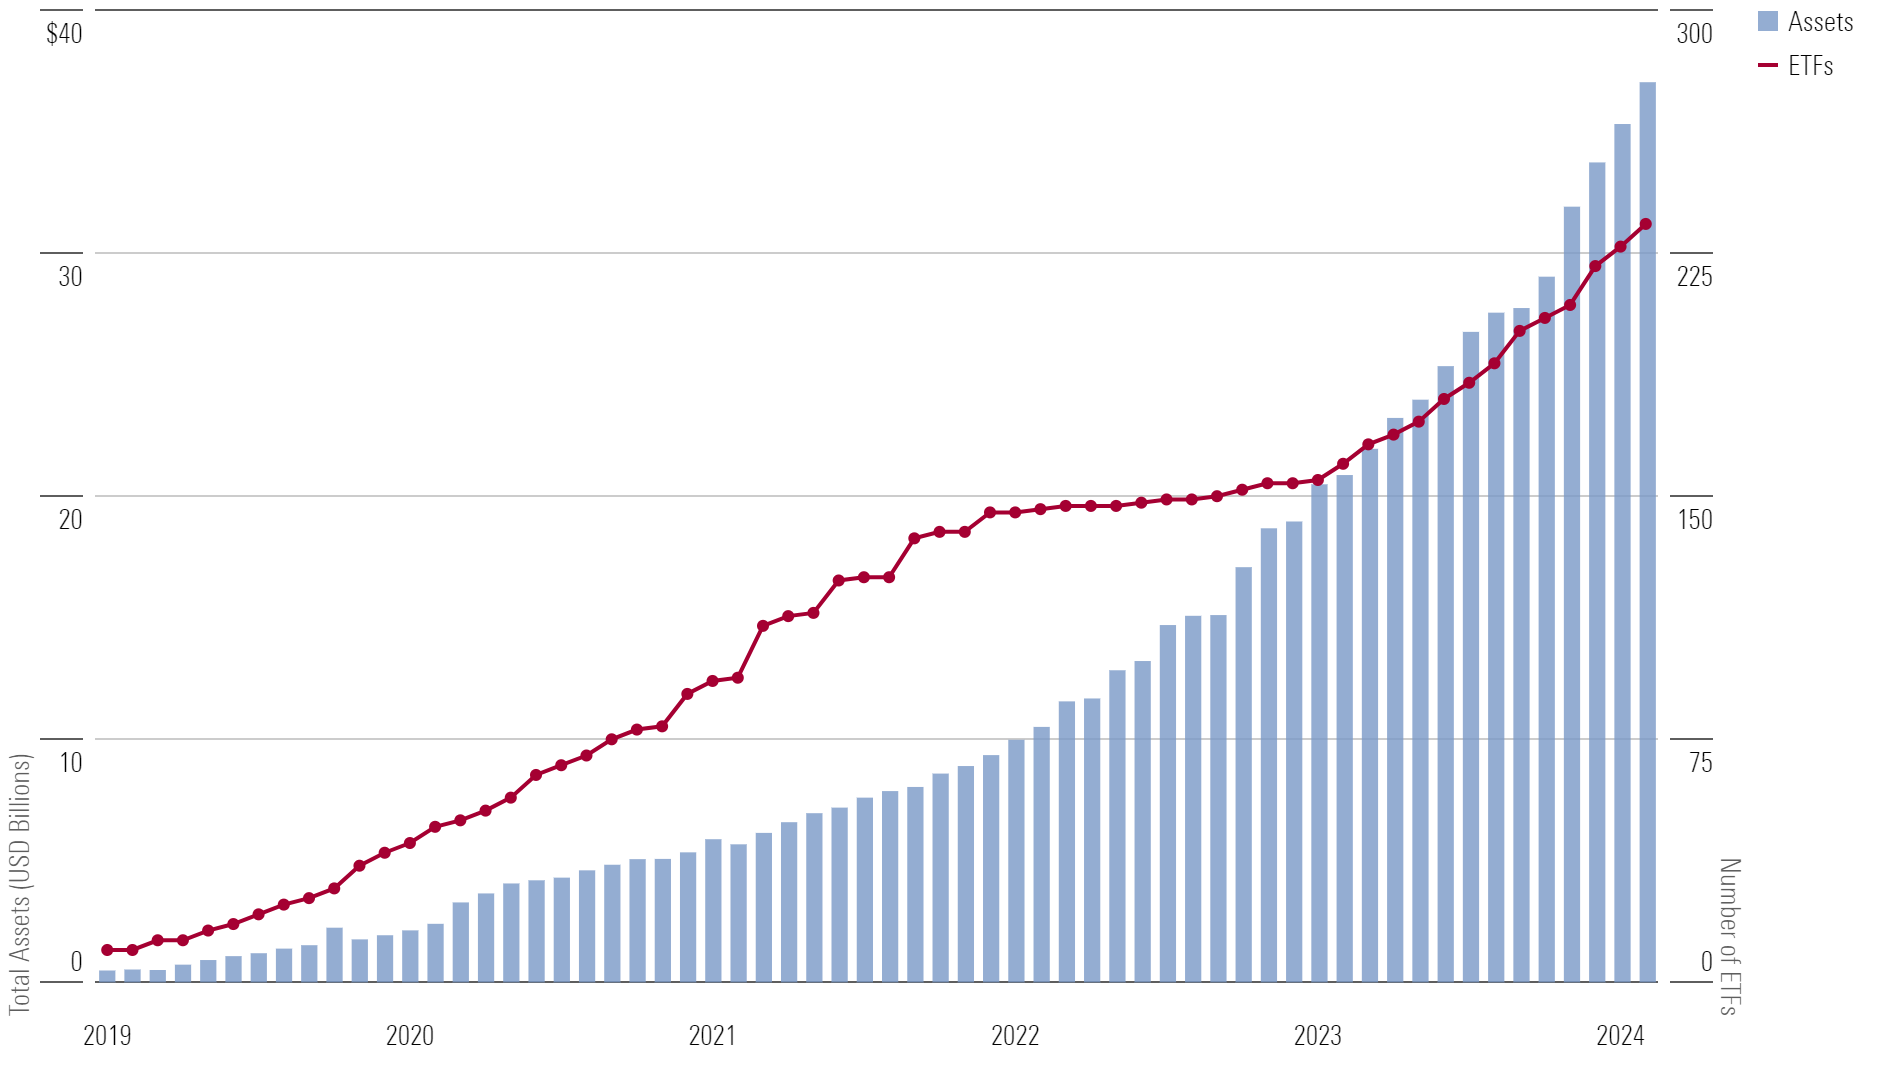
The key to achieving performance within the defined range is investing on the first day of the outcome period and holding throughout it. These ETFs often use 12-month options contracts to create an annual downside buffer and upside cap. The buffer and cap, expressed as percentages away from the period’s starting price, match the advertised amount only if purchased on the first day of the outcome period—usually the first business day of a given month, as stated on a provider’s website.
To give investors more opportunities to join at the start of an outcome period, many defined-outcome ETF providers offer the same product structure but with outcome periods beginning every month. For example, investors can purchase any one of 12 Innovator U.S. Equity Buffer ETFs and be protected from the first 9% of S&P 500 losses with each. BAPR, the April series of that strategy, should be purchased on April 1 and held through March 31 of the following year.
| Key Stats | BAPR |
|---|---|
| Product Name | Innovator U.S. Equity Buffer ETF April Series |
| Current Outcome Period | April 1, 2023, to March 31, 2024 |
| Annual Fee | 0.79% |
| Equity Exposure | SPDR S&P 500 ETF Trust SPY |
| Starting Cap (annual) | 20.13% |
| Starting Buffer (annual) | 9% (protects against first 9% of SPY losses) |
Source: Innovator ETFs. Starting cap will likely change on April 1, 2024, as a new outcome period begins. Remaining cap and buffer can be found on Innovator’s website.
The requirement to buy and sell the right series at the right time is a limiting factor in the rapid ascent of defined-outcome ETFs. Another limiting factor is cost. The 234 defined-outcome ETFs listed in the US have a median expense ratio of 0.79%, and none charge less than 0.50%—a far cry from the 0.03% fee levied by Vanguard S&P 500 ETF VOO. The advertised buffer level of a defined-outcome ETF is gross of fees, too. This means that with its 0.79% fee, BAPR investors would still lose roughly 0.79% even while protecting against losses if the S&P 500 falls up to 9% in a year.
Overall performance will always be hamstrung by high fees.
Adding Flexibility, Losing Definition
Defined-outcome ETF providers have recognized the issue with static defined-outcome periods and have attempted to address it. The two largest providers in the space, Innovator and First Trust, offer ETFs that hold all 12 monthly series of a given defined-outcome strategy. For example, Innovator Laddered Allocation Buffer ETF BUFB holds BAPR and the 11 other monthly U.S. Equity Buffer ETFs with a designed 9% buffer. This fund-of-funds structure removes the need to invest at the beginning of a given month and hold for a full year, giving investors greater flexibility to enter and exit the products while still realizing the 9% protection level. The drawbacks, though, are even-higher fees and a fluctuating upside cap.
Defined-outcome ETFs with a fund-of-funds structure usually charge a higher fee than their monthly constituents: BUFB charges 0.89% to BAPR’s 0.79%. They also lack the fixed cap of a monthly product. Since these products roll into and out of each monthly ETF (each of which has a different cap rate), the cap rate realized will change dynamically based on market conditions.
- High implied volatility = high upside cap
- Low implied volatility = low upside cap
For the 12 constituents of BUFB, their starting upside caps range between 16% and 21% annually. The upside cap of BUFB would fall somewhere in between, but the exact value is not stated publicly and will change every month, removing a little definition from these defined-outcome ETFs.
New Options-Based ETFs
The options-based and defined-outcome ETF space is continually evolving. Sixty-seven defined-outcome ETFs launched in 2023 alongside countless more options-based ETFs. Large ETF incumbents like iShares entered the space for the first time, too. Of those launches, four caught my attention:
- iShares Large Cap Deep Buffer ETF IVVB
- iShares Large Cap Moderate Buffer ETF IVVM
- JPMorgan Hedged Equity Laddered Overlay ETF HELO
- Parametric Hedged Equity ETF PHEQ
All four are considerably cheaper than most defined-outcome ETF offerings. And the latter two are one-ticker solutions that solve the timing problems for single-month issues.
The iShares ETFs are BlackRock’s first foray into the defined-outcome ETF market. The funds are actively managed to protect against index losses between 5% and 20% for IVVB and the first 5% of equity market losses for IVVM. The protection levels of each apply to every calendar quarter, making their outcome period one quarter.
Most defined-outcome ETFs have an outcome period of a full year. To realize performance within the bounds of the iShares ETF design, an investor should still be mindful of the beginning and end of each outcome period. The current outcome period ends on April 2, 2024, and April 1, 2024, respectively, for IVVB and IVVM.
| Key Stats | IVVB | IVVM |
|---|---|---|
| Product Name | iShares Large Cap Deep Buffer ETF | iShares Large Cap Moderate Buffer ETF |
| Outcome Period | One quarter, fixed | One quarter, fixed |
| Annual Fee | 0.50% | 0.50% |
| Equity Exposure | iShares S&P 500 ETF IVV | iShares S&P 500 ETF IVV |
| Starting Cap (quarterly) | 6.23% | 4.90% |
| Starting Buffer (quarterly) | 5% to 20% | 5% |
Source: iShares. Starting cap will likely change on April 3, 2024 (IVVB) and April 2, 2024 (IVVM) as a new outcome period begins. Remaining cap and buffer can be found on iShares’ website.
The offerings from JPMorgan and Parametric go beyond the defined-outcome ETF label but behave in much the same way. Both are variations of a similar hedged equity strategy—a strategy that has found both firms considerable success outside of ETFs. The objective is the same as most defined-outcome ETFs: some downside protection with limited upside.
What’s different from most defined-outcome ETFs is that they’re actively managed to maximize tax efficiency while also using varied strike prices and contract expirations to maintain consistent downside protection and smooth equity exposure through most market conditions. By laddering the options expirations, the outcome period is continuous, giving investors more flexibility when buying or selling the ETF.
Both ETFs also charge a lower fee than many existing defined-outcome or options-based ETFs. HELO charges 0.50%, while PHEQ is notably cheaper at 0.29%.
| Key Stats | HELO | PHEQ |
|---|---|---|
| Product Name | JPMorgan Hedged Equity Laddered Overlay ETF | Parametric Hedged Equity ETF |
| Outcome Period | One quarter, not fixed | One year, not fixed |
| Annual Fee | 0.50% | 0.29% |
| Equity Exposure | Large-cap US stocks | Largest 500 US stocks |
| Estimated Cap | Approx. 6% (quarterly) | Approx. 13% (annual) |
| Target Buffer | 5% to 20% (quarterly) | 10% to 30% (annual) |
Source: JPMorgan, Parametric, author’s calculations. Data as of March 12, 2024.
Buffer ETFs Are Not Perfect
Representatives from iShares, J.P. Morgan, and Parametric will be the first to tell you their options-based products are not intended to completely replace equity exposure in an investor’s portfolio. Nor are they intended to replace bond exposure. Instead, they’re designed to complement existing exposures and help fine-tune investors’ portfolios to match their risk profiles.
These ETFs do not eliminate risk despite their defined-outcome moniker offering some peace of mind. BAPR can fall by more than 9% in a year. PHEQ investors will still lose 10% if the market falls 10%. These products are correlated to the stock market and are higher-risk than most segments of the bond market.
Costs are also an important consideration. An investor can construct a basic 60/40 portfolio using index ETFs that cost less than 0.05% each. No expense ratio for an options-based ETF approaches the cheapest stock or bond index ETF. Investors must consider what they’re getting for that added cost. Peace of mind is certainly important, but can it be achieved in a more cost-effective way?
This is not to dissuade investing in defined-outcome or hedged equity ETFs. But it’s worth considering whether they indeed complement exposures achieved using more-traditional ETFs. In many cases, investors may be able to achieve similar exposures with cheap index funds and avoid the complexity and higher fees of options-based ETFs altogether. For investors wanting strict guardrails, though, IVVB, HELO, and others may offer them the right solution.
Used correctly, defined-outcome or hedged equity ETFs can benefit some investors, but their use case may be narrower than advertised.
A version of this article appeared in the January 2024 issue of Morningstar ETFInvestor. Click here for a sample issue.
The author or authors do not own shares in any securities mentioned in this article. Find out about Morningstar’s editorial policies.
/cloudfront-us-east-1.images.arcpublishing.com/morningstar/T2LGZCEHBZBJJPPKHO7Y4EEKSM.png)
/d10o6nnig0wrdw.cloudfront.net/07-25-2024/t_56eea4e8bb7d4b4fab9986001d5da1b6_name_file_960x540_1600_v4_.jpg)
/cloudfront-us-east-1.images.arcpublishing.com/morningstar/BU6RVFENPMQF4EOJ6ONIPW5W5Q.png)
:quality(80)/s3.amazonaws.com/arc-authors/morningstar/5db00d6b-9c2f-4da7-8f94-da4290cf3b4a.jpg)