
ETFs Get Even Cheaper
Average fees paid by ETF investors have fallen over the last decade as low-cost options gain popularity and large flows create economies of scale.
/s3.amazonaws.com/arc-authors/morningstar/de44b91c-c918-4e53-81c3-ce84542f3d36.jpg)
A version of this article was published in the April 2016 issue of Morningstar ETFInvestor. Download a complimentary copy of ETFInvestor here.
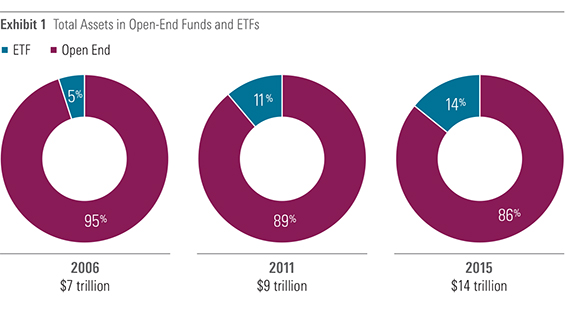
Exchange-traded funds continue to gain market share, thanks in part to their low fees and tax efficiency. During the past decade, total assets in ETFs have risen from $350 billion as of the end of 2006 to $2.1 trillion at the end of 2015, a sixfold increase. During that same time period, total assets in open-end mutual funds and ETFs doubled, reaching $14 trillion by the end of last year. As a result, ETFs' share of the U.S. funds market has increased to 14% from 5% 10 years ago.
But flows into ETFs are only part of the story. ETFs' market share growth can also be attributed to asset class mix. Since 2011, equity ETFs have accounted for about 80% of all ETF assets. Equity funds have accounted for about 60% of all assets in traditional open-end mutual funds, with the remaining 40% of assets primarily in fixed-income and allocation funds. Given the strong outperformance of equities over fixed income during the past few years, ETFs have benefited more from underlying asset-price appreciation.
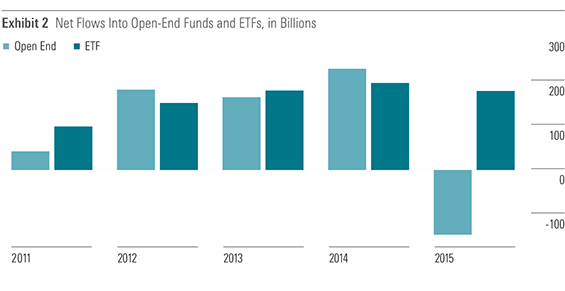
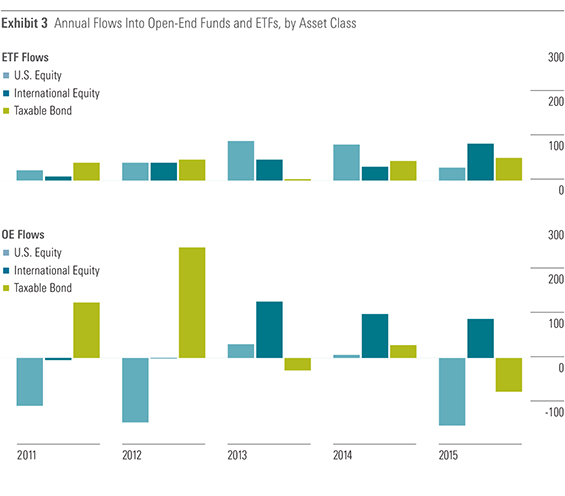
This has been exacerbated by the mix shift away from stock funds among traditional open-end mutual funds; billions of dollars have flowed out of equity funds and into fixed-income funds. Conversely, flows into ETFs across asset classes have been somewhat steady. ETFs' assets also get a slight boost from the fact that some flows go into hot (or strong-performing) areas of the market. For example, there were large flows into U.S. equity ETFs in 2013 and 2014 when markets were rallying. And on the international equity side, a surge in flows in 2015 was driven primarily by flows into currency-hedged ETFs. These types of flows also contribute to performance-related asset growth.
But while certain ETFs are popular as tactical vehicles for making short-term bets, investors are increasingly using them as core holdings. Below is a list of funds that have seen the largest total inflows during the past 10 years. (We note that flows into
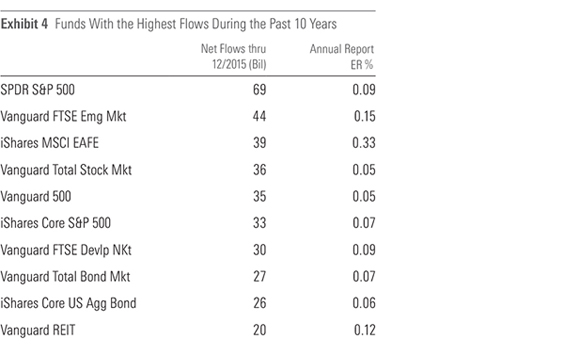
Vanguard dominates the top 10 with six funds, which is notable. This is because Vanguard entered the ETF market in 2001, joining the then-market-dominating iShares and SPDRs, both of which had been offering a fairly broad menu of ETFs for a number of years. As a fund provider, low cost has always been part of Vanguard's DNA, and so it has been no surprise that its ETFs have historically been among the cheapest relative to its ETF category peers. As a result, Vanguard has been able to attract strong flows and grow its market share. During the past decade, its market share has risen to 24% from 6%.

Fees
Overall, fees continue to trend down, to the benefit of investors. During the past decade, the overall asset-weighted average expense ratio for ETFs declined to 0.23% from 0.28%. (When looking at fee trends, it makes more sense to use an asset-weighted average fee, which indicates the average fee an investor is paying. A simple average includes (typically high) outliers that may have very few assets but could skew the average higher.) Flows have definitely contributed to these declines, as investors flock to cheaper funds and as certain fund providers share improving economies of scale (thanks to rising asset levels) to shareholders in the form of lower expense ratios. A very aggressive pricing environment (particularly among Vanguard, iShares, and Schwab) for basic, broad, market-cap-weighted funds has also helped.
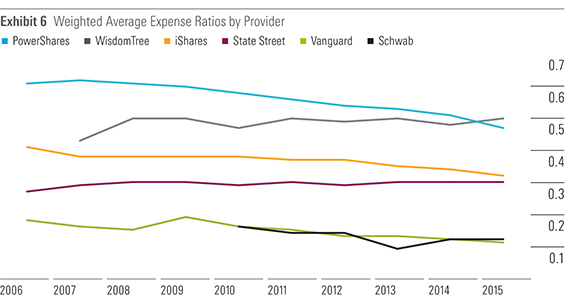
A look at pricing strategies by fund provider adds some color to what has been driving costs lower for investors. Vanguard has generally been the lowest-cost provider (until Schwab entered the market in 2010) and focuses on providing broad core products, such as
IShares historically was not focused on being a low-cost provider of ETFs. But that changed in 2012 when it introduced its Core series. These funds are typically broad core products priced to be competitive with similar offerings from Vanguard. These funds have drawn strong flows, but overall, iShares' market share has remained stagnant since the launch of its Core series, whereas Vanguard's market share has continued to grow. To remain competitive, iShares has continued to increase the number of Core series funds (in 2012 there were 10, now there are 20) and has trimmed fees of some core funds. Outside of its Core series, many of its other products are priced in line with peers. But if the peer group does not include Vanguard, those funds typically are not necessarily "low cost."
State Street, the third-largest ETF provider, has not been very aggressive slashing fees for its ETFs. During the past decade, State Street gradually cut the fees on its eight Select Sector SPDRs to their current 0.15% expense ratio. However, it also raised the expense ratio of
Schwab entered the ETF market in 2010 seeking to be the lowest-cost provider of broad core ETFs and since then has maintained that status by cutting its fees whenever Vanguard or iShares reduces fees on ETFs that directly compete with a Schwab ETF. However, Vanguard and iShares continue to lead Schwab in flows; as of the end of 2015, Schwab's market share was only 2%.
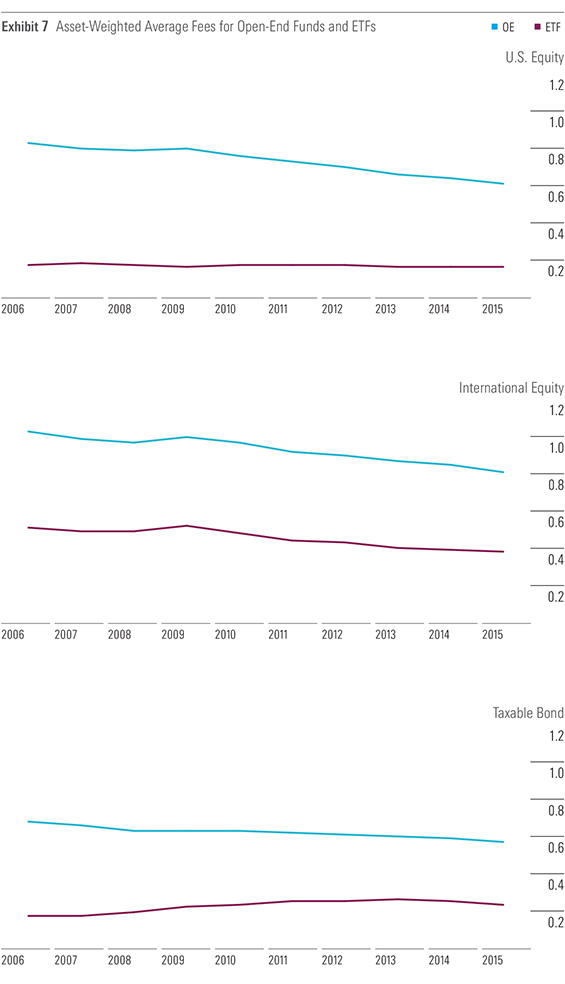
During the past few years, ETFs have become an attractive low-cost alternative to actively managed funds. With strong flows into ETFs, providers of actively managed open-end funds are feeling strong competitive pressures. In Exhibit 7, we see that pricing declines in open-end equity funds have accelerated during the past few years. While the gap in fees has fallen slightly across major asset classes, there is still a significant difference, amounting to approximately 40 basis points, between ETFs and open-end funds within the same asset class. Fees cannot go much lower for broad, core ETFs. Perhaps the next segment of the marketplace to see more-aggressive pricing may be strategic-beta funds. Some mutual fund providers who don't have ETF offerings are looking to launch strategic-beta ETFs that may be akin to their existing active strategies. Existing ETF players may go on the offensive on pricing before these new products enter the market. Vanguard and iShares already have dividend-oriented ETFs and style ETFs that charge fees around 10 basis points, which is extremely cheap. However, outside of those strategies, other strategic-beta ETFs remain relatively expensive and have plenty of room to reduce fees. It will be interesting to see how these competitive dynamics affect fund pricing in the coming years.

Disclosure: Morningstar, Inc.'s Investment Management division licenses indexes to financial institutions as the tracking indexes for investable products, such as exchange-traded funds, sponsored by the financial institution. The license fee for such use is paid by the sponsoring financial institution based mainly on the total assets of the investable product. Please click here for a list of investable products that track or have tracked a Morningstar index. Neither Morningstar, Inc. nor its investment management division markets, sells, or makes any representations regarding the advisability of investing in any investable product that tracks a Morningstar index.
/cloudfront-us-east-1.images.arcpublishing.com/morningstar/ZHTKX3QAYCHPXKWRA6SEOUGCK4.png)
/d10o6nnig0wrdw.cloudfront.net/05-13-2024/t_4a71dba80d824d828e4552252136df22_name_file_960x540_1600_v4_.jpg)
/cloudfront-us-east-1.images.arcpublishing.com/morningstar/24UPFK5OBNANLM2B55TIWIK2S4.png)
:quality(80)/s3.amazonaws.com/arc-authors/morningstar/de44b91c-c918-4e53-81c3-ce84542f3d36.jpg)