Cheap Exposure to the Universal Bond Index
This ETF can offer greater yield and Morningstar Risk-Adjusted Returns than traditional aggregate index ETFs.
With yields at all-time lows, many income-seeking investors have been chasing yield, investing in everything from high-yield corporate bonds to high-quality dividend-paying stocks. However, chasing yield can often lead to increased volatility, increased probability of permanent capital loss, and returns that are more correlated to stocks. Said another way, when chasing yield, fixed-income investors often face disappointing and costly consequences.
IShares Core Total U.S. Dollar Bond Market IUSB can offer a slightly higher yield while still providing correlated returns to the high-quality bond-oriented Barclays U.S. Aggregate Bond Index. IUSB tracks the Barclays U.S. Universal Bond Index, an index that includes all of the constituents in the Barclays U.S. Aggregate Bond Index plus higher-yielding assets, such as high-yield corporate bonds, and eurodollar, emerging-markets (U.S. dollar and U.S. listed) bonds, 144A securities, as well as a broader swath of commercial mortgage-backed bonds excluded from the Aggregate Index. The Aggregate Index comprises 84% of the Universal Index’s market cap, and by extending that reach across a wider range of bond sectors, the fund may be used as a core holding to get exposure to the U.S. fixed-income market.
Because IUSB invests in higher-yielding assets than funds that track the Aggregate Index, investors can expect it to deliver greater yield. As of Feb. 28, 2015, the fund’s yield to maturity (2.6%) was greater than that of the Aggregate Index (2.1%). Over the trailing 15-year period through February 2015, the average yield to maturity difference between the fund’s Universal Index benchmark and the Aggregate Index was 0.4%. Because the fund’s index and the Aggregate Index have had nearly identical duration since the Universal Index’s January 1990 launch, the difference in yield comes from taking on additional credit risk. As of Feb. 28, 2015, the fund’s duration (5.1 years) was roughly in line with the Aggregate Index's (5.2 years).
Despite taking on additional credit risk, IUSB still has an investment-grade average credit rating of A, versus the Aggregate Index’s AA rating. Additionally, as of Feb. 28, 2015, the fund had more than 60% of its assets invested in AAA credit-quality securities versus the Aggregate’s 70% and less than 8% of its assets in non-investment-grade securities (average credit rating of BB+ or less). The Aggregate Index does not include non-investment-grade securities.
Investors have historically been well compensated for taking on that additional credit risk. For example, the Universal Index outperformed the Aggregate Index on a Morningstar Risk-Adjusted basis in nearly 75% of the 242 rolling five-year periods since the Universal Index’s January 1990 inception through February 2015. This shows that, more often than not, investors were better compensated for the risks taken in IUSB. That’s not to say the Universal Index will always outperform the Aggregate Index. During periods of market stress, such as the tech bubble and 2008 financial crisis, the Aggregate Index provided better returns because of its greater exposure to less-credit-sensitive assets, such as Treasuries. For example, the Universal Index underperformed the Aggregate Index over the rolling five-year periods between February 2001 and July 2003 (30 sample periods).
Cost Hurdle
While the fund currently offers a greater yield than exchange-traded funds that track the Barclays U.S. Aggregate Bond Index, investors should be aware that it may be difficult to capture all of the yield difference. While the fund has a relatively low cost (0.15% expense ratio after a 0.01% fee waiver expiring Feb. 29, 2016), that levy is greater than funds that track the Barclays U.S. Aggregate Bond Index. For example,
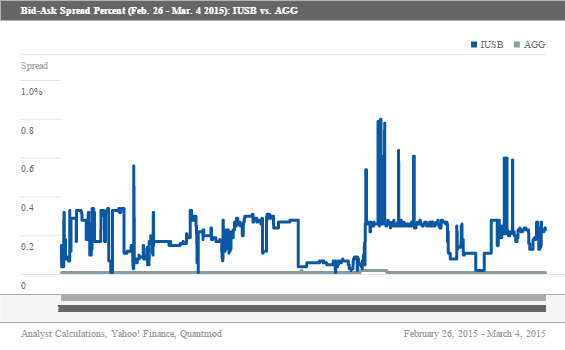
Compounding matters is the fund’s relatively small asset base ($350 million) relative to AGG ($24 billion) as of Feb. 28, 2015. Smaller asset bases can make it more expensive to trade because of larger bid-ask spreads. For example, if an investor had tried to purchase shares of the fund over the trailing week through Feb 28. 2015, she would have likely encountered an average bid-ask spread of 0.19%. However, the spread was as narrow as 0.01% and as wide as 0.80% for a few seconds. Conversely, the same investor would have experienced only a 0.01% bid-ask spread if purchasing AGG over the same time period and the spread was consistent throughout the day. The chart below shows the bid-ask spread percentage for the fund and AGG every five seconds over the trailing week through March 4, 2015--admittedly, a single week is a small sample size, but these fluctuations in bid-ask spreads could potentially increase during periods of heavy inflows or outflows into the fund, and they highlight the potential longer-term challenge of capturing all of the fund’s greater yield.

In addition to wider bid-ask spreads, the fund’s premium discount to its net asset value may also increase the fund’s cost of ownership. From its June 10, 2014, inception through Feb. 28, 2015, the fund has had a daily average premium of 0.14%. Over the same time period, the fund had a discount as large as 0.23% and a premium as large as 0.50%. By contrast, AGG has had an average daily premium of 0.09%, a discount as large as 0.10%, and a premium as great as 0.37%. An investor who buys at too wide of a premium would be overpaying for the assets, which could increase her total cost of ownership.
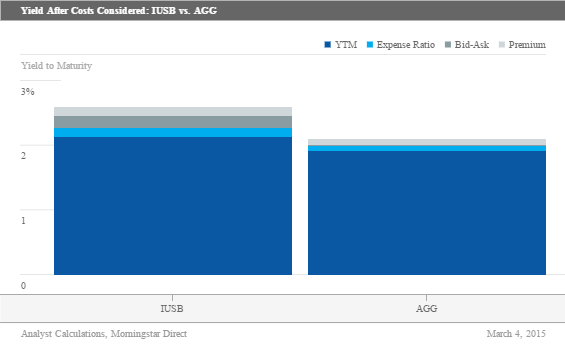
Of course, these bid-ask spreads and premium discounts will shift over time. As a fund increases its asset base, the bid-ask spread should generally begin to narrow. This can negate the bid-ask premium percentage when first purchased and reduce the total cost of ownership. On the other hand, if bid-ask spreads stay the same or widen, the investor may get less than the value of the underlying securities, thereby increasing the total cost of ownership. The chart below shows the total cost of buying and selling IUSB and AGG and its impact on total yield, assuming costs, bid-ask, and premium discount remain constant over the life of the investment. Even after adjusting for different hidden costs, such as bid-ask spread and premium discount, investors in IUSB get a higher annualized yield than AGG. This is an average example of an investor in IUSB who does not take any measures to minimize trading and premium costs. Investors who use limit orders and view the fund’s market price to NAV may be able to achieve even better results.

Tracking error was left out because it can be either additive or detractive to a fund's returns. For example, IUSB's tracking error to its bogy from June 2014 to February 2015 was 0.3%. This helped the fund outperform its bogy by more than 0.2% annualized.
Index Construction The fund tracks Barclays U.S. Universal Bond Index, which measures the total U.S. dollar-denominated, fixed-rate, taxable-bond market. The index includes corporate (investment- and non-investment grade), government, and securitized bonds. It is the parent index to the widely followed Barclays U.S. Aggregate Bond Index. As such, the Universal Index contains every constituent in the Barclays U.S. Aggregate Bond Index and also includes high-yield corporate bonds and other securities excluded by the Aggregate Index. Corporate issuers include industrial, financial, and utility companies. Securitized bonds include agency mortgage-backed securities and other asset-backed securities. The index weights its holdings by market capitalization and rebalances at the end of each month. This gives the most heavily indebted issuers--like the U.S. government--the greatest weightings in the portfolio. The fund uses a sampling strategy to track its index and holds roughly 1,100 of its index's 15,000 constituents. Between July 2014 and February 2015, the fund's tracking error to its index was 0.3%. By comparison, AGG's tracking error to its bogy was 0.1% over the same time period.
Fees While the fund's expense ratio (0.15%) is low in absolute returns, there are ETFs that track the Barclays U.S. Aggregate Bond Index that charge as low as 0.06%. Since the fund's June 10, 2014, inception, it has outperformed its benchmark by 0.2% annualized. This is mostly due to tracking error.
Alternatives The fund is currently the only way to track the Barclays U.S. Universal Bond Index. However, investors looking for aggregate bond exposure may consider AGG (0.08% expense ratio after 0.01% fee waiver expiring June 30, 2015). Unlike IUSB, AGG only includes investment-grade securities. As of Feb. 28, 2015, AGG had a yield to maturity of 2.1% and duration of 5.1 years.
Investors looking for an actively managed mutual fund may consider
Disclosure: Morningstar, Inc.'s Investment Management division licenses indexes to financial institutions as the tracking indexes for investable products, such as exchange-traded funds, sponsored by the financial institution. The license fee for such use is paid by the sponsoring financial institution based mainly on the total assets of the investable product. Please click here for a list of investable products that track or have tracked a Morningstar index. Neither Morningstar, Inc. nor its investment management division markets, sells, or makes any representations regarding the advisability of investing in any investable product that tracks a Morningstar index.


/cloudfront-us-east-1.images.arcpublishing.com/morningstar/24UPFK5OBNANLM2B55TIWIK2S4.png)
/d10o6nnig0wrdw.cloudfront.net/04-25-2024/t_29c382728cbc4bf2aaef646d1589a188_name_file_960x540_1600_v4_.jpg)
/cloudfront-us-east-1.images.arcpublishing.com/morningstar/T2LGZCEHBZBJJPPKHO7Y4EEKSM.png)