
The Games Funds Play
When “High Yield” funds are not.
/s3.amazonaws.com/arc-authors/morningstar/1aafbfcc-e9cb-40cc-afaa-43cada43a932.jpg)

It’s a Miracle!
I regularly receive emails asking about closed-end equity funds that make breathtakingly high payouts. Allegedly such funds yield more than 8%. Generally, my correspondents have been around the investment block enough to suspect that these funds cannot be what they seem. What’s the catch?
Enter today’s article. (This is not the first time that I have addressed this topic. But as the questions keep arising, and this column takes a fresh angle, I am revisiting it.) This column will show that, despite outward appearances, such funds are unremarkable. For investors in tax-sheltered accounts—taxable assets being another matter—high-paying equity funds should be neither coveted nor feared.
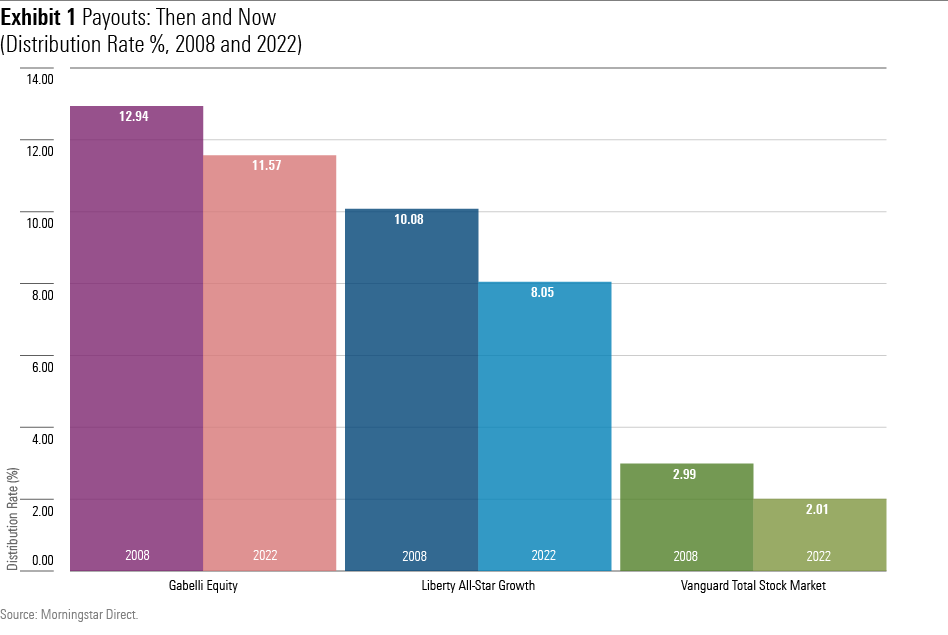
The fundamental claim for these closed-end funds is correct: They distribute at least 8% of their principal values, both today and in the past. The following chart depicts the payout rates in 2008 and 2022 for two representative funds of this small group: Gabelli Equity Trust GAB and Liberty All-Star Growth ASG. Also depicted are those of the flagship U.S. equity mutual fund: Vanguard Total Stock Market Index VTSMX.
Everyday Investments
The numbers would appear to undercut my contention that high-paying closed-end equity funds are unexceptional. If they do not differ strongly from mainstream stock funds, represented here by the Vanguard fund, then why are their distribution rates so much higher? They surely must hold very different portfolios.
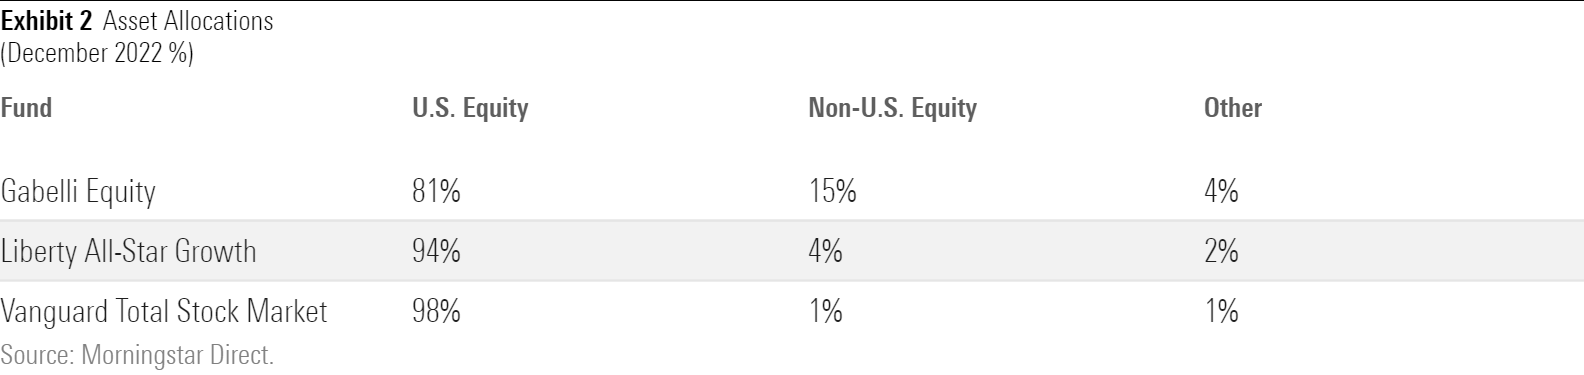
Or so one would think. But in fact these funds do not. As shown by the table below, their asset allocations broadly resemble those of the index fund. In addition, although Gabelli Equity Trust and Liberty All-Star Growth own somewhat smaller companies than does Vanguard Total Stock Market Index, their positions nevertheless mostly consist of midsize to large firms. Each fund is well diversified across industries, too.
Funds that invest primarily in familiar U.S. businesses, while avoiding both major industry bets and the temptation to time the market by retreating to cash, will likely record similar returns. Such has been the case with these funds over the past 15 years.
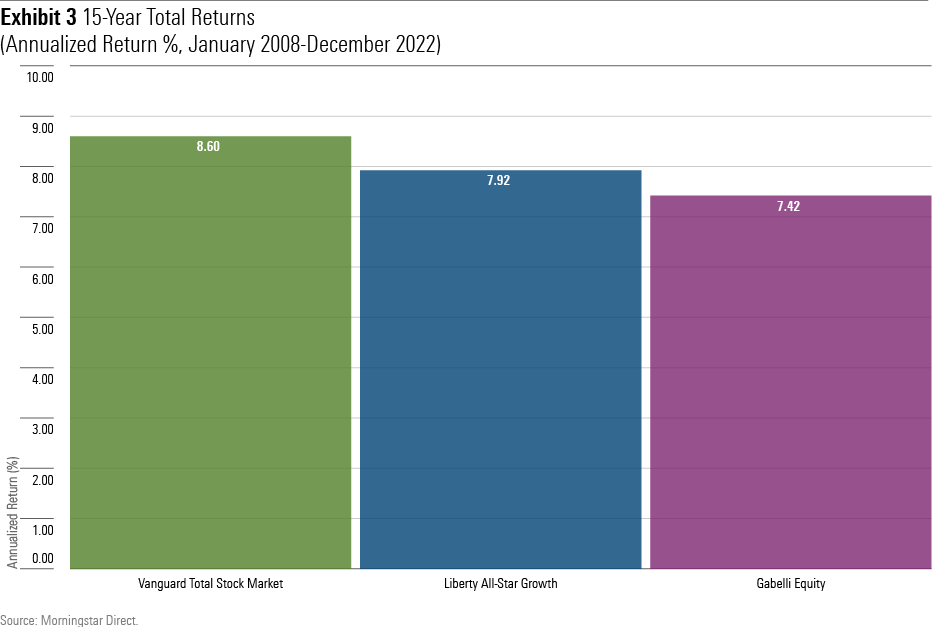
The differences in performance owe mainly to costs. Gabelli Equity Trust has lagged Vanguard Total Stock Market Index by almost exactly the amount of its extra outlays. Liberty All-Star Growth fared somewhat better, as it was able to halve its cost deficit by posting better pretax returns. Still, as with most of its actively managed peers, it failed to keep up with its indexed rival after paying its expenses.
In summary, Gabelli Equity Trust and Liberty All-Star Growth look, walk, and quack like typical U.S. equity funds while making much higher payouts. Something strange is afoot.
Faux Yields
The explanation to the mystery is that the funds’ payouts are goosed. Although proponents sometimes credit such funds with superior yields, that claim is false. As seen above, their portfolios are conventional. Consequently, these high-paying funds actually distribute less income than do index funds. Their starting yields are similar, but after paying expenses, which by SEC regulations must come from a fund’s income stream, their final yields are negligible.
The funds fill that gap by making regular capital gains distributions, sometimes supplemented by returns of capital. In other words, their “yields” either consist of profits realized by selling the funds’ successful investments, or the return of shareholders’ original principal. Whatever one wishes to call such payments, they certainly are not yield.
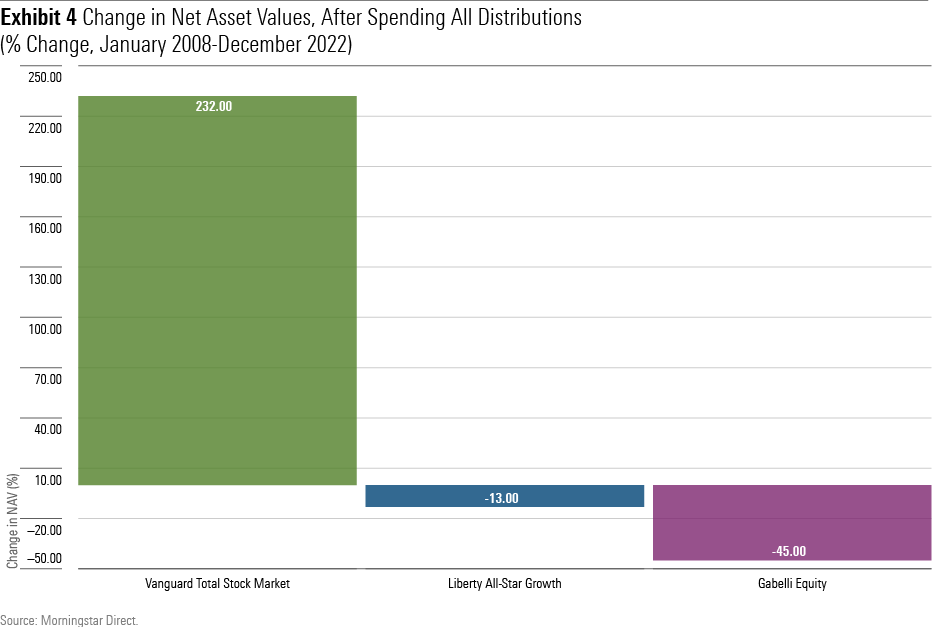
Over time, these distributions sharply reduce the funds’ net asset values. The math is very simple. Vanguard Total Stock Market Index has not paid a capital gains distribution at any time in the past 15 years. Because the fund has retained every penny of its stock market profits, its NAV has more than tripled. Over that same period, the NAVs of the two high-paying funds has declined. Those who bought those funds 15 years ago and who spent their payments as they received them now own funds that are worth less than their purchase prices.
To be sure, as evidenced by the funds’ competitive total returns, the news is nowhere near that dire. Along the way the high-paying funds distributed moneys that could have been spent or reinvested back into the funds themselves. In the latter case, their NAVs would have grown substantially, as with the Vanguard fund. One might wonder why an investor would buy a stock fund with a spectacularly high distribution rate, then choose not to accept those distributions, but motivations aside, the outcome would have been conventional.
From Percentages to Dollars
While the funds’ distribution strategies do not affect their total returns, they strongly affect their future payouts. As Exhibit 1 shows, from 2008 through 2022 the distribution rates for the three funds remained relatively constant. However, as their principal amounts have diverged, so has the amount of the dollars they have paid.
To provide the specifics: Shareholders who bought all three funds on December 2007, have since held those positions, and spent each fund’s distributions rather than reinvesting them, would now receive fewer dollars from Gabelli Equity Trust than in 2008; slightly more from Liberty All-Star Growth (although less in inflation-adjusted terms), and a full 140% more from Vanguard Total Stock Market Index.
If the historic trend persists, three years from now Vanguard Total Stock Market Index’s cash distributions will surpass Gabelli Equity Trust’s. Five years later they will surpass Liberty All-Star Growth’s. Good things come to those who wait.
Summary
High-paying closed-end equity funds aren’t a scandal. Because their investment strategies are conventional, their long-term total returns won’t fall far short of the overall stock market. However, it’s also difficult to understand their appeal. Their distributions could be matched by holding a traditional U.S. equity fund, and then selling shares when desired. And they are ill-suited for taxable accounts.
That such funds exist, I suppose, is a testament to the attraction of high yields. In this case, however, their payouts truly are something else.
The author or authors own shares in one or more securities mentioned in this article. Find out about Morningstar’s editorial policies.
The opinions expressed here are the author’s. Morningstar values diversity of thought and publishes a broad range of viewpoints.
/cloudfront-us-east-1.images.arcpublishing.com/morningstar/G3DCA6SF2FAR5PKHPEXOIB6CWQ.jpg)
/cloudfront-us-east-1.images.arcpublishing.com/morningstar/6ZMXY4RCRNEADPDWYQVTTWALWM.jpg)
:quality(80)/s3.amazonaws.com/arc-authors/morningstar/1aafbfcc-e9cb-40cc-afaa-43cada43a932.jpg)