
A Tale of Two Bond Markets
It was the best of times, it was the worst of times.

It was the best of times, it was the worst of times, it was the age of central bank intervention, it was the age of negative interest rates, it was the epoch of financial complacency, it was the epoch of reaching for yield, it was the season of heightened share buybacks, it was the season of plunging commodity prices, it was the spring of shareholder activism, it was the winter of declining credit ratings, we had surging stocks before us, we had Chapter 11 filings before us, we were all going to retire early, we were all going bankrupt. Our apologies to Charles Dickens, but there are currently two different tales being told in today's corporate bond market. The bond prices of any company related to either the energy or commodity markets have plummeted, whereas for the rest of the market, bond prices have held in relatively well.
Over the past seven years, in order to shore up asset prices and spur inflation in an attempt to ramp up economic growth, central banks across the world have consistently intervened in their bond markets. Through a combination of lowering interest rates to zero (or negative in some cases) and instituting quantitative easing programs, central banks have pumped an unprecedented amount of liquidity into the markets. Both short-term and long-term interest rates have fallen to levels rivaling their historically lowest yields.
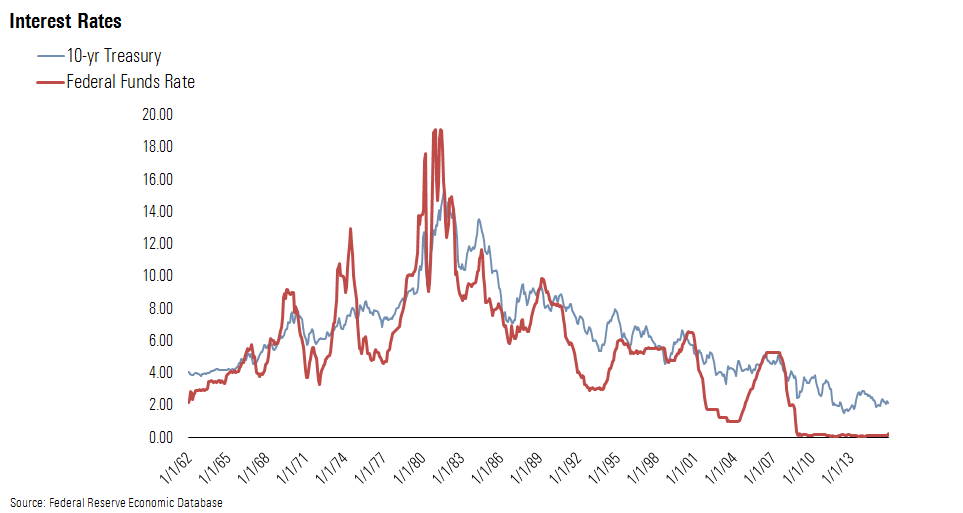
Complacency has ruled the markets for the past several years while all this newly created money has been searching for a home. As such, every dip in the markets was considered an opportunity to be bought, and volatility subsided.
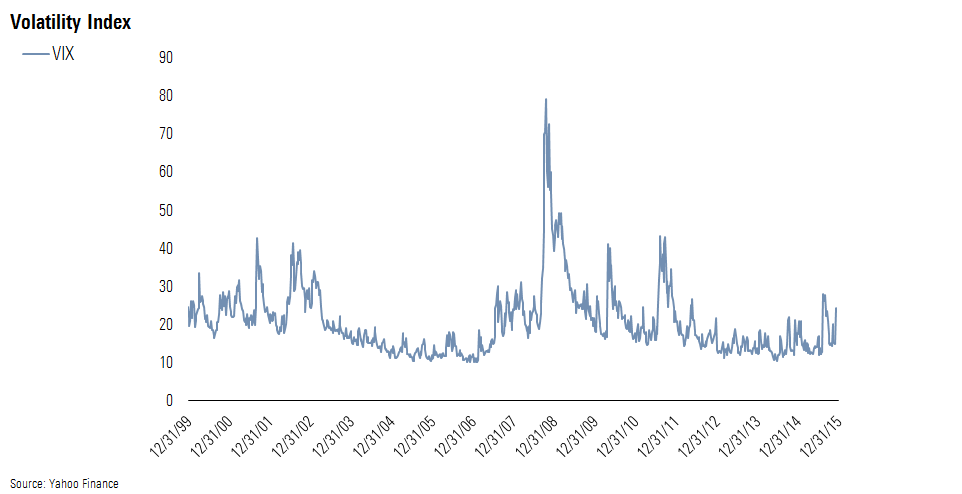
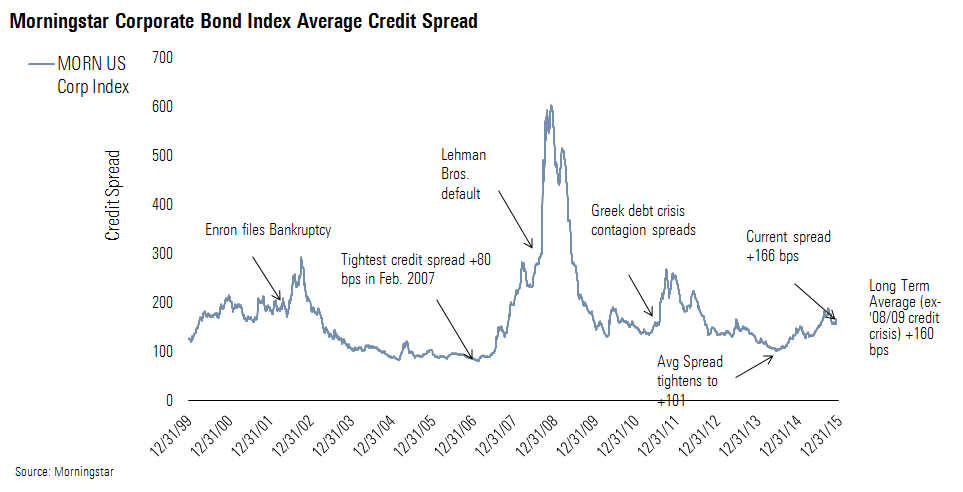
These low yields and modest volatility levels prompted fixed-income investors to risk seeking extra yield in lower-rated securities. Based on the heightened demand, credit spreads tightened to levels not realized since before the credit crisis. For example, the average credit spread of the Morningstar Corporate Bond Index tightened to +101 basis points in July 2014, which on a rating-adjusted basis was equivalent to the tightest levels realized before the global credit crisis.
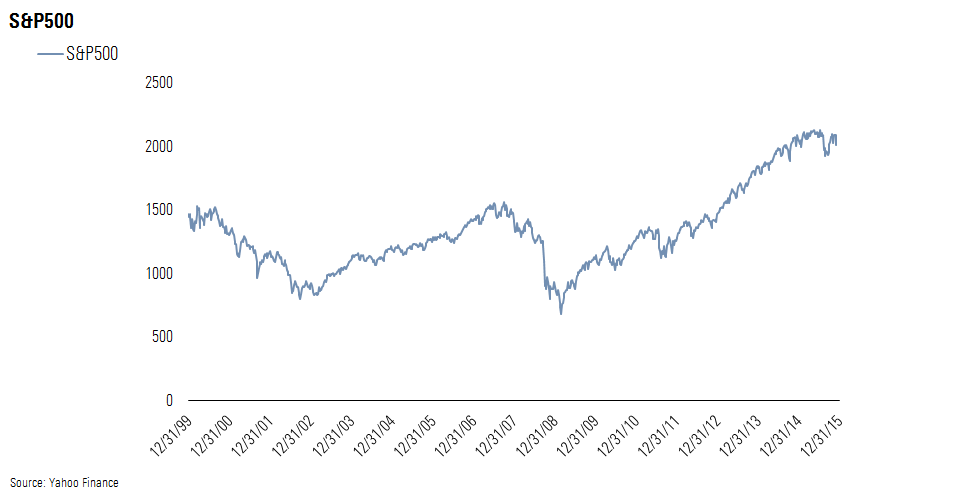
The combination of low interest rates and tight credit spreads encouraged companies to issue prodigious amounts of new debt. In some cases, such as in the energy and mining sectors, the debt was used to fund capital expansion projects to expand oil drilling or dig new mines. In other cases, the debt was used to fund some of the largest share-buyback programs in history. The combination of moderate economic growth, central bank intervention, and heightened buybacks propelled stock prices to all-time highs.
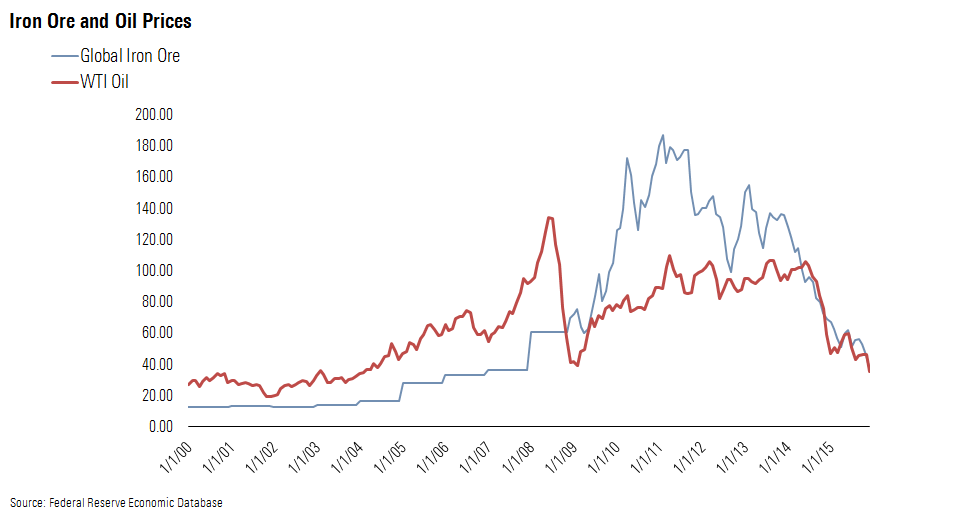
For years, China has been the marginal buyer of every new barrel of oil and ton of iron ore. Its appetite for raw commodities seemed insatiable as it funded an extraordinary campaign of infrastructure growth. For example, it has been reported that China used more cement from 2011 through 2013 than the United States consumed from 1901 through 2000. However, as these new oil wells and expanded mines came on line over the past year, infrastructure growth in China began to slow. Oil prices were as high as $100 per barrel as recently as July 2014 and have fallen below $36. Iron ore prices have been on a downward trend for longer, but they were as high as $128 per ton in January 2014 and have fallen to below $40. In recent weeks, the pace of decline has picked up.
As commodity prices have fallen, bankruptcy risk in those sectors leveraged to raw materials has increased substantially, and the credit ratings on those firms have been slashed. In addition, analysts have been sharply ratcheting down their estimates of recovery values. Between heightened near-term bankruptcy risk and lower recovery values, bond prices in the energy and metals and mining sectors have dropped precipitously. Declines in these two sectors have had an oversize impact on the index, as the sectors account for a significant percentage of the overall index. Even after the high-yield energy sector lost 13% this year through the end of November, it remains the single-largest sector in the index, constituting more than 12%. While bond prices in these sectors have suffered, bond prices in sectors that are not correlated to commodity prices have held up relatively well. For example, the average price of bonds in the food, beverage, and tobacco sector of the Bank of American Merrill Lynch High Yield Index has fallen less than 1%, and the total return for that sector has risen 7.58%.
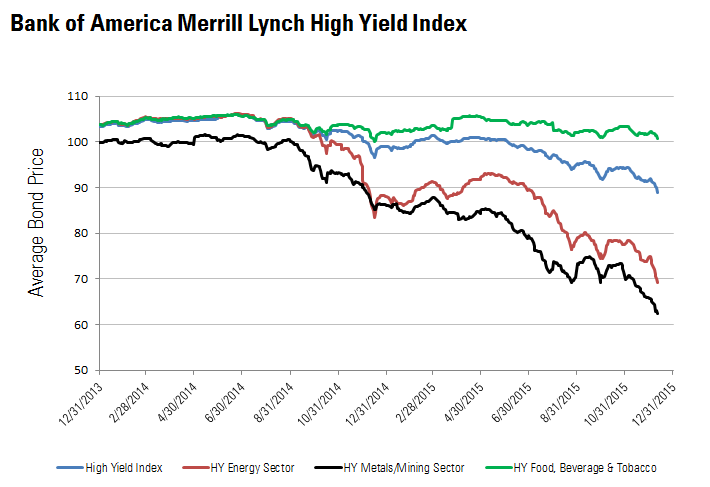
The reason that bond prices have sunk further in the past few weeks is twofold: Oil and commodity prices resumed their downward slide, and buyers are particularly gun-shy. Distressed-debt investors waited patiently for the past few years for the distressed-debt market to return in order to ply their expertise. Many of these investors began to put money to work earlier this year only to see commodity prices continue to sink. Losses mounted in the first half of the year but were manageable. Oil prices staged a dead-cat bounce in late September and early October, which suckered many of these investors into doubling down on their positions. This led to a brief rally; however, as oil prices resumed their slide in early November, many investors looked to quickly exit positions and new buyers were nowhere to be found. In some cases, distressed-debt buyers have suffered 20%-plus losses this year. Currently, there is a gap in the market as distressed-debt investors who bought bonds earlier this year and experienced large losses are either too gun-shy to increase exposure or lack the capital to do so.
Besides the divergences in performance we have seen in the corporate bond market, the leveraged loan market has also been experiencing a performance dichotomy. For issuers whose financial results have been stable, the prices on their bank loans have held steady near par. Conversely, at the first sign of any weakness, prices have experienced air gaps on the way down.
Two dynamics have led to the price gaps. First, the banks are stuck with a couple of hung bridge deals. Second, the trading dynamics of the market have been changing. As is typical of when the credit market overheats, the banks became overly aggressive structuring committed financing for leveraged buyouts and are now stuck with this paper until they can discount it enough to sell it.
Trading dynamics are much more difficult for investors looking to sell deteriorating paper to find other investors willing to buy. A senior executive at a collateralized loan obligation asset manager reported that trading dynamics in the leveraged loan space have changed. Unlike in the past, currently there are very few buyers of leveraged loans priced in the mid-80s to mid-90s. When an issuer starts to suffer any kind of credit deterioration, there is a large air gap on the way down. CLOs don't want to touch the paper, as potential downgrades of deteriorating companies will impair their weighted average rating factor scores, and banks don't want to take the capital charge to buy it for their own balance sheets. Often times, loans will gap down 15-plus points until distressed-debt buyers start to get interested (for example, a loan trading at 97 will gap down to low 80s). Previously, a few points' move in the leveraged loan market was a big deal. In addition to the problems in the energy and metals and mining sectors, the executive said the media sector was experiencing financial difficulties, as well as the pharmaceutical sector more recently (especially after the Valeant debacle).
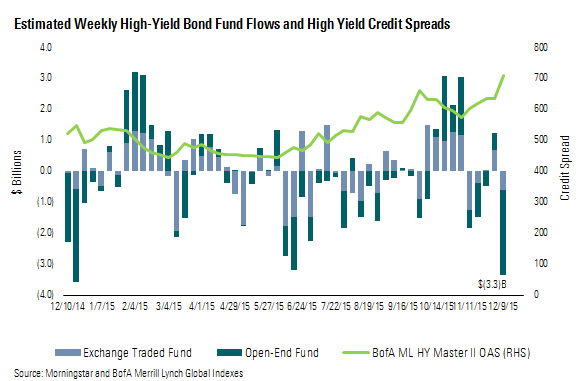
As investors sought a safe place to hide last week, U.S. Treasury bond prices rose rapidly, pushing yields down. The yield on the 5-year Treasury fell 14 basis points to 1.57%, the 10-year Treasury declined 14 basis points to 2.14%, and the 30-year Treasury decreased 13 basis points to 2.88%. The average spread of the Morningstar Corporate Bond Index widened out 9 basis points last week to +166 bps over Treasuries, and the Bank of America Merrill Lynch High Yield Master Index widened an astounding 73 basis points to +710 bps. This marks the widest spread that the high-yield sector has registered since June 2012, when the market was recovering from the European financial crisis. Investors fled the high-yield market, as high-yield mutual funds and exchange-traded funds registered a $3.3 billion outflow last week, the second-greatest outflow over the past 52 weeks.

 United States