
Sliding Oil Prices Siphon Gas Out of Corporate Credit Spreads
High-yield fund flows slow to a standstill.

After reaching a near-term peak of over $51 per barrel in early June, oil prices have slid almost 20%, with a significant amount of the decline occurring over the past two weeks. Oil prices fell almost $3 per barrel last week alone, ending the week at $41.45. As oil prices have fallen, the rally in the corporate bond market has stalled.
The average credit spread of the Morningstar Corporate Bond Index widened 2 basis points to +145 last week and the average spread of the Bank of America Merrill Lynch High Yield Master II Index widened 22 basis points to +561. Within the investment-grade and high-yield indexes, the credit spread of the energy sector widened 12 basis points and 62 basis points, respectively, last week. This credit spread widening in the energy sector was more than enough to offset any positive movement among the other sectors. Yet, even though the energy sector has begun to widen, the amount the sector has widened has lagged the amount that oil prices have fallen recently.
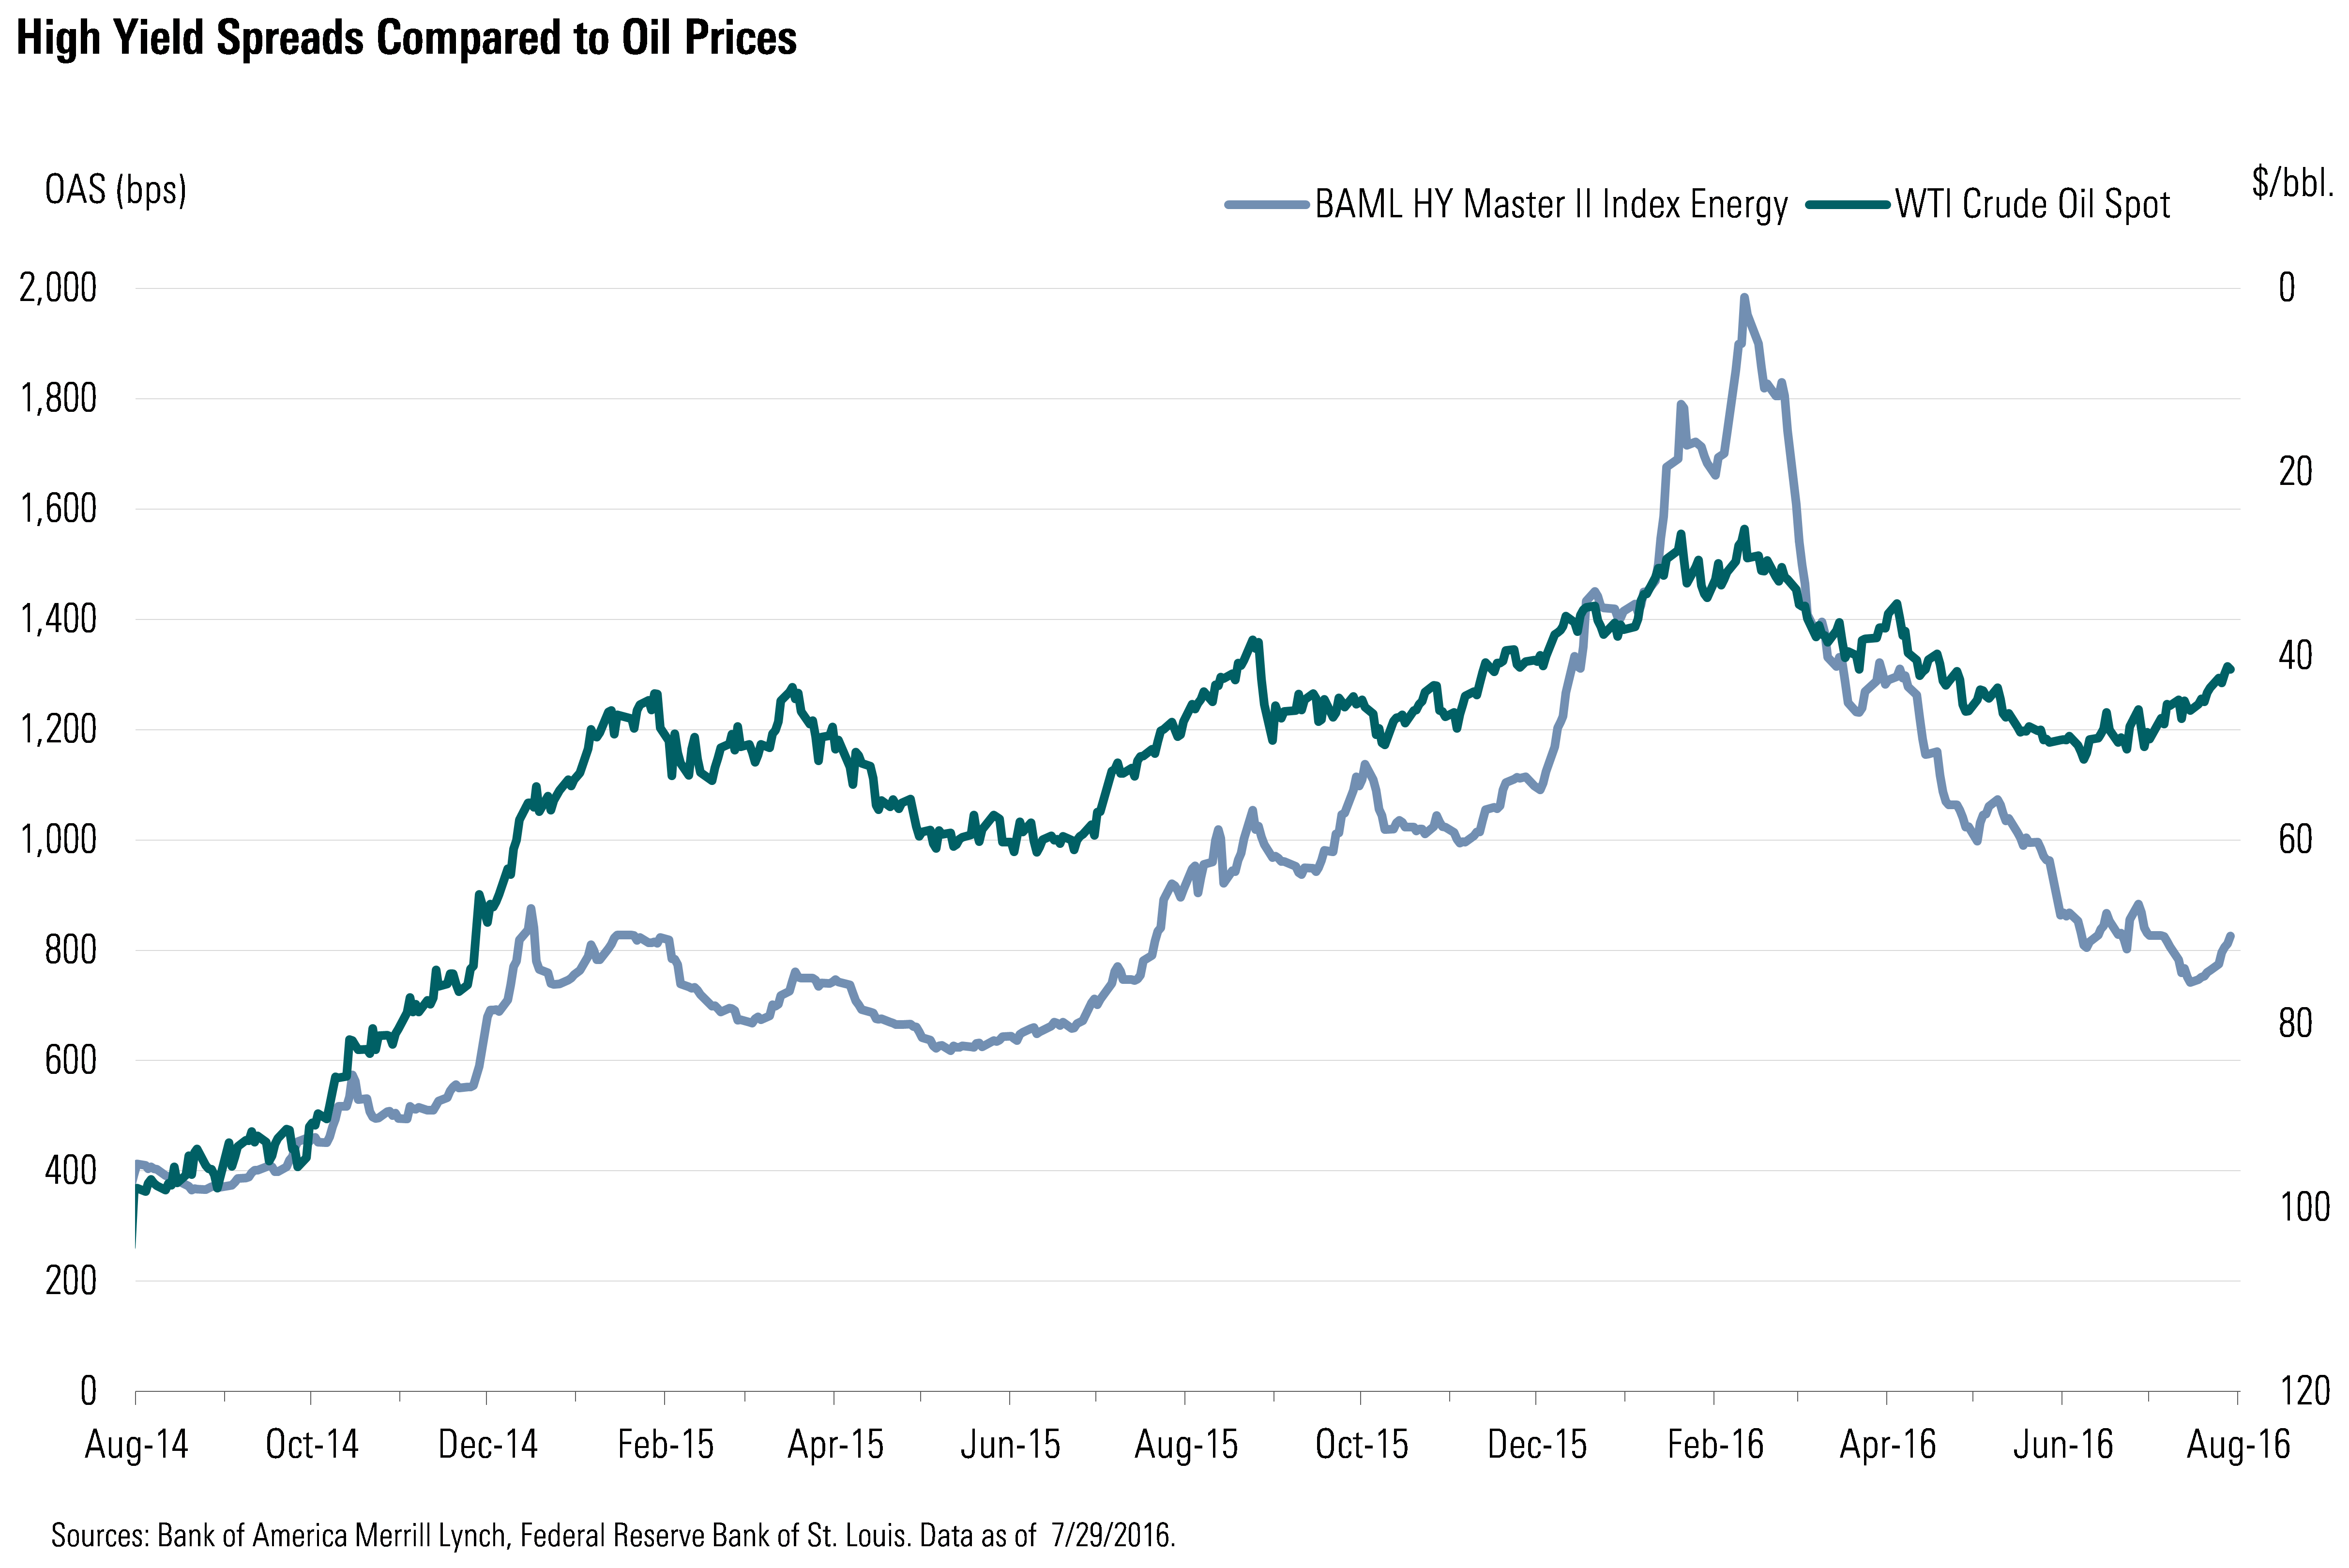
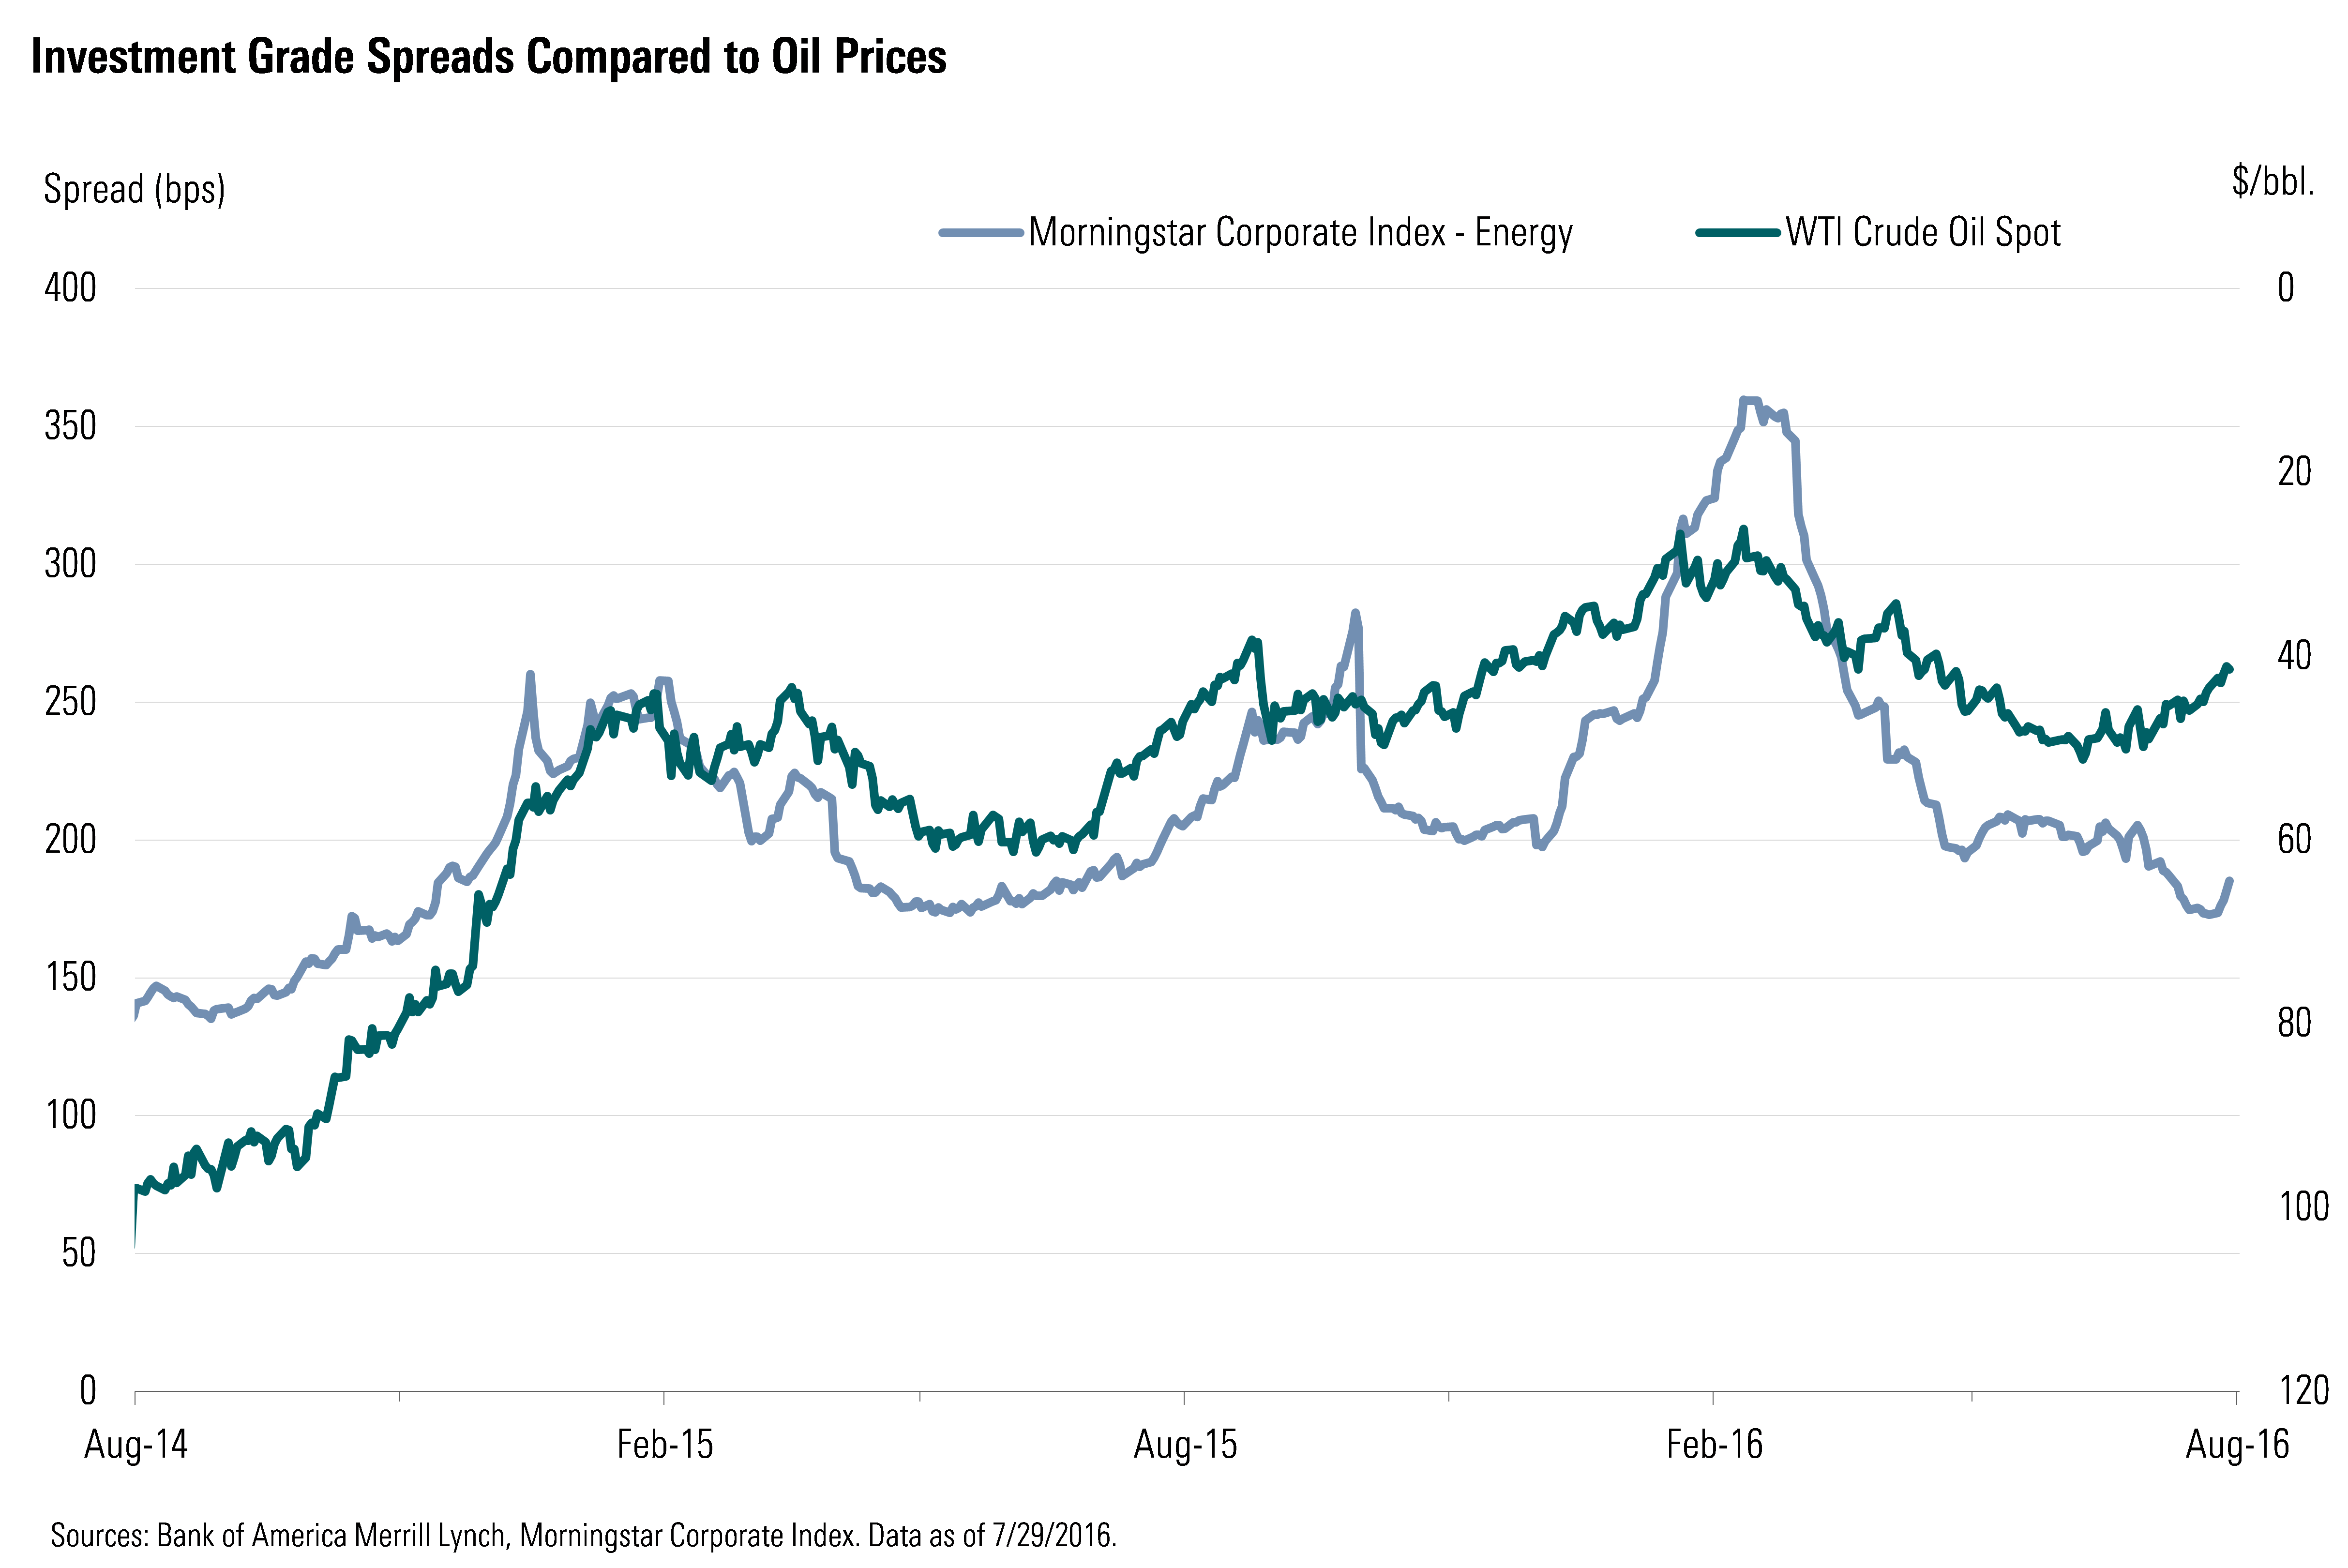
Note: Oil prices on charts are shown on an inverse scale to better illustrate the correlation between oil prices and credit spreads in the energy sectors
In our third-quarter outlook, we outlined how easy monetary policy among the global central banks, low interest rates (and specifically negative interest rates in Europe and Japan), and the European Central Bank's corporate bond purchase program would provide a strong tailwind for the corporate bond market over the foreseeable future. We also opined that oil prices would trade in a seesaw fashion over the second half of 2016, but that the general trend would remain higher by year end. Yet, we cautioned that one of the greatest risks to our positive outlook for corporate bonds was if oil prices were to slide below $40 per barrel. While we continue to think that oil prices will be higher by the end of the year, if oil prices sink below $40 in the near term, credit spreads would likely follow course. As a comparison, the last time oil prices were meaningfully below $40, the average spread of the investment grade and high yield indexes were approximately 20 basis points and 150 basis points, respectively, wider than they are now.
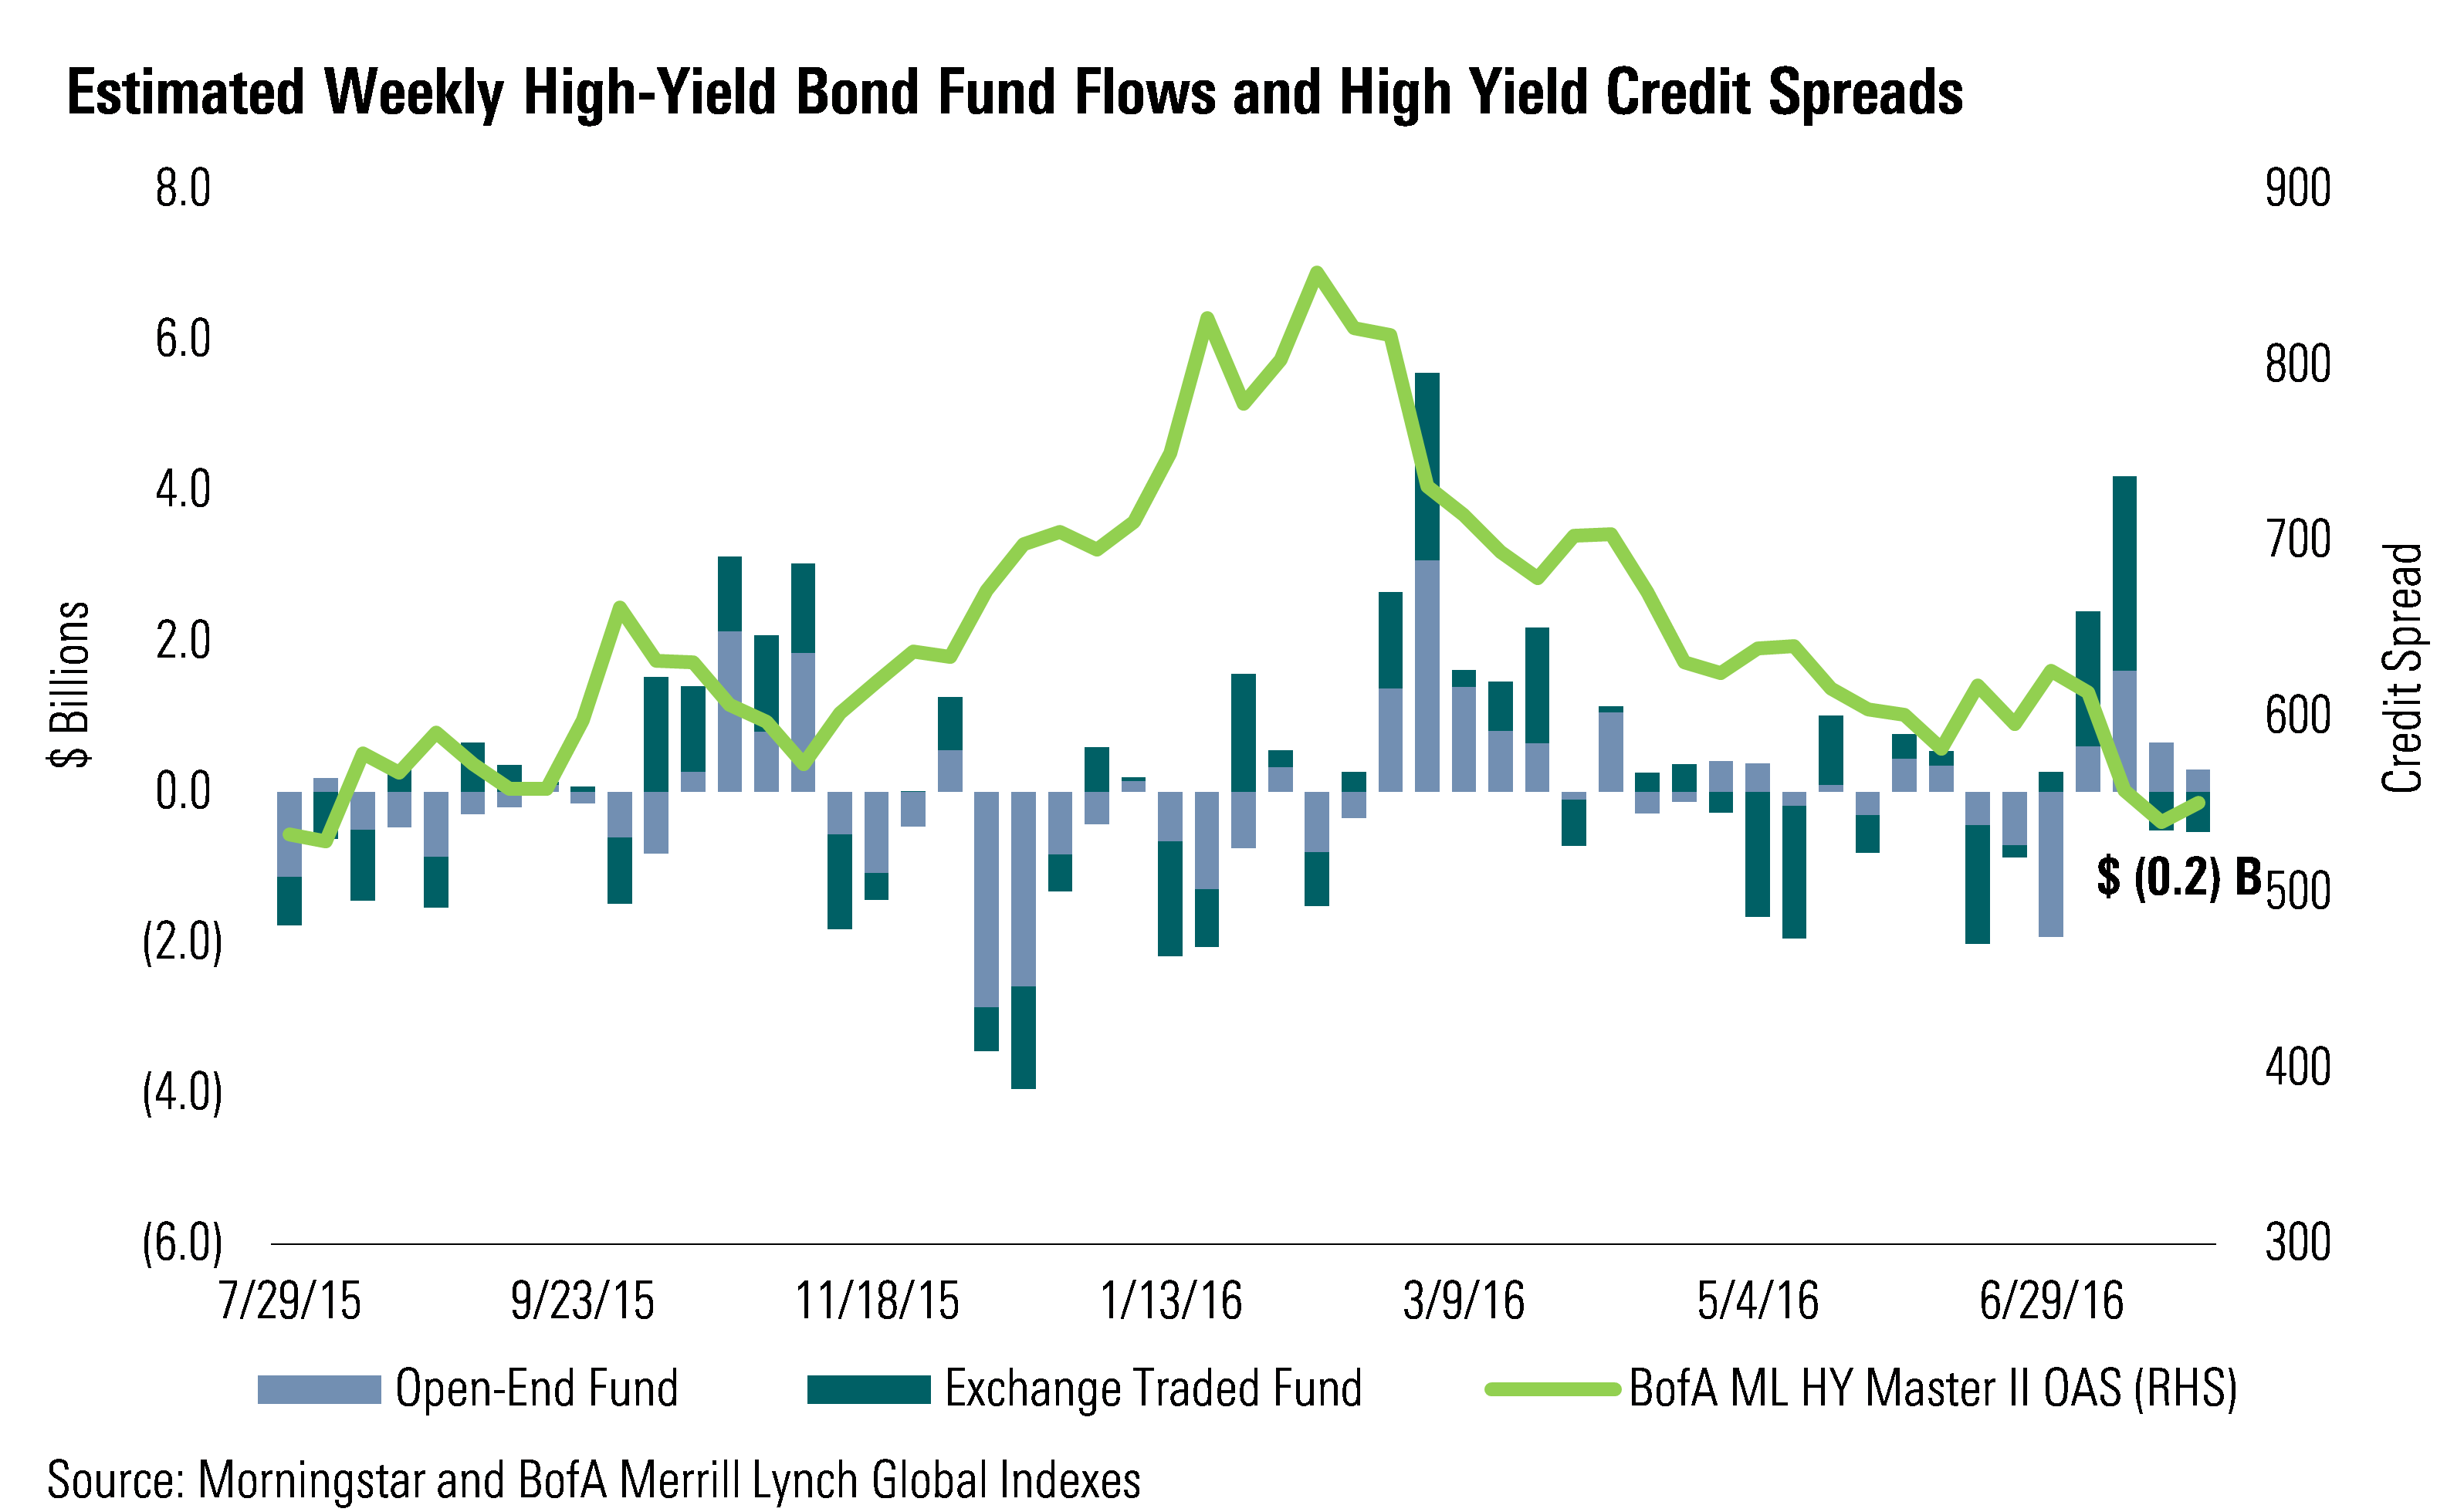
High-Yield Fund Flows Slow to a Standstill Two weeks ago, high-yield fund flows experienced one of its single greatest weekly inflows since we started tracking the data in June 2009; however, as oil prices began their slide in earnest over the past two weeks, fund flows into the high-yield asset class have slowed to a standstill. The asset class experienced a $0.2 billion outflow last week, which offset the slight gain the prior week. Year-to-date, inflows into the high-yield asset class remain strong. The $10.2 billion worth of fund inflows has more than overcome the $2.0 billion of outflows experienced in 2015. Much of the year-to-date inflows were driven after oil prices bottomed out in February and investors became increasingly comfortable reaching for yield. If oil prices were to slide further from current levels, we expect outflows to gain momentum, which would put additional pressure on the high yield market as funds look to sell bonds to meet redemptions.

 United States