
Rising Rates + Widening Credit Spreads = Fixed-Income Losses
Rising interest rates and widening credit spreads have taken their toll.

Performance in the fixed-income markets has been negative across the board in the first quarter as rising interest rates and widening credit spreads have taken their toll. The Morningstar US Core Bond Index, our broadest measure of the fixed-income universe, declined 2.00% in the first quarter through March 22. The decline was driven by the increase in interest rates across the entire yield curve as well as widening corporate credit spreads.
Underlying the Core Bond Index, the Morningstar US Short-Term Core Bond Index registered a loss of 0.51% as short-term rates rose to their highest levels in over a decade. The US Intermediate-Term Core Bond Index declined 1.63% and the US Long-Term Core Bond Index fell 4.26% as rising rates more than offset the yield carry from the underlying bonds in the indexes. In the Treasury market, the Morningstar US Government Bond Index fell 1.69% as the negative impact of rising rates on bond prices overwhelmed the yield carry for the quarter. Similarly, the Morningstar US Government Agency Bond Index declined 0.87%. Although inflation is edging up, inflation expectations have not risen enough to support prices of Treasury Inflation-Protected Securities, and the Morningstar US TIPS Index fell 1.33%.
For the quarter through March 22, the yield on the 2-year Treasury bond rose 40 basis points and has risen 109 basis points since the end of 2016. At its current yield of 2.28%, the 2-year is trading at its highest yield since August 2008. The yield on the 5-year Treasury bond rose 41 basis points to 2.62%, its highest since April 2010. Along the long end of the curve, the yield in the 10-year Treasury has risen 41 basis points to 2.82% but has not been able to breach the psychological ceiling at 3%. The 30-year rose 32 basis points to 3.06%. The spread between the 2-year Treasury and the 10-year Treasury widened in mid-February but has since compressed to 54 basis points, only slightly higher from the end of last year. The narrowest this spread has registered since before the global credit crisis was 50 basis points in early January 2018.
In the corporate bond market, the Morningstar Corporate Bond Index (our proxy for the investment-grade bond market) declined 2.83% as the combination of higher interest rates and wider credit spreads pushed bond prices down. In the high-yield market, the BofA Merrill Lynch High Yield Master Index only fell 0.91% as credit spreads held up better and the higher yield carry of the index offset much of the impact of higher interest rates. In Europe, the story was much the same, but interest rates rose much less and credit did not widen as much as in the United States. The Morningstar Eurobond Corporate Bond Index declined 0.33%.
The emerging-markets fixed-income indexes were among the worst-performing fixed-income asset classes this quarter. Quarter to date, the Morningstar Emerging Markets Composite Bond Index fell 2.05%, as the underlying Morningstar Emerging Markets Sovereign Bond Index declined 2.62% and the Morningstar Emerging Markets Corporate Bond Index fell 1.65%. The Morningstar Emerging Markets High Yield Bond Index dropped 1.72%.
High Yield Outperforms Investment Grade to the Downside The high-yield market has the ignoble honor of outperforming the investment-grade market by losing less this quarter. From the end of last quarter through March 22, the average credit spread of the Morningstar Corporate Bond Index widened 18 basis points to +114, while in the high-yield market, the BofA Merrill Lynch High Yield Master Index widened only 7 basis points to +370.
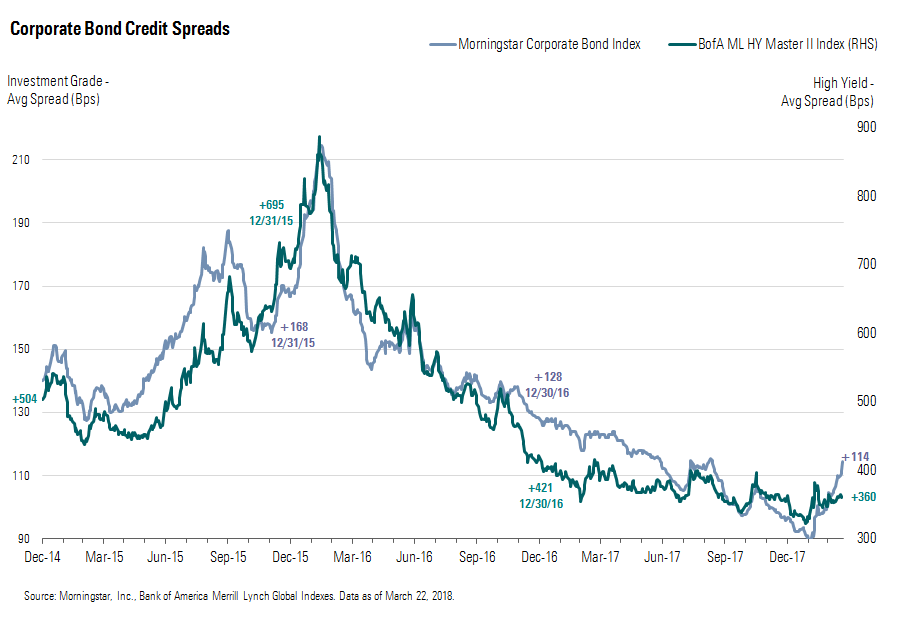
Several factors have led to this divergence. Investment-grade credit spreads are more susceptible to sell-offs in relation to debt-leveraged mergers and acquisitions, which have re-emerged as a significant risk to the investment-grade market. For example, CVS Health (BBB+/UR-) recently brought a $40 billion, multitranche new issue to market in order to fund its planned acquisition of Aetna, which is expected to close in late 2018. We had placed our rating for CVS under review with negative implications when the acquisition was announced, as we expect the debt leverage of the combined company will increase to over 4 times. This new issue transaction is the third-largest single-borrower transaction in the history of the corporate bond market. The size of this deal has weighed on both the primary and secondary markets. Since this deal was priced, new issue concessions in the primary market have been greater than normal in order to attract investor attention.
Between the new supply and the wider-than-usual new issue concessions, investors have had little reason to bid up prices on other investment-grade corporate bonds until the CVS deal is put away in long-term hands. In addition, investors are increasingly leery that the re-emergence of large debt-funded acquisitions will drive credit spreads wider. It appears that the appetite for acquisitions in the healthcare industry is not sated, as Cigna (BBB/UR-) recently announced a bid for Express Scripts (A-/UR-).
Idiosyncratic risk from debt-leveraged acquisitions has played a part in sector-specific weakness. For example, the consumer product sector was one of the worst-performing sectors this quarter. Wesley Moultrie, our credit analyst who follows the consumer defensive sector, foresees M&A risk remaining high as consumer product firms have been willing to pay up for growth; as such, purchase prices multiples (enterprise value/EBITDA) have expanded, making these deals increasingly expensive and riskier to finance with leverage. One example of this dynamic is when we placed our credit rating for Dr Pepper Snapple Group Inc. (A-/UR-) under review with negative implications following the company's agreement to merge with Keurig Green Mountain in a debt-leveraging transaction. Compounding the idiosyncratic risk in this sector, many consumer product firms are beginning to suffer from margin pressures as they have been unable to pass through rising commodity and freight costs.
The banking and financial services sectors both experienced significant sell-offs in the quarter. Some banks saw pressure on their credit metrics as they wrote off deferred tax assets and other items stemming from the passage of the Tax Cuts and Jobs Act of 2017, which produced eye-watering noncash losses for many large banks. In addition, investors are becoming increasingly concerned that consumer charge-offs will rise. One sign that their caution may be warranted can be found at private-label credit card bank Synchrony Financial (BBB, stable), which saw loans of 90 or more days past due grow to 2.29% of loans at year-end compared with 2.03% a year ago. Finally, Congress is considering a bill that would raise the total assets level at which U.S. bank holding companies must participate in the annual Federal Reserve stress test (the Comprehensive Capital Analysis and Review) to $250 billion from $50 billion. The banks that would no longer be subject to these stress tests may look to lower capital levels and/or undertake higher credit risk in order to bolster shareholder returns.
After underperforming last quarter as it tightened the least, the telecommunications sector was the best-performing sector this past quarter as it widened the least. Last quarter, the decline in credit quality in the telecommunications sector was mainly self-inflicted. Management teams looked to increase growth through strategic acquisitions, which were funded by greater amounts of debt and led to worsening credit quality. However, M&A in the telecom sector may be on hold as the Justice Department has blocked AT&T's (BBB-, stable) planned acquisition of Time Warner. The case is being brought to trial now, and many players in this sector may wait until it is resolved before moving ahead with any other strategic acquisitions.
The basic materials sector also performed well this quarter compared with the index. Commodity-oriented firms have benefited from improving credit metrics as a result of debt-deleveraging transactions over the past two years as well as a general recovery in commodity prices. Since the beginning of 2017, we have upgraded eight companies under our coverage and have not downgraded any. That follows five downgrades in the basic materials sector in 2016.
Rising interest rates have played a significant part in the divergence between the performance of investment-grade and high-yield credit spreads. With their lower credit spreads and longer average durations, performance of investment-grade bonds is more closely tied to movements in interest rates than that of high-yield bonds. High-yield bonds typically have shorter durations and wider credit spreads, which are more closely tied to the performance of the underlying companies. Similar to the credit spread widening that occurred during the "taper tantrum" in mid-2013, investors are beginning to require additional credit spread to compensate for the risk that interest rates will rise further.
With the 2-year Treasury bond on a multiyear rising trend and the Fed expected to raise the federal-funds rate a few more times this year, the pressure on corporate credit spreads has been especially pronounced at the short end of the curve. One Wall Street bond trader said, "Front-end paper remains for sale, causing credit curves to continue to flatten." (Front-end is industry jargon for short-term bonds.) The average spread in the 1- to 4-year tranche of the Morningstar Corporate Bond Index has widened 21 basis points thus far this year, whereas the 10-plus-year tranche has only widened 13 basis points.
According to the CME FedWatch Tool, the market is pricing in additional hikes to the federal-funds rate (currently 1.50%-1.75%) over the course of the year. The probability that the fed-funds rate at the end of 2018 will be greater than 1.75% is 97%, the probability that the rate will be 2% or higher is 77%, and the probability that the rate will be 2.25% or higher is now 35%. At the beginning of the year, those probabilities were 79%, 44%, and 13%, respectively.
The increase in the federal-funds rate following the March Federal Open Market Committee meeting was well telegraphed, but the markets were shaken by the increase in the Fed's projections for further rate hikes over the next two years. The median projection for the federal-funds rate at the end of 2018 is unchanged at 2.1%, but the median projection for 2019 increased to 2.9% from 2.7%, and the median projection for 2020 increased to 3.4% from 3.1%. Considering that its median projection for core personal consumption expenditures inflation remains near 2%, the Fed is indicating that it will need to raise short-term rates enough to keep inflation from overshooting its 2% inflation target. As investors digested the Fed's updated projections, the markets sold off after the meeting statement was released March 21, and the selling pressure ramped up the following day, sending volatility higher.
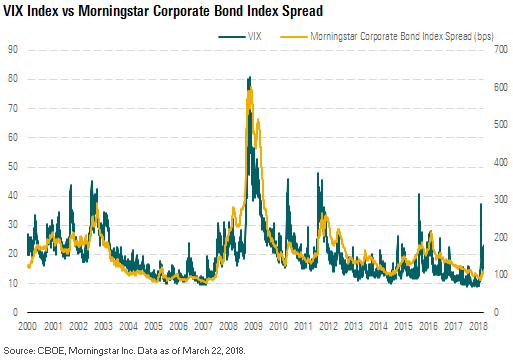
Historically, market volatility and corporate credit spreads have been highly correlated over time. Based on the average spread of the Morningstar Corporate Bond Index since 1990, the VIX and investment-grade credit spreads have a correlation of 85%. Volatility surged in the first quarter, with the CBOE Volatility Index (which measures the market expectations of near-term volatility as conveyed by S&P 500 stock index option prices) rising as high as 37 in early February from 11 at the end of 2017. The VIX has subsequently moderated to 23 but is still well above the levels it averaged in 2017, when it often registered below 10.
Compounding the pressures on the corporate bond markets, expectations for economic growth have been sliding. Since the beginning of March, the Atlanta Fed GDPNowcast for first-quarter real GDP has slipped to 1.8% from 3.5%. The projection had been as high as 4.2% in January, when the Atlanta Fed made its initial GDPNowcast for the first quarter. This forecast has been sliding as economic indicators have been decelerating. For example, the headline figure released for retail sales in February dropped 0.1% based on weak auto sales and lower gasoline prices, but even excluding the more volatile components, the control group only rose 0.1%. Expectations for retail sales were much higher going into this reading as economists expected the impact from tax cuts to boost consumption.
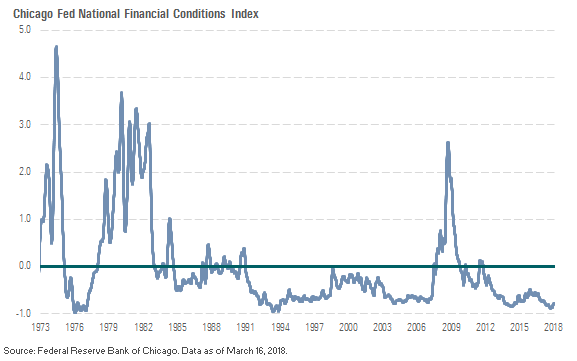
Finally, corporate credit spreads in the high-yield market are much more correlated to the individual financial performance of the underlying constituents. Fundamentals underlying high-yield issuers' credit risk have generally remained strong, as healthy earnings have led to improving credit metrics. Although GDP growth in the first quarter may end up being lower than originally forecast, the economic outlook remains constructive over the short term. In the medium term, financial conditions in the U.S. remain highly accommodative. The Federal Reserve Bank of Chicago publishes a weekly index that measures more than 105 variables to gauge how "loose" or "tight" financial conditions are among U.S. capital markets, as well as the traditional and shadow banking systems. These variables include credit availability and cost, leverage, risk, interest rates, and credit spreads. Index levels above zero indicate tighter-than-average conditions, whereas levels below zero represent looser-than-average conditions. While the level of the National Financial Conditions Index has weakened slightly since the end of last year, it remains near the strongest readings it has ever registered and is currently indicating that financial conditions remain near their loosest since October 1994.
High-Yield Outflows Set New Record in 1Q Outflows in the high-yield asset class among open-end mutual funds and exchange-traded funds set a new record for the greatest number of consecutive weekly outflows since we began tracking the data. There were eight consecutive weeks in which the net flows between the open-end funds and ETFs registered a net outflow. This surpassed the prior record for consecutive weekly outflows, which was six weeks. Those periods occurred in December 2014 through January 2015 and in July through August 2015.
Year to date, there has been a total of $12.8 billion of outflows in the high-yield sector, consisting of $7.3 billion of outflows among the open-end high yield mutual funds and $5.5 billion of net unit redemptions among the high-yield ETFs. Typically, open-end funds are considered a proxy for individual investors and ETFs are considered a proxy for institutional investor demand.
Morningstar Credit Ratings, LLC is a credit rating agency registered with the Securities and Exchange Commission as a nationally recognized statistical rating organization ("NRSRO"). Under its NRSRO registration, Morningstar Credit Ratings issues credit ratings on financial institutions (e.g., banks), corporate issuers, and asset-backed securities. While Morningstar Credit Ratings issues credit ratings on insurance companies, those ratings are not issued under its NRSRO registration. All Morningstar credit ratings and related analysis contained herein are solely statements of opinion and not statements of fact or recommendations to purchase, hold, or sell any securities or make any other investment decisions. Morningstar credit ratings and related analysis should not be considered without an understanding and review of our methodologies, disclaimers, disclosures, and other important information found at https://ratingagency.morningstar.com.

 United States