
It’s Time to Consider TIPS
Evaluating an often-misunderstood investment.
/s3.amazonaws.com/arc-authors/morningstar/1aafbfcc-e9cb-40cc-afaa-43cada43a932.jpg)

The Starting Point
At current prices, there’s a strong investment case to be made for Treasury Inflation-Protected Securities. Friday’s column will cover the particulars, showing how TIPS compare against conventional bonds over different inflation scenarios. That article will also examine how TIPS might perform in the secondary market, for investors who will not necessarily hold the securities until their maturity dates.
But first, some background. I have written about TIPS several times before, describing their use in a self-liquidating “bond ladder,” along with commenting about their sometimes peculiar behavior. But when doing so, I skipped the necessary first step. Today’s column atones for that mistake by addressing how TIPS are constructed and priced. Such insights will underpin Friday’s discussion.
Lower Yields
When the Treasury Department created TIPS in 1997, the newfangled securities yielded less than traditional Treasuries. That made sense: If consumer prices tend to rise—which they certainly do—then TIPS will pay a lower yield than nominal bonds when they are first issued. Otherwise, they would produce a free lunch.
My reaction was correct, but coming as it did before I examined the details, it oversimplified the case. Consider, for example, the scheduled distributions for a $100,000 investment in 1) a 30-year TIPS and 2) a conventional 30-year Treasury bond. Each security pays its current market yield, at 2.05% and 4.38%, respectively. We will assume the average future inflation rate to be 2.33%. (The reason for selecting that figure will later become clear.)
TIPS Versus Conventional Bonds: Yields
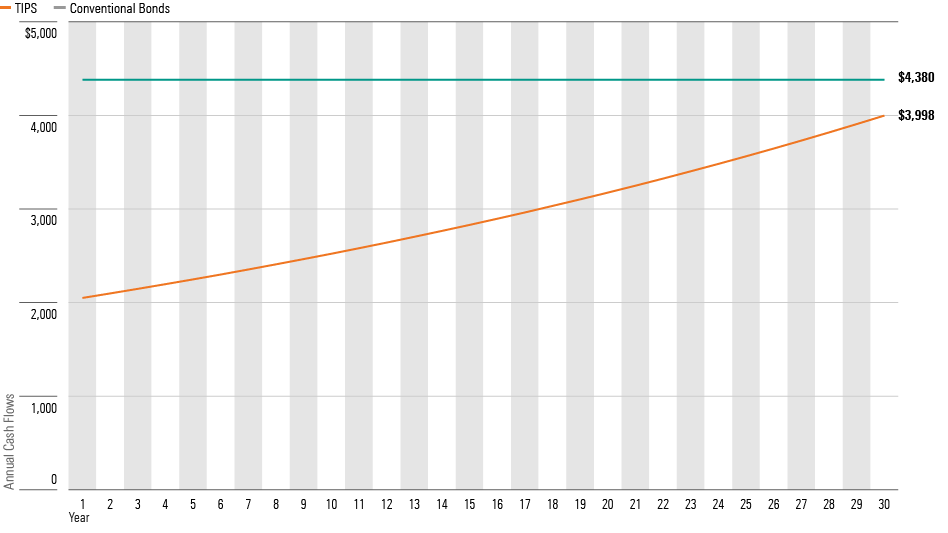
That looks wrong. According to this analysis, the payouts on TIPS will always trail those of conventional Treasury bonds. The expected inflation rate is indeed modest, but nudging it upward doesn’t change the story. For the cash flows on TIPS and nominal bonds to (roughly) match, 30-year annual inflation must average about 5%. That level greatly exceeds the economists’ predictions.
Higher Principal Amounts
The numbers are correct but incomplete. When creating TIPS, the Treasury Department decided that not only must the security’s yield keep pace with inflation, but so should its principal. Instead of structuring TIPS to adjust their interest rates in response to inflation, the department designed the securities to pay fixed rates, but on capital bases that vary. Every six months, the Treasury resets the bond’s principal in line with the change in inflation.
That decision makes sense, as—I realized upon reflection—it would be strange to receive real dollars when holding a TIPS and then be forced to take a pay cut upon reinvesting its proceeds. However, the approach complicates the math because it means that comparing TIPS with Treasuries involves more than just evaluating yields. The difference in capital bases must also be acknowledged.
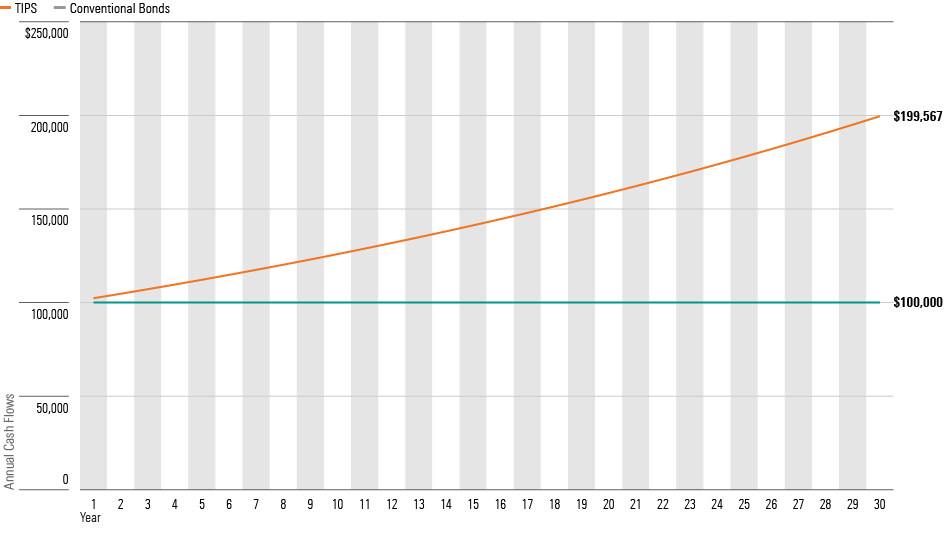
As the following figures demonstrate, those differences can be substantial. The table presents the previous case of a 30-year TIPS with a 2.05% yield, a long Treasury bond with a 4.38% yield, and 2.33% annual inflation. By this measure, the TIPS lands far ahead, boasting a final principal amount that doubles its rival’s.
TIPS Versus Conventional Bonds: Principal Values
Making It Real
Let’s sum each security’s total payouts, including redemption values, if held to maturity. As we saw, the TIPS provided lower yields but grew their principal amounts. Is the latter sufficient compensation?
TIPS Versus Conventional Bonds: Nominal Payouts
(Annual Principal Values, $100,000 Investment, 2.33% Inflation Rate)
| TIPS | Conventional Bond | |
|---|---|---|
| Cash flows | $87,602 | $131,400 |
| Principal redemption | $199,657 | $100,000 |
| Total | $287,169 | $231,400 |
From this view, the answer is yes. When all is said and done, a $100,000 investment in the TIPS nets $287,169, as opposed to $231,400 for the nominal bond. Does that mean that (assuming the 2.33% inflation rate) the TIPS is the better deal?
To answer yet another rhetorical question, it does not. We have failed to consider inflation’s effects. While TIPS owners will be delighted to receive $199,567 when their security matures, as opposed to the conventional bond’s $100,000, that boon will not occur for another three decades. Along the way, inflation will shrink the margin of their victory, because $99,567 will buy less in 2053 than it does this year. (Just as $1.25 in New York City once sufficed for a steak dinner but these days cannot procure a cup of coffee.)
Here are the results when the payments are computed in real terms.
TIPS Versus Conventional Bonds: Real Payouts
(Annual Principal Values, $100,000 Investment, 2.33% Inflation Rate)
| TIPS | Conventional Bond | |
|---|---|---|
| Cash flows | $61,500 | $95,973 |
| Principal redemption | $100,000 | $51,276 |
| Total | $161,500 | $147,249 |
Addressing inflation closed most of the gap, but not all. Expressed in real terms, the TIPS remains $14,251 ahead of the traditional bond. It would appear that the assumed inflation rate of 2.33% is too high: For the nominal bond to draw even with the TIPS, the inflation rate must be reduced, thereby shrinking the TIPS’ payouts.
Time Values
Not so. A final aspect is missing: the time value of money. Even if the real amounts match, that doesn’t mean the two securities are similarly valuable, because the early bird gets more worms. That is, the extra yield received by the nominal bond may be reinvested, accruing additional profits, while the higher redemption amount provided by TIPS does not arrive until the end.
That oversight can be fixed by calculating each security’s internal rate of return, which takes into account not only the amount of their cash flows, but also the timing of those receipts. Doing so reveals that your author has successfully rigged the test. Each security offers an IRR of 4.38%, and thus they are worth the same.
TIPS Versus Conventional Bonds: IRRs
| TIPS | Conventional Bond | |
|---|---|---|
| Interest rate | 2.05% | 4.38% |
| Inflation rate | 2.33% | 2.33% |
| Internal rate of return | 4.38% | 4.38% |
| Breakeven rate | 2.33% | 2.33% |
The IRRs are equal only if inflation averages exactly 2.33%. If inflation over the next 30 years averages more than that, TIPS will be superior. If the figure is less, then nominal bonds will be the better option. That number is therefore called “the breakeven rate” for TIPS. Fortunately, it need not be computed as I did when writing this column, by determining each security’s future cash flows and then running an IRR calculation. It may be obtained much more simply, by subtracting the TIPS yield from the nominal bond’s yield. Thus, 4.38% - 2.05% = 2.33%.
Back to the Start
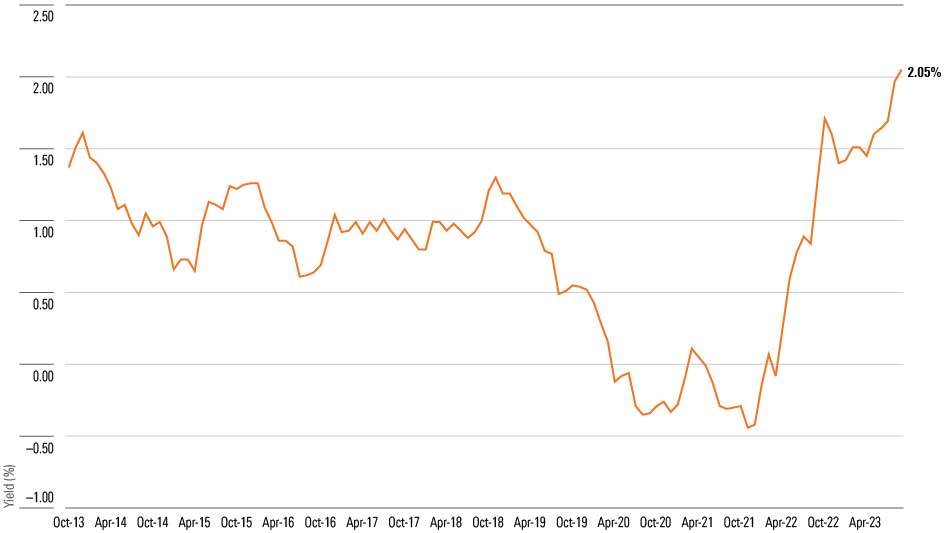
We are now prepared for Friday’s article, which will apply these concepts when assessing TIPS’ current value. Previewing that analysis is the following chart, which displays the past decade’s yields for 30-year TIPS. Bad news for longtime TIPS investors, who suffer capital losses when real yields rise. But good news for prospective buyers!
Yield History: 30-Year TIPS
The opinions expressed here are the author’s. Morningstar values diversity of thought and publishes a broad range of viewpoints.
The author or authors do not own shares in any securities mentioned in this article. Find out about Morningstar’s editorial policies.
/cloudfront-us-east-1.images.arcpublishing.com/morningstar/G3DCA6SF2FAR5PKHPEXOIB6CWQ.jpg)
/cloudfront-us-east-1.images.arcpublishing.com/morningstar/6ZMXY4RCRNEADPDWYQVTTWALWM.jpg)
:quality(80)/s3.amazonaws.com/arc-authors/morningstar/1aafbfcc-e9cb-40cc-afaa-43cada43a932.jpg)