
Investment-Grade Bonds Catch a Bid In July
A multitude of concerns kept investment-grade investors at bay in the first half.

After steadily widening out since hitting their tightest levels in February, investment-grade corporate bonds finally caught a bid in July. Since the end of June, the average spread of the Morningstar Corporate Bond Index (our proxy for the investment-grade market) has tightened 8 basis points to +120. However, even after accounting for this rebound, the spread in the investment-grade market remains close to the widest levels it has traded at since the beginning of 2017.
In the high-yield market, since the end of June the average spread of the BofA Merrill Lynch High Yield Master Index has tightened 16 basis points to end last week at +359. While investment-grade spreads are not that far off their widest levels since the beginning of 2017, the high-yield market is trading near the midpoint of its range over the same period. The high-yield market has performed better year to date, as the average credit spread in the investment-grade bond market has widened 24 basis points whereas the average spread of the high-yield index has tightened 4 basis points.
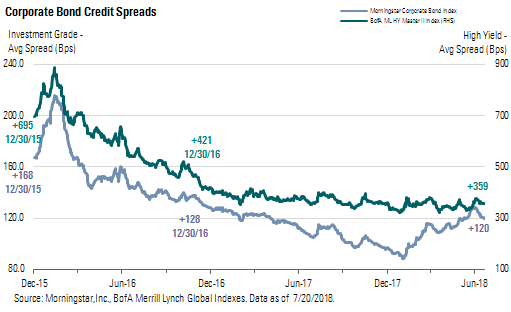
From burgeoning rhetoric concerning a potential trade war to rising interest rates to renewed expectations of a resurgence in large-scale debt-leveraging acquisitions, a multitude of concerns have kept investors at bay in the investment-grade market during the first half of the year. However, high-yield issuers typically depend less on foreign trade, and with their shorter durations, high-yield bonds are less correlated to rising interest rates. As such, the high-yield market has not been as negatively affected as the investment-grade market. In addition, more often than not, high-yield companies are beneficiaries from merger and acquisition activity as they are often purchased by larger, investment-grade companies and the outstanding debt of those acquired high-yield companies is then upgraded to the same rating as the acquirer. Historically, performance in the high-yield market has been more closely tied to economic activity. With economic metrics coming in stronger than expected, as of July 18, the Federal Reserve Bank of Atlanta's GDPNow estimate for second-quarter GDP growth is 4.5%. If the economy were to register this rate of growth, it would represent the strongest quarterly growth rate since the third quarter of 2014.
With second-quarter earnings reports kicking in, investor focus has turned to individual corporate performance. Earnings thus far have been robust, which has led to a general improvement in sentiment across the investment-grade market. For example, in the transportation sector, CSX (BBB+, stable) and Union Pacific (A-, stable) reported record second-quarter earnings. Earnings in the banking sector have similarly been strong. JPMorgan Chase (A, stable) reported top-line growth of 8% and earnings growth of 18%. In the industrial sector, Honeywell International (A, stable) reported solid second-quarter results, as the booming economic backdrop helped the industrial giant produce 6% organic sales growth and led it to raise its guidance for 2018. In the pharmaceutical industry, Novartis (AA, stable) posted solid quarterly operating results even as it faces global generic competition for its once top-selling cancer medicine pharmaceutical Gleevec.
Year to date, the Morningstar Corporate Bond Index (our proxy for the investment-grade market) has lost 2.56%, whereas the BofA Merrill Lynch High Yield Master Index has risen 0.69%. The differential has been driven by the divergence in credit spread performance (as investment-grade spreads have widened, as opposed to high-yield spreads, which have tightened), the increase in interest rates, and the higher yield carry offered by high-yield bonds. Since the end of last year, interest rates have risen significantly as the 2-year, 5-year, 10-year, and 30-year bonds have risen 71, 55, 48, and 29 basis points, respectively.
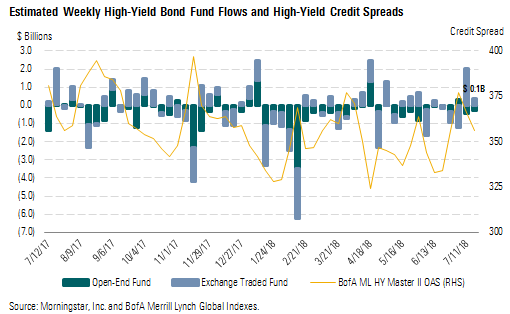
Weekly High-Yield Fund Flows High-yield fund flows edged $0.1 billion higher last week as $0.4 billion of net unit creation among exchange-traded funds was just more than enough to offset the $0.3 billion of redemptions in open-end funds. Year to date, fund flows have registered a total outflow of $14.3 billion, consisting of $3.9 billion of net unit redemptions across ETFs and $10.4 billion of redemptions among open-end funds.
Morningstar Credit Ratings, LLC is a credit rating agency registered with the Securities and Exchange Commission as a nationally recognized statistical rating organization ("NRSRO"). Under its NRSRO registration, Morningstar Credit Ratings issues credit ratings on financial institutions (e.g., banks), corporate issuers, and asset-backed securities. While Morningstar Credit Ratings issues credit ratings on insurance companies, those ratings are not issued under its NRSRO registration. All Morningstar credit ratings and related analysis contained herein are solely statements of opinion and not statements of fact or recommendations to purchase, hold, or sell any securities or make any other investment decisions. Morningstar credit ratings and related analysis should not be considered without an understanding and review of our methodologies, disclaimers, disclosures, and other important information found at https://ratingagency.morningstar.com.

 United States