
Credit Spreads Snap Wider
/s3.amazonaws.com/arc-authors/morningstar/54f9f69f-0232-435e-9557-5edc4b17c660.jpg)
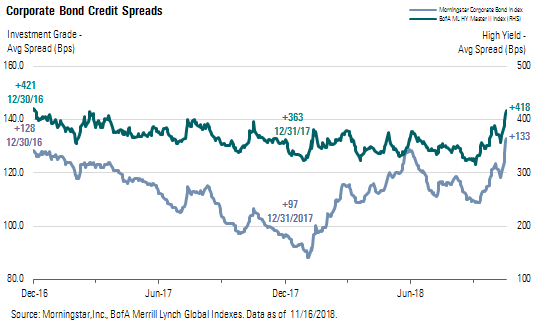
Last week, corporate credit spreads snapped to their widest levels since the end of 2016. The combination of declining oil prices, falling equity prices, and rising international trade tensions was more than the market could bear, and investors tried to reduce their exposure to corporate bonds. The average spread of the Morningstar Corporate Bond Index (our proxy for the investment-grade market) widened 13 basis points to end the week at +133. In the high-yield market, the BofA Merrill Lynch High Yield Master Index gapped 47 basis points wider and ended the week at +418. Year to date, the average spread of the investment-grade index is 36 basis points wider and the high-yield index is 55 basis points wider.
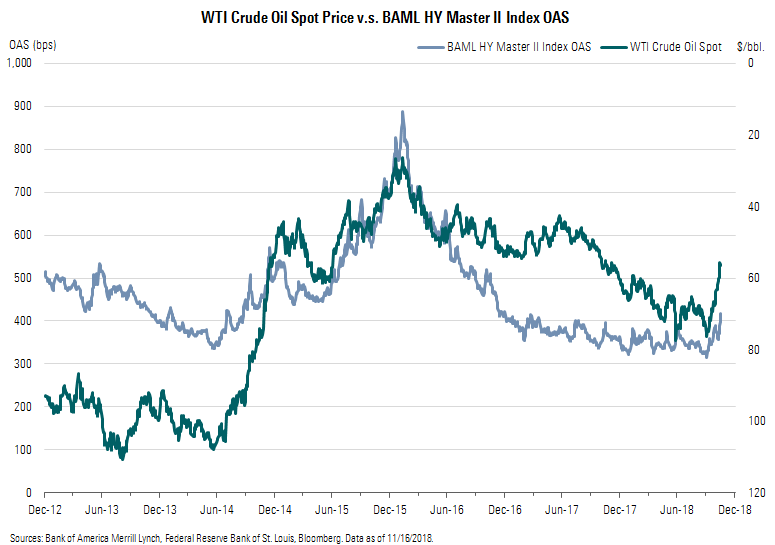
The energy component of the indexes has been weakening as oil prices have fallen 25% from their recent highs at the beginning of October to below $57 per barrel last Friday. Since oil prices peaked Oct. 3 at $76.40, the average spread of the energy sector in the Morningstar Corporate Bond Index has widened 39 basis points to +173. Over this same period, the energy component of the high-yield index widened 155 basis points to +512.
In 2014 and 2015, the free-fall in oil prices had an outsize impact on the high-yield market as the energy sector represents 16% of the overall index. As a comparison, the next-largest sector represents only 11% of the index. In the following chart, we have inverted the price of oil compared with the average credit spread of the overall index. Thus far this year, the strength of the economy and robust earnings have driven credit spreads tighter in other sectors, offsetting much of the widening in the energy sector.
Among other factors that pressured risk assets last week, global trade tensions continued to flare up. The rhetoric between the United States and China did not show any signs of calming as the countries continue to threaten each other with trade sanctions and retaliatory trade barriers. Further, as we close in on the end of 2018, investors are becoming increasingly worried that the United Kingdom will not be able to successfully negotiate a trade agreement with the European Union before it exits the trade bloc in March 2019.
In the U.S. Treasury market, bond prices skyrocketed as investors looked for shelter from falling asset prices. The yield on the 2-year U.S. Treasury bond declined 12 basis points to 2.80%, and the yield on the 5-year fell 16 basis points to 2.88%. In the longer end of the curve, the 10-year declined 12 basis points to 3.06% and the 30-year decreased 6 basis points to 3.32%. The spread between the 2-year and the 10-year remained flat at 26 basis points. Year to date, interest rates have risen across the entire yield curve. Interest rates on the 2-, 5-, 10-, and 30-year Treasuries have risen 92, 67, 65, and 58 basis points, respectively.
Rising interest rates and widening credit spreads have taken their toll on the corporate bond market thus far this year. With its longer duration and greater sensitivity to interest rates, the Morningstar Corporate Bond Index has fallen 3.54%. High yield had held on to a slight gain for most of the year, but widening credit spreads pushed it into the red as the BofA Merrill Lynch High Yield Master Index is currently registering a loss of 0.20% through last Friday.
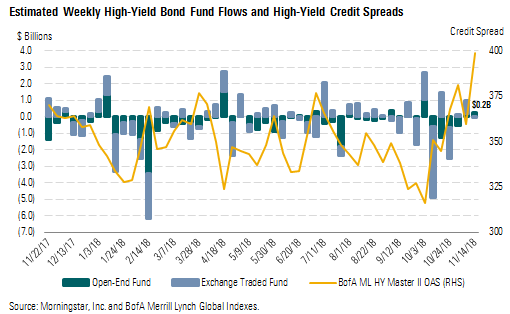
Weekly High-Yield Fund Flows Net fund inflows were $0.2 billion last week, consisting mainly of $0.2 billion of inflows among open-end funds as the amount of net unit creation across high-yield exchange-traded funds was negligible. However, we note that our fund flows calculation is compiled on Wednesday for the prior week and that the bulk of last week's credit spread widening occurred on Thursday and Friday. We suspect that fund flows would have been negative, especially among ETFs, on those two days. Year to date, total outflows across the high-yield sector have been decidedly negative. Thus far this year, investors have pulled $19.3 billion out of the junk bond market. Outflows among open-end funds are $13.4 billion and net unit redemptions in ETFs are $5.8 billion.
Morningstar Credit Ratings, LLC is a credit rating agency registered with the Securities and Exchange Commission as a nationally recognized statistical rating organization ("NRSRO"). Under its NRSRO registration, Morningstar Credit Ratings issues credit ratings on financial institutions (e.g., banks), corporate issuers, and asset-backed securities. While Morningstar Credit Ratings issues credit ratings on insurance companies, those ratings are not issued under its NRSRO registration. All Morningstar credit ratings and related analysis contained herein are solely statements of opinion and not statements of fact or recommendations to purchase, hold, or sell any securities or make any other investment decisions. Morningstar credit ratings and related analysis should not be considered without an understanding and review of our methodologies, disclaimers, disclosures, and other important information found at https://ratingagency.morningstar.com.
/cloudfront-us-east-1.images.arcpublishing.com/morningstar/AGAGH4NDF5FCRKXQANXPYS6TBQ.png)
/cloudfront-us-east-1.images.arcpublishing.com/morningstar/OMVK3XQEVFDRHGPHSQPIBDENQE.jpg)
:quality(80)/s3.amazonaws.com/arc-authors/morningstar/54f9f69f-0232-435e-9557-5edc4b17c660.jpg)