
Corporate Credit Spreads Largely Unchanged as Supply Equals Demand
Although the stock market eked out a gain last week, the S&P 500 is muddling along near the middle of its year-to-date trading range.

Although the stock market eked out a gain last week, the S&P 500 is muddling along near the middle of its year-to-date trading range. Corporate credit spreads in the investment-grade market ended the week unchanged. In the high-yield market, credit spreads tightened slightly but lagged far behind their prior-week performance. The average spread of the Morningstar Corporate Bond Index ended the week at +109, and the average spread of the BofA Merrill Lynch High Yield Master Index tightened 5 basis points to +333 basis points. At this level, high-yield credit spreads are near the low end of the 90-basis-point range that they have traded in since the beginning of 2017. While credit spreads in the high-yield market are near the lows they hit in January, credit spreads in the investment-grade market remain well wide of the levels they hit earlier this year.
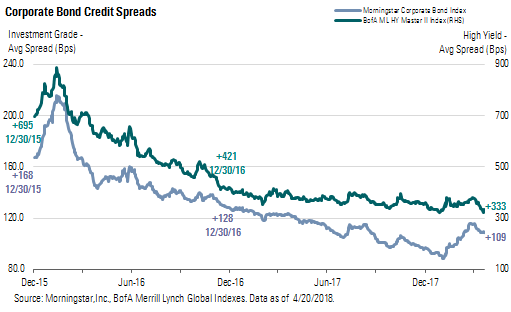
According to one Wall Street bond trader, supply and demand in the investment-grade bond market were balanced as the amount of new issue supply was evenly matched with investors with a limited amount of cash that needed to be put to work. According to this trader, the demand from international investors has mostly dried up and the real underlying demand in the marketplace has been from domestic buyers. He said the massive selling in short-duration corporate bonds that occurred earlier this year (which was what pushed investment-grade credit spreads wider) has subsided, and the market has "kinda sorta stabilized." Some front-end buyers have begun to emerge as the higher all-in yield on shorter-duration paper has attracted attention, but the trader noted that the buyers are a different investor base than those seen last year. In addition to the re-emergence of buyers in the short end, he said many institutional investors have been looking to improve the quality of their portfolios by swapping out of lower-rated issuers and into higher-rated issuers.
In the high-yield market, the continued rise in oil prices has helped to propel the index to within 10 basis points of the tightest levels it has reached this year and the tightest that it has traded since before the 2008-09 global credit crisis. The average spread of the energy sector has tightened to inside +400, the tightest it has traded since early January. In addition to oil prices charging higher, other commodity prices, such as aluminum, in the metal market have surged. The prices have helped propel the average spread of bonds in the metals and mining subsector tighter. The average spread of the metals and mining sector tightened 13 basis points last week to +334, the tightest it has traded since mid-February.
Interest rates continued their march higher, and the yield on the 10-year Treasury bond ended the week within spitting distance of 3%. Last week, we noted that both headline and core CPI were running near the Federal Reserve's inflation goal and that with inflation running at the Fed's preferred rate, investors are pricing in several more hikes to the federal-funds rate this year. The yield on the U.S. 2-year Treasury bond increased 10 basis points to 2.46%, its highest since August 2008. The yield on the 5-year Treasury bond rose 13 basis points to 2.80%, its highest since August 2009. The yield on the 10-year rose 13 basis points to 2.96%, its highest since it hit 3% at end of 2013. Although the 10-year Treasury bond yield touched 3% in 2013, it has not traded above 3% on a sustainable basis since 2011. Along the longest end of the curve, the 30-year bond rose 12 basis points to 3.15%. According to the CME FedWatch Tool, the market-implied probability that the federal-funds rate will end the year at 200 basis points or higher rose by 6%, to 90%. The probability that the federal-funds rate will end the year at 225 basis points or higher rose by 9%, to 45%.
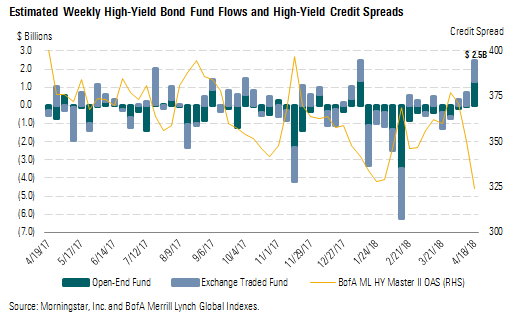
Weekly High-Yield Fund Flows Surge, but Inflows May Be Short-Lived Two weeks ago, we noted that investors were just starting to dip their toes back into the waters of the high-yield market after staying on dry land for the past three months. Investors plunged headfirst into the deep end last week as net inflows into high-yield open-end mutual funds and exchange-traded funds totaled $2.5 billion for the week ended April 18. This amount of inflows tied for greatest weekly inflow over the past 52 weeks and tied for the 10th-greatest amount of weekly inflows since the beginning of 2014. Inflows were evenly split between $1.3 billion of deposits into open-end funds and $1.2 billion of net unit creation among the exchange-traded funds.
However, volatility is still the name of the game in the high-yield market. On April 19, the day after our weekly high-yield fund flows amount was calculated, there was a net unit redemption of $685 million out of the high-yield sector. Those redemptions were driven in $531 million of new unit redemptions among the high-yield ETFs and $155 million of outflows reported by open-end funds that report daily fund flows.
Through April 18, even after incorporating for the surge of inflows, there has been a total of $10.3 billion of outflows across the high-yield sector, consisting of $6.7 billion of outflows among the open-end high-yield mutual funds and $3.6 billion of net unit redemptions among the high-yield ETFs.
Morningstar Credit Ratings, LLC is a credit rating agency registered with the Securities and Exchange Commission as a nationally recognized statistical rating organization ("NRSRO"). Under its NRSRO registration, Morningstar Credit Ratings issues credit ratings on financial institutions (e.g., banks), corporate issuers, and asset-backed securities. While Morningstar Credit Ratings issues credit ratings on insurance companies, those ratings are not issued under its NRSRO registration. All Morningstar credit ratings and related analysis contained herein are solely statements of opinion and not statements of fact or recommendations to purchase, hold, or sell any securities or make any other investment decisions. Morningstar credit ratings and related analysis should not be considered without an understanding and review of our methodologies, disclaimers, disclosures, and other important information found at https://ratingagency.morningstar.com.

 United States