
Corporate Bond Market Stuck in Narrow Trading Range While Equities Hit New Highs
Volatility brought about by Turkey's chaos has quickly dissipated.

Last week, we highlighted the divergence emerging among the performance of different asset classes. This divergence continued last week as the equity market marched toward all-time highs while the corporate bond market refused to follow, stubbornly remaining in a narrow trading range. Typically, when investor sentiment is risk on in the equity markets, the demand for U.S. Treasury bonds dwindles; however, the yields on long-term Treasuries declined as investors bid up long-term government bonds. Finally, after trending higher the past few months, the U.S. dollar pulled back slightly.
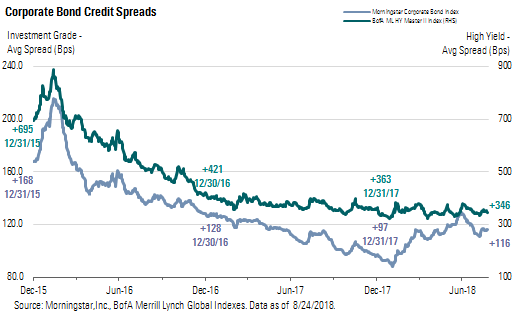
In the corporate bond market, the average spread of the Morningstar Corporate Bond Index (our proxy for the investment-grade market) was unchanged, ending the week at +116. In the high-yield market, the BofA Merrill Lynch High Yield Master Index tightened 3 basis points to end the week at +346. Among U.S. Treasuries, the 2-year rose 1 basis point to 2.62%, but the 5-year declined 3 basis points to 2.71%. In the longer end of the yield curve, the yield on the 10-year decreased 5 basis points to 2.82% and the 30-year fell 6 basis points to 2.96%.
The 2-year Treasury has seen its interest rate rise 74 basis points thus far this year and is trading at its highest yield since mid-2008. The increase in yield has been heavily influenced by the Federal Reserve's monetary policy. The Fed has increased the federal-funds rate by 50 basis points this year to 1.75%-2% and the market is pricing in with near certainty that the Fed will increase the target range another 25 basis points. to 2%-2.25%, following the September Federal Open Market Committee meeting. In addition, the market is pricing in a 64% probability that the Fed will hike the rate above 2.25% by the end of the year. However, while short-term rates continue to increase, the yield on the 10-year Treasury bond has traded in a relatively narrow range since early this year. Between the rising short-term rates and steady long-term rates, the slope of the yield curve is its flattest since fall 2007.
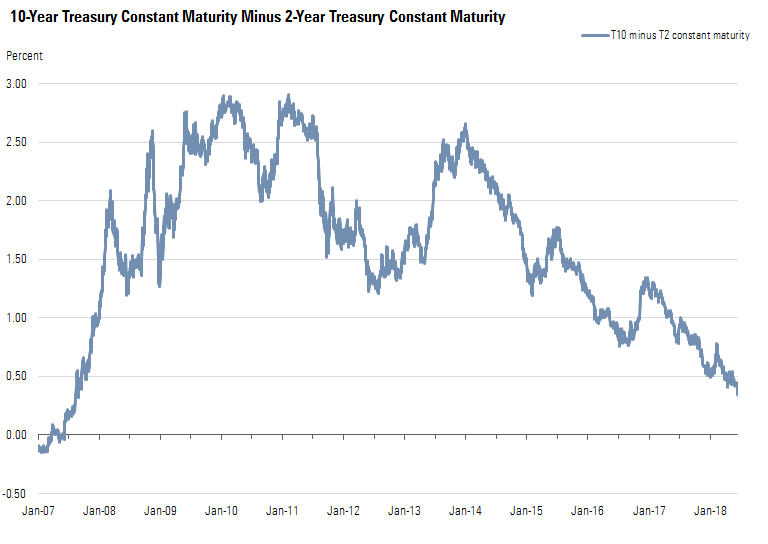
The yield curve has been on a multiyear flattening trend since the Fed began to raise short-term rates in its pursuit of normalized monetary policy. Historically, when the yield curve has been flattening, it has often been an indicator of a weakening economy and in many cases portended an impending recession. This time around, this signal may not be foreshadowing a near-term recession risk, as it is being heavily influenced by global central bank actions and economic activity hasn't shown any indication of slowing. In fact, as an indication of current economic strength, the Atlanta Fed's GDPNow model forecast for third-quarter real GDP growth is 4.6%, which would be an acceleration from 4.1% in the second quarter and the strongest quarterly growth rate since the third quarter of 2014.
While the Fed's monetary policy actions have been directly affecting short-term rates in the United States, rates in other developed markets continue to be influenced by central bank interventions. For example, the European Central Bank has held its short-term deposit rate at negative 0.40% for several years and will probably hold it there through the summer of 2019. Furthermore, although the ECB announced that it will begin to taper its asset purchases this fall, it will continue to purchase EUR 30 billion of debt securities per month through September and then reduce the purchases to EUR 15 billion per month until the end of the year. Even though the 10-year U.S. Treasury is yielding only 2.82%, that yield has been attractive to global bond investors as the yield on Germany's 10-year bond is only 0.34%, and the yield on Japan's 10-year bond is barely positive at 0.10%.
The collapse of Turkey's currency and its sovereign bonds generated a lot of turmoil in the markets a few weeks ago, but the volatility brought about by this chaos has quickly dissipated. Although the lira has fallen 37% thus far this year and 18% in August alone, the exchange rate has stabilized and was unchanged last week. Turkey's 6.125% notes due 2028 traded up over 2 points last week to 86.375, which equates to an 8.06% yield to maturity or a spread of 524 basis points over comparable U.S. Treasuries. While Turkish asset prices have stabilized in the near term, the damage from the rout in Turkish assets has not been undone. For example, the yield on Turkey's 10-year bond remains 200 basis points higher than where these notes were issued in mid-April. The notes initially traded over par after issuance at a yield of 6.05% before beginning their downward plunge.
Initially, investors feared that contagion from financial distress in Turkey would spread to other emerging markets as well as to those European banks with significant direct exposure to Turkey and Turkish corporations. As such, the equity prices for Italian bank stocks took a hit and have yet to recover. In addition, the prices on Italian bonds fell precipitously, and spreads on its credit default swaps widened considerably as investors have become concerned that some Italian banks could require a bailout if Turkey were to default. The price on Italy's 10-year sovereign bond remains near its lows, and its spread over German bonds is at its widest level since mid-2013, when the country's securities were still recovering after the 2011-12 European sovereign debt and banking crisis.
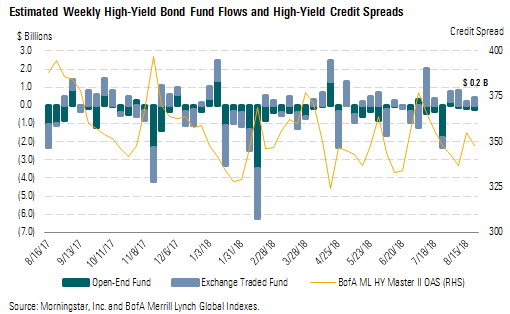
Weekly High-Yield Fund Flows Over the past four weeks, volatility in high-yield fund flows has declined toward its lowest level over the past year. Net fund flows into the high-yield asset class of $0.2 billion consisted of $0.4 billion of net unit creation across high-yield exchange-traded funds, partially offset by $0.2 billion of outflows among open-end high-yield mutual funds. Year to date, fund flows have registered a total outflow of $14.9 billion, consisting of $2.4 billion of net unit redemptions across ETFs and $12.6 billion of redemptions among open-end funds.
Morningstar Credit Ratings, LLC is a credit rating agency registered with the Securities and Exchange Commission as a nationally recognized statistical rating organization ("NRSRO"). Under its NRSRO registration, Morningstar Credit Ratings issues credit ratings on financial institutions (e.g., banks), corporate issuers, and asset-backed securities. While Morningstar Credit Ratings issues credit ratings on insurance companies, those ratings are not issued under its NRSRO registration. All Morningstar credit ratings and related analysis contained herein are solely statements of opinion and not statements of fact or recommendations to purchase, hold, or sell any securities or make any other investment decisions. Morningstar credit ratings and related analysis should not be considered without an understanding and review of our methodologies, disclaimers, disclosures, and other important information found at https://ratingagency.morningstar.com.

 United States