

Global long-term funds had their weakest inflows since 2011 with $606 billion in 2018, a massive drop-off from 2017's record $2 trillion. As volatility surged in the fourth quarter, many investors retreated to money market funds, which had their best year since 2008 with inflows of $331 billion and organic growth of 7.8%; yet, fixed-income funds took the brunt of this risk aversion much more than equity funds. What was perhaps most striking in 2018 was how consistent these trends were across regions. Regardless of domicile, investors seemed to share similar preferences.
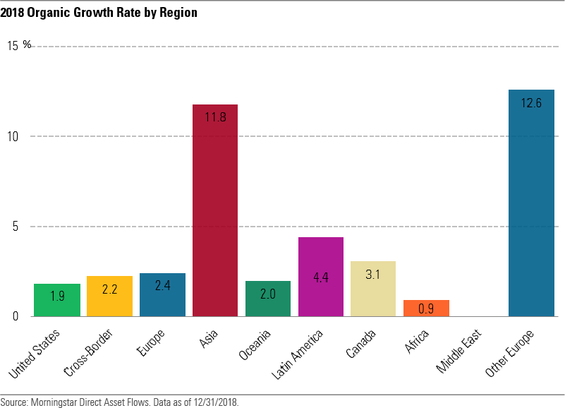
Slowdown in 2018 long-term fund flows was a global phenomenon
Every major region showed massive declines in long-term flows from 2017. Excluding money market funds, long-term flows in the United States fell from $692 billion to $156 billion. In Europe, long-term flows dropped from $518 billion to $132 billion. However, it should be noted that neither 2017 nor 2018 was a normal year, with the former showing record inflows and the latter showing the weakest long-term flows since 2011.
The only region to defy this trend in 2018 was Asia, which saw long-term flows increase from $126 billion to $169 billion. As shown in the graph below, Asia’s organic growth led all major regions, but this growth comes with a caveat. The Bank of Japan’s intervention, which included buying $65 billion worth of exchange-traded funds, accounted for much of this increase.
Many investors ditched bond funds for money market funds
Investors in bond funds arguably showed the greatest risk-aversion in 2018, pulling $117 billion in 2018's fourth quarter. Overall, bond funds collected $156 billion in 2018, a massive drop from 2017's $891 billion. This was the group's worst showing since 2013. Bond investors cut credit risk and sought shelter among short-duration vehicles, including, as mentioned above, money market funds. U.S. fixed-income inflows led the group with $102 billion, and the top-selling fund was iShares Short Treasury Bond ETF SHV.
Conversely, the most-redeemed funds typically had credit exposure of some kind. European-bond funds Carmignac Sécurité, a short-term bond fund in France, and Allianz Floating Rate Notes Plus saw $2.4 billion and $2.2 billion of outflows in 2018, respectively. India fixed income had the greatest outflows within the group, at $31 billion. HDFC Floating Rate Debt had the greatest outflows among that group with $1.2 billion.
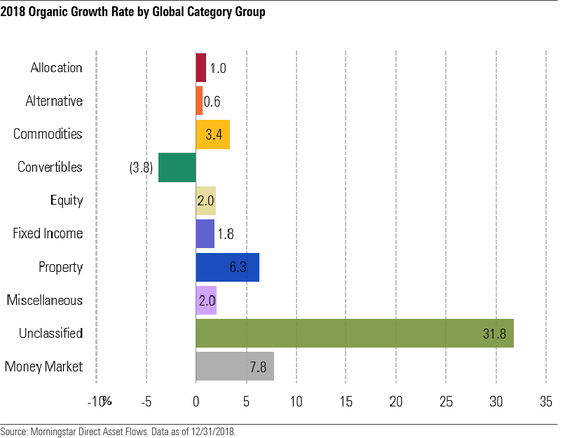
Meanwhile, the cryptically named unclassified category of funds saw the greatest organic growth, as seen in the graph below. Brazil’s Itau Flexprev Master FI RF, which in reality is a fixed-income-heavy allocation fund, saw the greatest flows from this group, $2.5 billion.
Equity flows showed resilience in behavioral shift
Despite the MSCI All-Country World Index falling 7.7% (in local terms) in 2018, investors still deposited $352 billion into equity funds. Although this was a big drop from 2017's $604 billion, it was far better than inflows during the prior two corrections in 2011 and 2016, when equity funds collected just $40 billion and $51 billion, respectively. In fact, despite the index's 12.5% loss in 2018's fourth quarter, equity funds still had positive inflows of nearly $27 billion. Plus, all major regions saw significant equity inflows, showing geographic consistency.
This resilience may owe largely to the increasing prominence of target-date funds and similar managed-portfolio solutions, and the underlying funds used by them. Because such portfolios have fixed percentage allocations to their underlying funds, it's likely that fourth-quarter equity flows were positive in part because of falling stock prices. That is to say, such managed portfolios would have been forced to invest more in equity funds in order to maintain their target allocations. If this was indeed the catalyst, it's a big shift from the days of investors chasing the latest hot fund.
Passive funds continue to take market share
Passive index funds continued to enjoy strong inflows at the expense of their active counterparts. Index funds collected $695 billion in 2018 representing organic growth of 7.8%, although this was down from 2017's record $962 billion. Nearly $506 billion went to equity funds, while fixed-income index funds collected $171 billion.
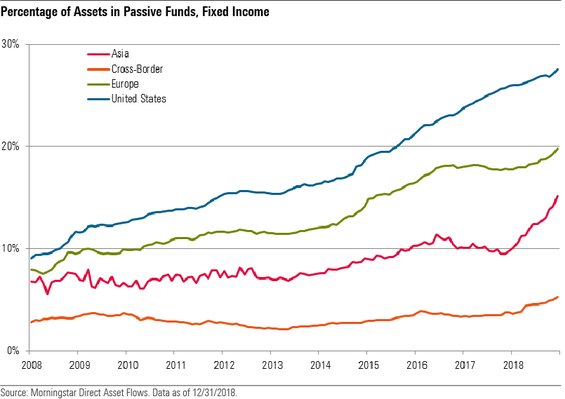
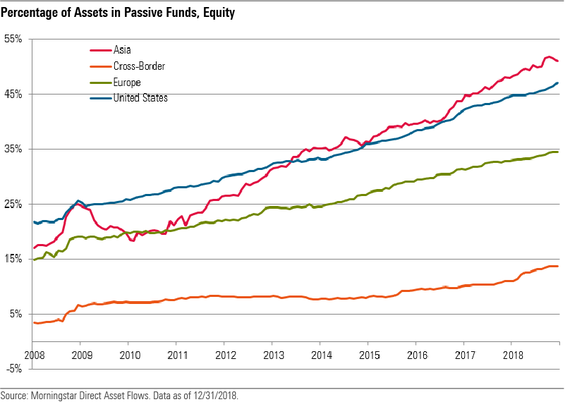
However, passive fixed-income funds had greater organic growth, 10.9% versus 7.3%. Overall, passive fixed-income funds saw their market share relative to their active counterparts grow to 20.2% from 18.2%. Equity index funds saw their market share grow to 41.4% from 38.9% in 2017. The graphs below show index-fund market share growth by region for fixed-income and equity funds.
While the U.S. led the major regions with $459 billion in total index flows, demand was strong globally. Asia had about $117 billion in passive inflows, although, as mentioned above, this was heavily influenced by the Bank of Japan's intervention, while European investors directed about $80 billion to index funds.
Meanwhile, long-term (excluding money-market funds) active funds lost $87 billion to outflows, the group's first net outflows since 2008. Active equity funds were hit the hardest, losing about $153 billion to outflows, followed by nearly $16 billion in active fixed-income outflows.
Please see below for important disclosure.