
Fund Investors Didn't Load Up on Stocks Before Market Downturn
Morningstar's fund flow data suggests investors took active steps to rebalance their portfolios in 2019.
/s3.amazonaws.com/arc-authors/morningstar/360a595b-3706-41f3-862d-b9d4d069160e.jpg)
Editor’s note: Read the latest on how the coronavirus is rattling the markets and what investors can do to navigate it.
Any type of equity exposure has been painful lately. The sharp drop in equity values at the end of February ranked as the third-largest weekly decline, and market volatility has spiked up to levels we haven't seen since the financial crisis. That said, things could have been considerably worse for fund investors.
Because the market has been so strong for most of the past 11 years, simply letting your asset allocation ride would have resulted in a big runup in equity exposure over time. As my colleague Adam Millson pointed out, if you started out with a 60/40 portfolio mix in 2010, you would have ended up with closer to 80% in stocks by the end of 2019.
But while some investors probably own more stocks than they should, the asset totals invested across the fund industry paint a more reassuring picture. We looked at total assets by broad category group for mutual funds, exchange-traded funds, and money market funds over the past 21 years. (We excluded funds of funds from the analysis to avoid double-counting assets.)
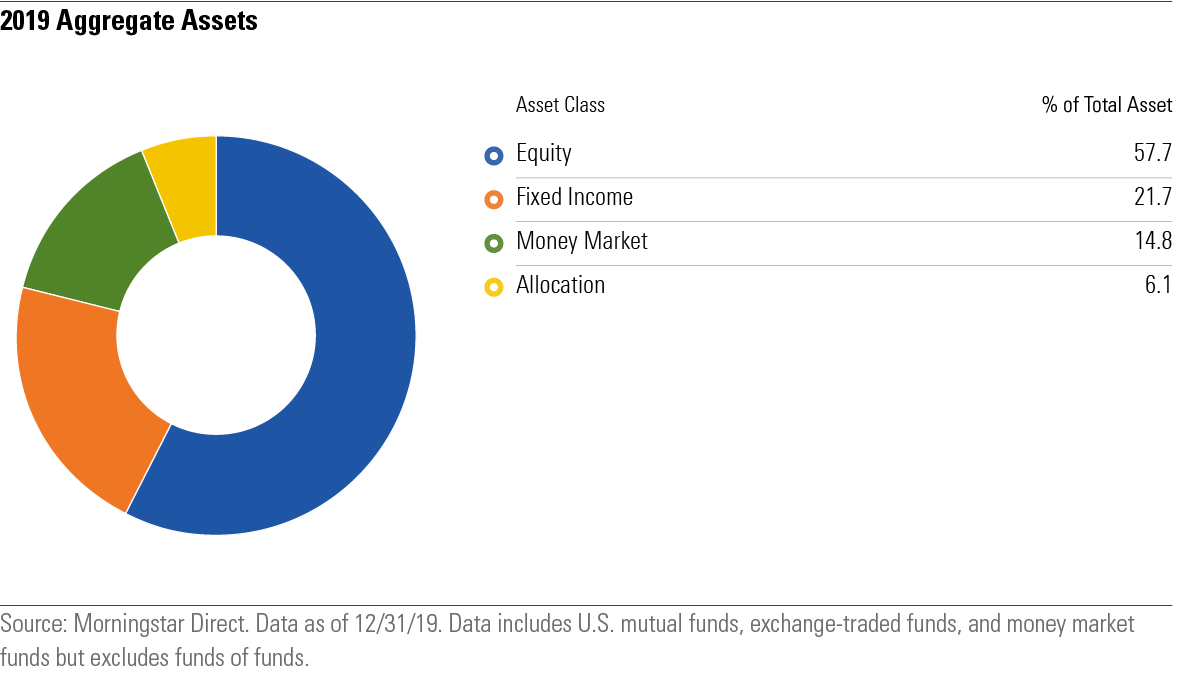
Overall, the dispersion of assets as of Dec. 31, 2019, suggests that industrywide assets are pretty well diversified across different asset classes, with about 57.7% of aggregate assets invested in equities, 21.7% in fixed-income funds, and 14.8% in money market funds. (The remaining 6.1% is invested in allocation funds, which generally have a similar stock/bond split as the rest of the assets and shouldn’t significantly change the overall mix.)
Those allocations aren't too far off from what a standard asset-allocation model might recommend for a typical fund investor. Based on data from the Investment Company Institute, the median age for the head of a household is 51 for households owning mutual funds, and 49 for households owning exchange-traded funds. That would imply about 15 years to retirement for a typical fund shareholder, although investors closer to retirement probably account for a larger share of assets. If anything, fund shareholders appear to be a little light on equity exposure. The average target-date fund series allocates about 71% of its assets to equities for investors 15 years from retirement, decreasing to 61% for investors 10 years from retirement. (It's worth noting, though, that target-date funds are typically only geared toward retirement assets and don't include separate allocations for shorter-term spending, such as an emergency fund or savings earmarked for near-term goals.)
What’s more, these allocations didn’t happen by accident; instead, investors had to make some disciplined portfolio moves to achieve them. As noted above, equity allocation could have easily gotten out of control if investors failed to rebalance while the market continued its nearly uninterrupted run in 2019.
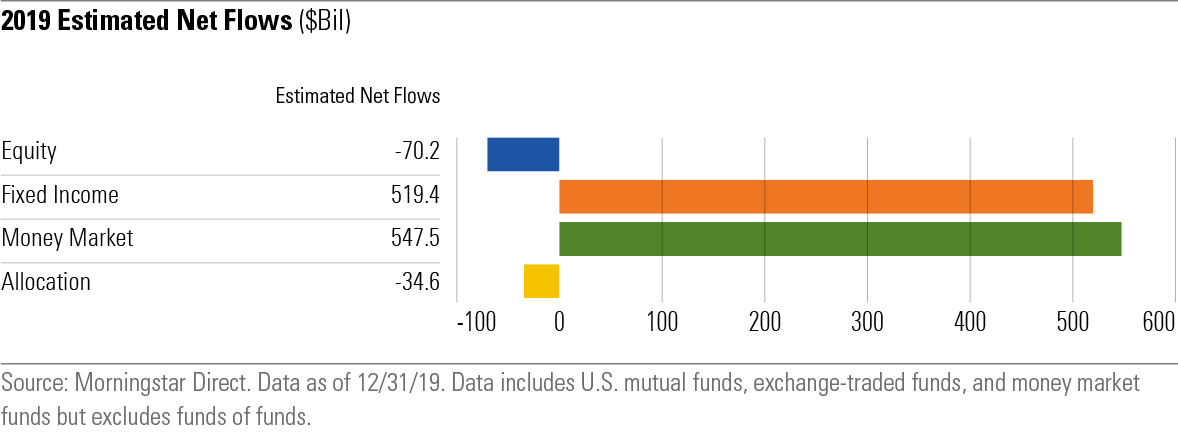
However, Morningstar’s data on estimated net flows suggests that instead of just letting their winners ride, investors have taken active steps to rebalance their portfolios. In 2019, we estimate that investors pulled about $70.2 billion from equity-focused funds, plus an additional $34.6 billion from allocation funds. This helped offset the effects of market appreciation, which would have ratcheted up equity exposure as a percentage of assets. At the same time, they poured an additional $519.4 billion into fixed-income funds and $547.5 billion into money market funds. This kept the industry’s aggregate asset mix roughly in line with where it was at the end of 2018.
Investors haven’t always demonstrated this level of rebalancing discipline. From 1995 through 1999, the market was routinely racking up double-digit gains, with the S&P 500 gaining 26.3% per year, on average, between 1995 and 1999. By the end of 1999, equities rose to make up about 57.4% of industrywide assets. When the tech bubble collapsed in 2000, stocks continued suffering for three consecutive years. Even though equity funds actually continued to see net inflows during this market malaise, they weren’t large enough to offset the effects of market depreciation. As a result, the aggregate equity allocation dropped to 39.9% by the end of 2002. Investors therefore missed out on some gains when the market subsequently bounced back.
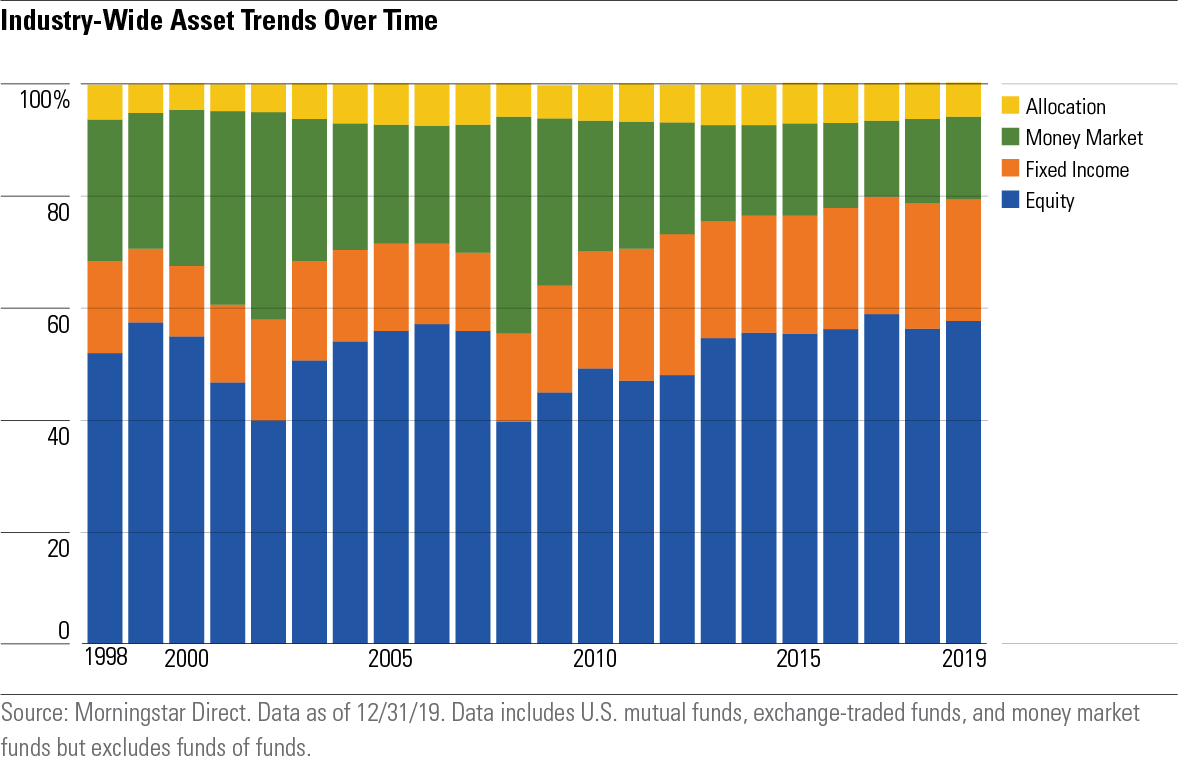
The years around the global financial crisis tell a similar story. After the market dropped 38.4% in 2008, overall equity allocations declined to 39.6%. Investors were actually net sellers of equity funds that year (with estimated equity outflows of $15.6 billion). Equities gradually increased as a percentage of assets as the market recovered, but didn’t reach pre-crisis levels until 2017.
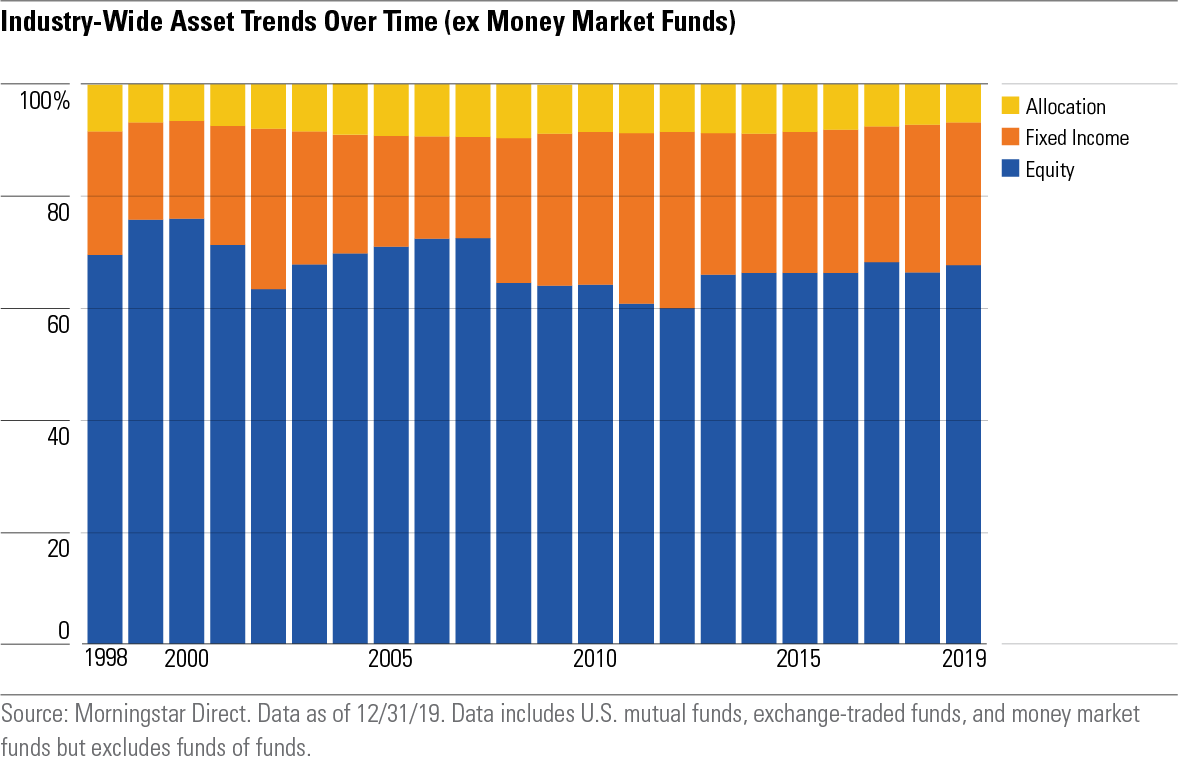
Money market funds might cloud the picture a bit because of their ownership patterns. Individual investors (or financial advisors and institutions investing on their behalf) account for most assets invested in mutual funds and ETFs. Money market funds, on the other hand, are also used by corporate buyers to invest short-term assets on their balance sheets.
These assets can fluctuate for reasons that are unrelated to mutual fund and ETF asset flows, so we ran a second set of numbers excluding money market funds. Overall, the asset trends showed a similar pattern. Total equity exposure increased slightly during 2019, but still finished the year at less than 68% of the total, while fixed-income and allocation funds made up the remaining 32%. That’s also not too far off from the total dollar value of equity and fixed-income securities outstanding in the United States.
The overall picture is reassuring, but some individuals likely have portfolio allocations that are too aggressive. The market’s recent downturn has been a painful litmus test for risk tolerance, and even investors who had carefully planned out a reasonable asset mix were probably shaken by the sharp drop in equity values at the end of February.
That said, if you were comfortable with your asset mix before the market correction and have enough patience to hold tight in rocky periods, shorter-term market conditions shouldn’t lead to major changes in your target asset allocation. If anything, it makes sense to keep an eye on your portfolio’s asset mix to make sure your equity allocation doesn’t get too far away from target levels if the market continues declining. We typically recommend rebalancing your portfolio at least once a year or if an individual asset class drifts more than 5% above or below your target level. That’s tough to do amid a steady drumbeat of dire economic news and uncertainty about the extent of the human and economic toll from COVID-19, but it’s better to stick with your plan than try to time the market bottom.
The portfolio changes that investors made to reduce their equity allocations during 2019 provide some reassurance that fund investors have learned the lessons of rebalancing. Based on previous market corrections, shareholders haven’t been quite as ready to add to their stock positions after a market decline. Those with the fortitude to do that, though, will likely reap benefits over the long term.
/cloudfront-us-east-1.images.arcpublishing.com/morningstar/6ZMXY4RCRNEADPDWYQVTTWALWM.jpg)
/cloudfront-us-east-1.images.arcpublishing.com/morningstar/URSWZ2VN4JCXXALUUYEFYMOBIE.png)
/cloudfront-us-east-1.images.arcpublishing.com/morningstar/CGEMAKSOGVCKBCSH32YM7X5FWI.png)
:quality(80)/s3.amazonaws.com/arc-authors/morningstar/360a595b-3706-41f3-862d-b9d4d069160e.jpg)