
A New Lens for Measuring Global Diversification
You might be better-diversified than you think.
/s3.amazonaws.com/arc-authors/morningstar/a90ba90e-1da2-48a4-98bf-a476620dbff0.jpg)
A version of this article previously appeared in the August 2019 issue of Morningstar ETFInvestor. Download a copy here.
Diversification is the only free lunch in investing. Spreading bets across securities, sectors, and geographies is an efficient way to reduce risk. But traditional means of measuring these dimensions of diversification have limitations.
Take Amazon.com AMZN for example. The online retail giant belongs to the Internet and direct marketing retail subindustry within the consumer discretionary sector in the Global Industry Classification System. But in the second quarter of 2019, nearly 12% of its sales and just over half its operating income came from Amazon Web Services, its cloud computing offering. And though the company is domiciled and listed in the United States, 28% of its second-quarter 2019 sales came from its international division. Clearly, Amazon is more than a U.S. consumer discretionary firm.
As global markets have evolved, the tools that investors use to understand them have, too. In this article, I'll take a closer look at one enhancement to this tool kit: Morningstar's Revenue Exposure by Region data.
Revenue Exposure by Region Borders have become more porous and companies' economic footprints more global. Categorizing firms based on their domicile or where their stock is listed often gives little insight into the factors that matter most to their fundamentals. Morningstar's Revenue Exposure by Region data provides a fuller picture of where firms are doing business.
This data is sourced directly from public companies' filings. Most provide some level of detail in their regular reporting to investors on where their sales and profits are coming from and where their assets are located. However, reporting conventions are inconsistent across companies. For example, Apple AAPL reports revenues across five separate geographies (Americas, Europe, Greater China, Japan, Rest of Asia Pacific), while Samsung Electronics SSNLF provides no geographic breakdown of its consolidated sales in its filings. To address these discrepancies, we have developed a framework for attributing company revenue to individual countries and then assigning them to a standard list of Morningstar-defined regions. This facilitates comparisons across companies and allows us to roll the data up at the portfolio level to better understand the geographic origins of the combined sales of stocks within a fund.
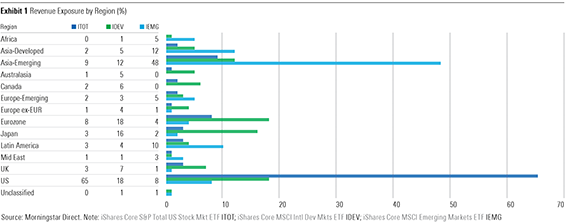
Putting It to Use Looking at exchange-traded funds underpinned by broad-based market-cap-weighted indexes through this lens yields interesting results, as Exhibit 1 shows. The data speak to the global footprint of the companies that make up these funds' portfolios. In the case of iShares Core S&P Total U.S. Stock Market ETF ITOT, just more than a third of this U.S.-stock portfolio's revenue comes from outside the U.S. Just shy of 40% of the combined sales of companies included in iShares Core MSCI Emerging Markets ETF IEMG is made in developed markets.
Drilling down further from broad-based cap-weighted ETFs, new patterns emerge. Splitting U.S., developed ex U.S., and emerging markets based on market cap shows that regional revenue exposures shift along the market-cap ladder. In both the U.S. and developed ex U.S. markets, small-cap stocks sell more in their home markets than their large-cap counterparts, as shown in Exhibit 2. Much of this difference can be explained by differences in sector composition. Also, smaller companies might not yet need to focus as much on foreign markets to fuel their growth.
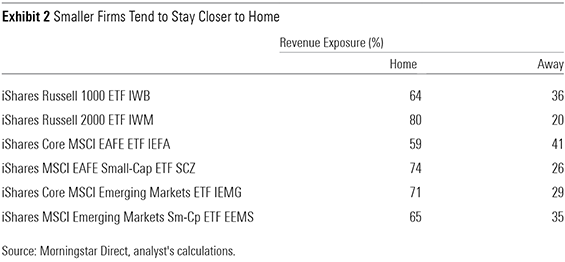
The relationship is reversed in the case of emerging markets. Differences in sector exposure between IEMG and its small-cap carve-out iShares MSCI Emerging Markets Small-Cap ETF EEMS explain this. IEMG has far greater exposure to financials than EEMS (23% versus 10%). These stocks derive most of their revenue in their local markets. EEMS also has greater exposure to export-oriented sectors like industrials (14% versus 6%) and materials (12% versus 8%).
Looking at the data through the lens of sectors provides more insight into these differences in fundamental geographic diversification. Exhibit 3 shows the breakdown between "Home" (the U.S. in this case) and "Away" (ex U.S.) revenue for the Select Sector SPDR ETFs. It should come as little surprise that the utilities, real estate, and financials sectors generate most of their sales in their home markets. These companies' assets and customers are typically landlocked. It's worth noting that these sectors also tend to be those most sensitive to fluctuations in local interest rates.
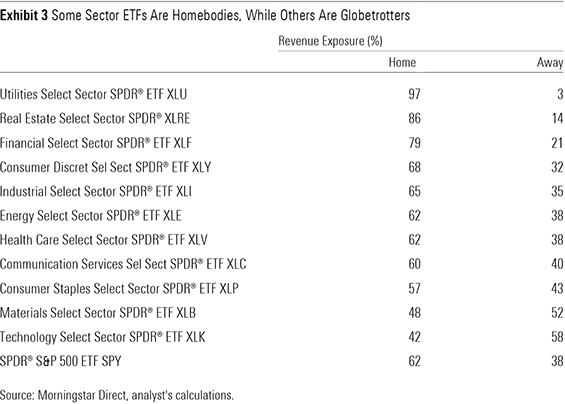
On the flip side, technology and materials firms sell more outside the U.S. Tech firms like Microsoft MSFT and Apple have products without borders and global networks. Materials companies like Linde PLC LIN and DuPont de Nemours DD have global asset bases, needed to serve a global clientele.
Exhibit 4 includes noteworthy edge cases, those U.S.-stock ETFs with the greatest foreign revenue exposure and the foreign-stock ETFs with the most U.S. revenue exposure. On this measure, Pacer U.S. Export Leaders ETF PEXL is delivering as advertised. The fund's benchmark screens the S&P 900 Index for the 200 companies with the greatest percentage of foreign sales before winnowing those 200 down to the 100 with the greatest five-year free cash flow growth. Consistent with the sector-level data in Exhibit 3, PEXL's portfolio is characterized by large allocations to technology (43%) and industrials (14%) stocks, which draw a greater portion of their revenue overseas.
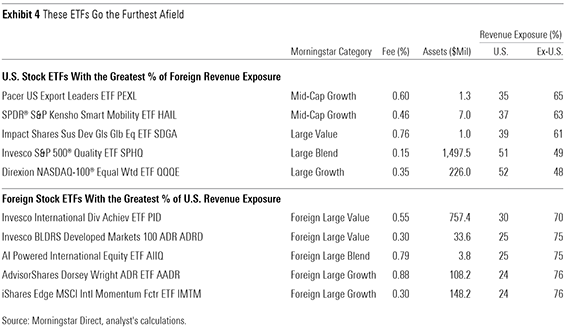
The outliers among the list of foreign-stock ETFs with the greatest U.S. revenue exposure are less extreme. The stocks in Invesco International Dividend Achievers ETF's PID portfolio make just 30% of their sales in the U.S. This is a relatively slight tilt toward the U.S. compared with iShares Core MSCI International Developed Markets ETF IDEV. The difference can be largely attributed to the fact that 44% of PID's portfolio is allocated to Canadian stocks, which have on average relatively greater U.S. revenue exposure.
You Might Be Better-Diversified Than You Think Even if you have 100% of your equity portfolio invested in U.S. stocks, you're more diversified than traditional measures might lead you to believe. The companies you invest in are effectively diversifying on your behalf as they sell their wares in foreign markets and invest to expand further afield.
That said, the case for owning foreign stocks remains strong. U.S. and foreign stocks have not and will not ever move in perfect unison. Pairing assets that zig and zag at different times in response to different fundamental drivers is a good way to reduce portfolio risk, making it easier to stick to your plan. There will be times when valuations across global markets are out of sync. It is at these moments when taking from your leaders to add to your laggards might not only reduce portfolio risk but also improve long-term returns.
Key Takeaways
- As companies continue to expand their global footprints, traditional means of measuring geographic diversification are increasingly insufficient. Measuring global diversification along dimensions of fundamental exposures--such as revenue--can paint a more-complete picture of funds' degree of diversification.
- Small-cap stocks tend to sell more in their home markets, while large caps make more sales away from home. Favoring small caps may provide more direct exposure to local market fundamentals.
- Some sectors are globetrotters, while others are homebodies. Financials, utilities, and real estate stocks typically have local asset bases and clientele and will tend to be most sensitive to fluctuations in local interest rates. Technology and materials stocks have a more global reach.
- While looking at your portfolio through the lens of regional revenue exposure might show that even the most home-biased portfolios are better diversified than they first appear, the case for owning foreign stocks remains compelling.
Disclosure: Morningstar, Inc. licenses indexes to financial institutions as the tracking indexes for investable products, such as exchange-traded funds, sponsored by the financial institution. The license fee for such use is paid by the sponsoring financial institution based mainly on the total assets of the investable product. Please click here for a list of investable products that track or have tracked a Morningstar index. Neither Morningstar, Inc. nor its investment management division markets, sells, or makes any representations regarding the advisability of investing in any investable product that tracks a Morningstar index.
/d10o6nnig0wrdw.cloudfront.net/04-25-2024/t_29c382728cbc4bf2aaef646d1589a188_name_file_960x540_1600_v4_.jpg)
/cloudfront-us-east-1.images.arcpublishing.com/morningstar/24UPFK5OBNANLM2B55TIWIK2S4.png)
/cloudfront-us-east-1.images.arcpublishing.com/morningstar/T2LGZCEHBZBJJPPKHO7Y4EEKSM.png)
:quality(80)/s3.amazonaws.com/arc-authors/morningstar/a90ba90e-1da2-48a4-98bf-a476620dbff0.jpg)