
Playing Favorites With Multifactor ETFs
Playing favorites here is difficult given that each of these strategies is designed to deliver somewhat different outcomes.
/s3.amazonaws.com/arc-authors/morningstar/a90ba90e-1da2-48a4-98bf-a476620dbff0.jpg)
The article was published in the August 2016 issue of Morningstar ETFInvestor. Download a complimentary copy of ETFInvestor by visiting the website.
In last month's issue, I outlined the case for multifactor exchange-traded funds. This month, I'm naming names: I will take a look at a select group of true-blue multifactor ETFs that invest in large-cap U.S. stocks. I will call out some nuanced but crucial differences in how their underlying indexes are built and what they imply for these funds' risk/return profiles. Finally, I'll name my favorites from this list.
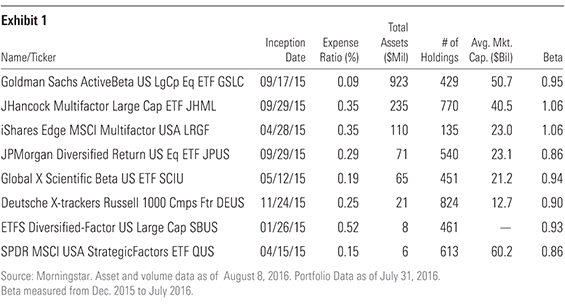
New Kids on the Block By my count, there are currently eight dyed-in-the-wool multifactor ETFs in the U.S. large-cap space. These funds are all very new. The elder statesman of the bunch, ETFS Diversified-Factor U.S. Large Cap SBUS, was launched in January 2015. These eight funds had collective assets under management of $1.4 billion as of the end of July, and just three of them held more than $100 million of investors' capital. Thus, all of the standard disclaimers about new and untested (though in this case thoroughly back-tested) strategies apply here.
What's in the Mix? Each of these funds is similar in that their underlying indexes look to exploit some combination of at least three of the six time-tested factors I listed in "The Case for Multifactor ETFs": value, momentum, size, quality, low volatility, and dividends. But from there, the fund's benchmarks differ along a number of dimensions, namely: 1) the factors they seek to combine; 2) how they define those factors; 3) how they weight their constituent stocks; and 4) how the factors are integrated (or not). Seemingly small variances among these funds' indexes across these four dimensions yield meaningfully different risk/return characteristics--which is evident even in the limited amount of live performance data we have to analyze.
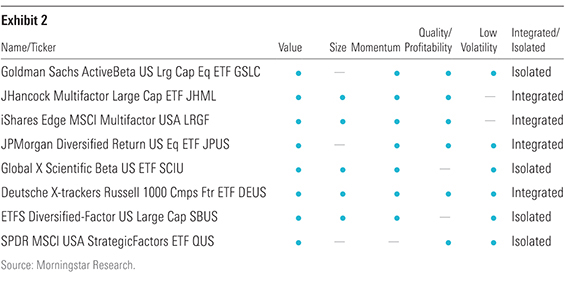
As you can see in Exhibit 2, there are six different combinations of factors across these eight funds. The only common factor among them is value, the granddaddy of them all. Seven of the eight funds look to combine both value and momentum. Just four of the eight take size into account. Also of note is the fact that six of these funds track indexes with a low-volatility component. Each of those six funds had a beta of less than 1 (see Exhibit 1) during the period from December 2015 to July-end 2016. This indicates to me that 1) the low-volatility element is working (it's been put to the test a few times in that span) and 2) it has the potential to dominate the other factors.
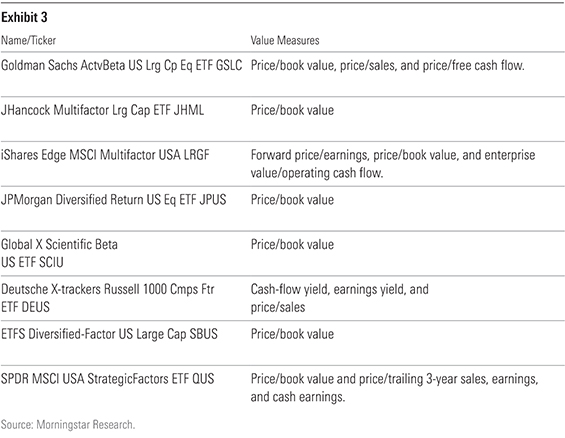
It's also important to understand how each fund's index defines the factors it is after. In Exhibit 3, I've included the metrics that each fund's benchmark uses to define value. As you can see, there are five different definitions of value among these eight funds. Four of the eight defer to the classic definition, which relies solely on stocks' price/book value multiple to identify relatively cheap ones. While price/book has been enshrined by academics and practitioners, using it in isolation to home in on value stocks is--in my opinion--less than optimal, in large part because it is so widely used as to run the risk of being diluted. My preference is for a more-comprehensive set of measures to define value, but not so broad as to tip into data-mining territory. Three should suffice.
The manner in which stocks are weighted differs materially across each of these eight funds. Generally speaking, each index looks to weight stocks on the basis of the strength of their factor-specific characteristics, but each does so in a different manner. For example, JPMorgan Diversified Return U.S. Equity ETF JPUS tracks the Russell 1000 Diversified Factor Index. The index sets its sector weightings on the basis of the inverse of each sector's historical volatility. This effectively spreads sector-specific risk more evenly. The index then populates each sector with those stocks that earn the highest composite scores based on measures of value, momentum, size, and low volatility. Stocks that score poorly on these measures are tossed out. Still following? The devil is in the details here, and the details are often tough to parse.
The final dimension along which these funds' benchmarks will differ is their approach to combining factors. Generally speaking, there are two paths they will take. One involves integrating them in a manner similar to the process JPUS follows as described above. The second, which I'll refer to as the "isolated" approach, involves building individual factor-specific portfolios and combining them into one index. For example, SPDR MSCI USA StrategicFactors ETF QUS tracks the MSCI USA Factor Mix A-Series Index. This index is in effect an equal-weighted portfolio of three distinct factor indexes: MSCI USA Value Weighted Index, MSCI USA Quality Index, and MSCI USA Minimum Volatility Index. Both approaches have merit. The integrated approach selects stocks that earn high marks on a number of fronts and could potentially limit turnover. The isolated approach is far more transparent and less likely to be the product of extensive back-testing.
What's the Result?
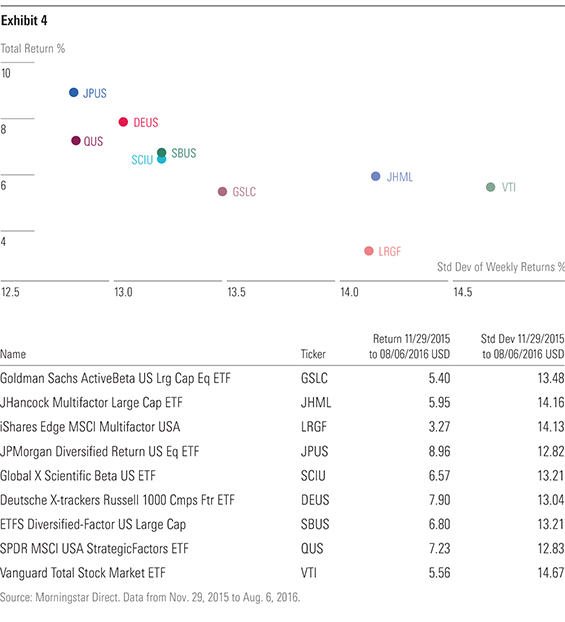
At first blush, the differences between these funds' benchmarks are seemingly minor. Upon closer inspection, variations among them along the four dimensions covered above yield meaningfully different results. Exhibit 4 plots the total returns and the standard deviation of weekly returns for each of these eight funds from Nov. 29, 2015, to Aug. 6, 2016 (I've also included
What's notable in these figures is the degree of dispersion among the best- (JPUS) and worst-performing (iShares MSCI Multifactor USA LRGF) funds, which amounted to 5.7 percentage points. These two funds also happened to have the lowest (JPUS) and highest (LRGF) beta (a measure of each portfolio's sensitivity to movements in the broader market) relative to the S&P 500 during this span. Thus, the relative outperformance of the lower-beta funds on the list is reflective of 1) the fact that low-beta stocks outperformed both the market at large and their high-beta counterparts during the period in question and 2) the potential for the low-volatility component of these funds' factor lineups to dominate the other factors.
Which Are My Favorites? Playing favorites here is difficult given that each of these strategies is designed to deliver somewhat different outcomes. Thus, I've selected three from the eight, each representing a distinct profile as measured by the magnitude of their factor bets and their expected risk characteristics. For each of the three, I've identified their potential role in a diversified portfolio and listed some pros and cons.
Goldman Sachs ActiveBeta U.S. Large Cap Equity ETF GSLC
- Role in portfolio: Core building block
Pros:
- A very sensible and transparent index methodology.
- Modest factor bets that will result in relatively low tracking error relative to a cap-weighted index of large-cap stocks.
Cons:
- Modest factor bets will yield modest outperformance, at best, relative to a fund tracking a cap-weighted index of large-cap stocks.
iShares Edge MSCI Multifactor USA LRGF
- Role in Portfolio: Core building block
Pros:
- Makes relatively bigger factor bets versus its peers.
- Does so while attempting to maintain a risk profile in line with its parent index, the MSCI USA Index.
Cons:
- A fairly opaque and complex index methodology.
- Will likely be more volatile versus its peers given its more-concentrated portfolio and the absence of a low-volatility component.
JPMorgan Diversified Return U.S. Equity ETF JPUS
- Role in Portfolio: Core building block
Pros:
- A very risk-conscious methodology will likely yield more-muted drawdowns relative to peers tracking cap-weighted indexes, as well as other multifactor ETFs.
- Index methodology was derived from JPMorgan's pre-existing equity strategies.
Cons:
- Volatility weighting and the low-volatility component will likely dominate other factor bets.
- Its sector volatility weighting approach could result in capacity constraints for this strategy.

Disclosure: Morningstar, Inc. licenses indexes to financial institutions as the tracking indexes for investable products, such as exchange-traded funds, sponsored by the financial institution. The license fee for such use is paid by the sponsoring financial institution based mainly on the total assets of the investable product. Please click here for a list of investable products that track or have tracked a Morningstar index. Neither Morningstar, Inc. nor its investment management division markets, sells, or makes any representations regarding the advisability of investing in any investable product that tracks a Morningstar index.
/cloudfront-us-east-1.images.arcpublishing.com/morningstar/24UPFK5OBNANLM2B55TIWIK2S4.png)
/cloudfront-us-east-1.images.arcpublishing.com/morningstar/T2LGZCEHBZBJJPPKHO7Y4EEKSM.png)
/d10o6nnig0wrdw.cloudfront.net/04-18-2024/t_34ccafe52c7c46979f1073e515ef92d4_name_file_960x540_1600_v4_.jpg)
:quality(80)/s3.amazonaws.com/arc-authors/morningstar/a90ba90e-1da2-48a4-98bf-a476620dbff0.jpg)