
Come for the Value, Stay for the Moat
Western Union's moat is wider than it appears.
/s3.amazonaws.com/arc-authors/morningstar/da2d065f-39a9-49e3-8551-1d3832fc658a.jpg)
In our view,
Investors generally rely on World Bank's global remittance data to estimate the size of the money transfer industry. In 2014, the World Bank estimated that global remittances totaled $583 billion; on that basis, Western Union would have only 13% market share. However, the World Bank data includes high-dollar amount transfers that are not served by money transfer operators like Western Union. While the World Bank does not provide a breakout of these different areas of the market, U.S. banks do disclose international remittance volume in their call reports. Using the top 10 U.S. banks by deposits, we estimate that U.S. banks account for a little over 60% of remittance dollar volume coming from the United States. Western Union also estimates that banks handle about 60% of global remittances. As a result, we believe 60% is a reasonable estimate of the portion of global remittances handled by banks.
Looking at the bank data also clearly shows that the banks and money transfer operators, while both handling remittances, handle very different types of transactions. The average send amount for the U.S. banks is almost $14,000, a little over 40 times higher than Western Union's average send amount of $323 in 2014. Further, Western Union notes that it handles very few transactions over $2,000, due to the practical issues involved in carrying large amounts of cash to and from agent locations and compliance requirements on large dollar sends. In our view, these figures show that banks and money transfer operators serve different customer bases and don't really compete directly with each other. As such, we think the most appropriate measure of Western Union's market share would be its share of the volume handled by money transfer operators.
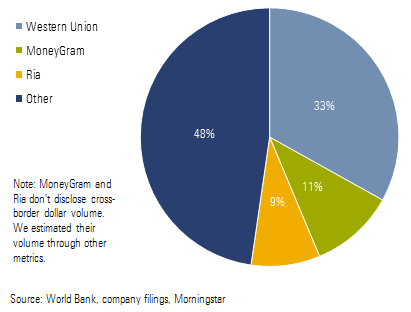
Looking through this lens, we see that the money transfer industry is much more concentrated than it appears at first glance, with Western Union controlling about one third of the market and the three leading players accounting for a little more than half of the market. Western Union and MoneyGram MGI are the only players with truly global networks, and Western Union is the only player that is truly global in terms of geographic mix. MoneyGram leans heavily on remittances originating in the U.S., which account for almost 60% of its volume, and we believe Ria (the money transfer arm of Euronet Worldwide) derives the majority of its revenue through U.S.-originated transfers as well. Western Union derives only 27% of its revenue from U.S.-originated transactions (for comparison, almost 20% of all global immigrants reside in the U.S.). The rest of the smaller players in the industry typically focus on select corridors or regions.
We think Western Union's market position is much more entrenched than many investors realize, and the importance of this will become more clear as we investigate the source of competitive advantage in the industry.
Western Union's Brand Not Nearly as Important as It Appears Western Union's operating margins are dramatically higher than its competitors, and this spread, along with the company's strong returns on invested capital, is the primary quantitative support for our wide moat rating. Given that these companies provide the same service, and the service is somewhat commoditylike in nature, the large difference in margins is surprising, but demonstrates that the playing field is not at all level. If we assume that other competitors have operating margins comparable to MoneyGram and Ria, Western Union generates almost two thirds of the industry's profits, an indication of the wide moat around its business. However, we think many investors are confused as to the source of its advantage.
The company often says it believes its pricing is at a 15%-20% premium relative to its competitors. We think some investors take this metric at face value and believe that the spread in profitability is driven by a brand advantage. While we don't mean to suggest this statement is false, we think the effective spread is much less impressive when we look at the details and somewhat misleading as to the source of the company's advantage. In our view, Western Union's advantage is driven by scale, and looking deeper helps explain why premium pricing and the company's brand are not the main source of its moat.
Western Union has thousands of different price points, as pricing differs by corridor, amount sent, and method. Even within countries, pricing can differ substantially based on the area from which it is sent. For instance, Western Union's fee for sending $350 on a cash-to-cash basis from Chicago to Poland is $10, while the fee for sending the same amount from Milwaukee to Poland is $34.
Given the huge number of price points and the fact that money transfer operators also generate revenue through exchange rate spreads, it is impossible to precisely ascertain the overall spread in pricing, but we can form an estimate by looking at key corridors. We used the World Bank's site on remittance prices to compile fees in the 20 largest remittance corridors for which the site had pricing information. We only used pricing for cash-to-cash methods with immediate or same-day availability to make the pricing as comparable as possible. We came up with an average fee spread relative to all competitors of 12%, which is a little below but close to the 15%-20% figure Western Union quotes.
We think a deeper look helps explain why this overall figure is actually misleading. First, Western Union's pricing is only marginally higher than that of its largest competitor, MoneyGram, and MoneyGram's margins are much lower than Western Union's. In our view, this confirms that the large spread in margins is driven by the difference in scale, as opposed to a pricing advantage.
The overall spread against all competitors does appear substantial at first glance, but we think the comparison with MoneyGram is more representative of the true spread of pricing. First, MoneyGram is the only other competitor with a truly global presence, present in all of the corridors. In many cases, where there is a significant spread over other competitors it is because one competitor is particularly low, which may distort the average as the competitor might have a very limited agent network and account for a small fraction of volume.
Further, the 12% spread against all competitors is concentrated in only a few corridors, specifically remittances originated in Saudi Arabia. If we excluded Saudi Arabia, most of the spread would disappear. Given that remittances from Saudi Arabia account for only 8% of all global remittances, we think the spread in the pricing on remittances from this country doesn't constitute a material advantage for Western Union. In addition, if the pricing differential were based on a brand advantage, we would expect to see a much more consistent spread in pricing across corridors. Given that the spread is driven by only a handful of corridors, we think the more appropriate conclusion is that any difference is driven by stronger agent networks in certain areas, which is more a function of Western Union's size and scale.
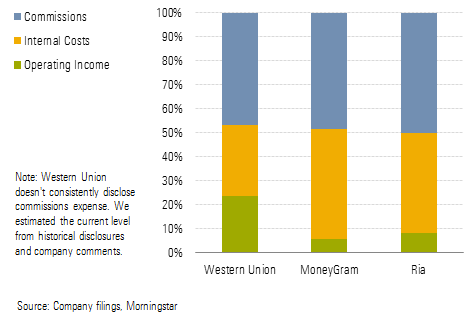
Scale More Important Than It Appears; Price Reductions Less So Western Union's largest expense is agent commissions, which account for a little less than 50% of revenue and are perfectly linear, as agent contracts tie the commission to a set percentage of the fee level. However, outside of commissions, almost all costs are fixed. Agent commission rates are largely standardized across the industry, so it is difficult for any competitor to meaningfully reduce commissions as a percentage of revenue, and scaling fixed internal costs is the only basis on which competitors can successfully distinguish themselves, in our view. The difference in internal costs as a percentage of revenue is the dominant driver of the difference in operating margins between Western Union and its peers.
Historically, Western Union has typically lowered pricing, in aggregate, 1%-3% per year. We think investors with the mistaken impression that the company's edge is primarily based on premium pricing then interpret the pricing reductions as a sign that its competitive advantage is eroding. Regardless, many investors question whether any company that continually lowers pricing is worthy of a wide moat rating. Understanding that Western Union's advantage is based on scale helps explain why these pricing reductions are not evidence against a wide moat rating, but a sign that scale is the critical factor in determining competitive position, validating the idea that Western Union has a wide moat rating based on sizable scale lead. Given that incremental transactions carry effectively no costs outside commissions, an aggressive pricing policy makes sense, in our view. Management has noted that its goal is to set pricing at a level that maximizes total revenue, not revenue per transaction, a strategy that is perfectly appropriate in a highly scalable industry. In our view, the company's primary strategic objective should be to maintain or improve market share and thereby support its scale advantage.
We would see pricing reductions as evidence of deterioration in Western Union's moat only if the company experienced ongoing margin declines. Western Union did experience a large drop in margins from 2011 to 2013, but this was due to the temporary factors discussed below; the underlying facts support the idea that Western Union should be aggressive in pricing reductions when possible. Outside 2011-13, Western Union has actually been able to generate modest margin improvement over time, suggesting scale benefits have more than offset pricing reductions.
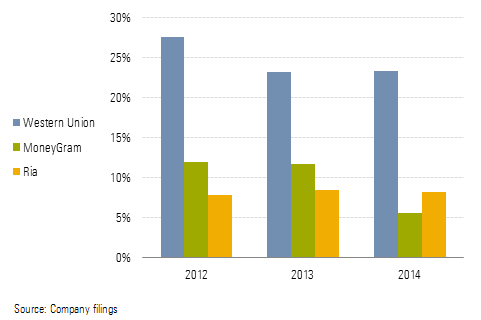
- The U.S.-to-Mexico corridor is Western Union's largest, and its position was weakened as the company had to drop about 7,000 Mexican agents in 2012 because of compliance issues. As a result of the impairment to its network, Western Union lost volume and also had to lower pricing to regain share.
- Western Union implemented overall price reductions of 6%-7% in 2013 to recover share in other key corridors, as a few years of minimal price increases resulted in weak volume and loss of share. In our view, this event supports the idea that the company needs to keep pace with industry pricing to maintain its moat. In our view, if Western Union had remained aggressive in the years before 2013, it would not have suffered the share losses and margin impact that it did.
- The industry has seen a significant uptick in compliance costs, and the company has noted that this phenomenon has not been restricted to the U.S. As a result, compliance costs have increased from 1% of revenue to about 3.5% over the past few years. While this has lowered profitability in the near term, the trend could strengthen Western Union's relative advantage in the long run, as these new costs create an additional layer of fixed costs that smaller players will find it more difficult to absorb.
We believe the company can improve margins slightly. By our estimate, Western Union only needs to achieve transaction growth 2 percentage points higher than pricing reductions to maintain operating margins. Given the pressure MoneyGram is facing following the loss of Wal-Mart as an agent for many domestic transfers, and the impact of increasing compliance costs on the rest of the industry, we would be surprised to see significant pricing reductions from competitors over the next few years, which should allow Western Union to avoid any major pricing actions.
Our view on Western Union's moat is consistent with our moat ratings in other scalable industries that are able to offset pricing reductions with scale benefits. For instance, the asset management industry has seen declines in fees, but we still rate the largest, most diversified companies as wide moat.
Western Union's Long-Term Growth Prospects Better Than They Appear The primary driver of the money transfer industry is the ongoing growth in the global immigrant population. While immigration can be motivated by a number of factors, we think there are three primary drivers: employment markets in the U.S. and Europe and, to a lesser extent, the price of oil. The majority of the world's immigrant population resides in the U.S., Europe, or oil-producing Middle East countries.
We think employment markets in these developed countries are a key driver of immigrant population growth, as a stronger employment market creates more opportunities for immigrants. A secondary factor is the price of oil; while production is the key driver for direct oil industry employment, low oil prices damp demand for other jobs in oil-producing countries, which tend to employ a disproportionate number of immigrants. While employment conditions in the U.S. are improving, Europe collectively is just as important; conditions there are less favorable, and the decline in oil prices is an additional headwind. This helps to explain why remittance growth slowed sharply in the aftermath of the financial crisis and has remained somewhat muted.
Growth in the post-crisis era has been significantly lower than it was in the pre-crisis period. These periods represent reasonable worst- and best-case scenarios and constitute a reasonable range of future industry growth rates, in our opinion, although the near term will likely remain at the bottom of this range.
Still we see room for long-term industry growth to pick up, and we think investors might fail to appreciate the length of the secular growth runway that the industry will enjoy. In our view, the industry could reasonably see mid-single-digit transaction growth for a very long time.
The incentives for immigrants to move to wealthier countries are fairly obvious. The disparity in GDP per capita between the top 10 immigration countries and the top 10 emigration countries is about 9 times. Even if the disparity in income between developed and developing economies compresses in coming years, it will stay wide enough to spur immigration for a very long time to come, in our opinion.
The reason developed countries are willing to accept immigrants is less obvious. In our opinion, as result of negligible native population growth, developed countries face a choice between meager economic growth and accepting immigration. While some countries are willing to close their borders and accept a stagnant economy, we believe most developed countries see accepting immigration as the more attractive option, even though it can be a hot-button political topic. Essentially all of the world's population growth is expected to come from developing countries in the coming decades, keeping this dynamic firmly in place for a very long time.
As a result of these factors, while we believe Western Union's dominant market position will make it difficult for the company to meaningfully outpace industry growth, we think there is an essentially permanent secular growth catalyst for the global immigrant population and therefore for money transfer volume. We would expect these historical drivers to reassert themselves eventually as macroeconomic headwinds eventually fade. We believe the industry can return to mid-single-digit growth over time, allowing for a modest but very long growth runway for Western Union.
/cloudfront-us-east-1.images.arcpublishing.com/morningstar/PVJSLSCNFRF7DGSEJSCWXZHDFQ.jpg)
/cloudfront-us-east-1.images.arcpublishing.com/morningstar/F5UMFVVKMVFRPGGUY4LONIK6OY.jpg)
/d10o6nnig0wrdw.cloudfront.net/05-03-2024/t_8ba91080cb4d43acae9d9119875abede_name_file_960x540_1600_v4_.jpg)
:quality(80)/s3.amazonaws.com/arc-authors/morningstar/da2d065f-39a9-49e3-8551-1d3832fc658a.jpg)