
U.S. Economy Bouncing Back, Slowly
While Friday's headlines out of China were bad news for market performance and speculators, it's not an economic or financial system train wreck.

Net world equity markets were basically unchanged for the entire week. Markets did very well through Thursday. Then stocks were routed on Friday on new fears about Greece's debt repayment combined with new provisions that will make it easier for investors to short Chinese stocks.
Chinese stocks have gone crazy over the past six months with the Chinese government acting as head cheerleader, despite softening economic fundamentals. With few alternatives for Chinese investor cash, a little government encouragement, and regulatory impediments to some shorting, the Shanghai stock exchange has almost doubled in just the past six months. Then on Friday, after the Chinese market close, the Chinese regulators announced that they will make it easier to short stocks, popping a major bubble that many readers have been pointing out for weeks.
While not great news for market performance and speculators, this is not an economic or financial system train wreck. It does highlight speculators' involvement in markets and that there are some cross-linkages that are somewhat surprising. However, the economic data this week was generally better in the United States and Europe and slightly worse in China. U.S. retail sales popped back in March, the manufacturing part of industrial production stopped going down, and housing data was improved, but not by as much as hoped.
It's too early to make broad statements on corporate earnings with just 11% of all S&P companies reporting, but earnings surprises are tending on the upside. The financials group, one of the early reporting sectors, is doing particularly well. Still, earnings overall are expected to be down year over year in the first and second quarter (with energy and basic materials driving most of the decline).
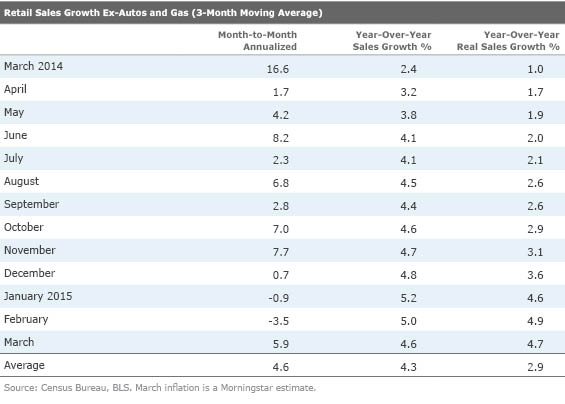
Retail Sales Growth Improved and Finally Making Some Sense In last week's column, we argued that the retail sales report would be the most important of the week, and expectations for March were quite high. Luckily, March retail sales data, released this week, looked very positive whether examined on a year-over-year basis (up 4.7%) or month-to-month (up 0.5% or 6% on an annualized basis), both excluding autos and gasoline.
I have to be honest: For the past three months, one could have interpreted the retail sales data as highly positive or brutally negative, depending on whether one used month-to-month or year-over-year, three-month averaged data. Whether one chose to use nominal or inflation-adjusted data made the debate even more confusing. However, the March data finally brought the various ways of looking at retail sales into closer alignment, indicating the consumer is doing just fine. That said, the year-over-year growth rates are still perhaps a bit inflated by the horrendous January weather that depressed sales a year ago.
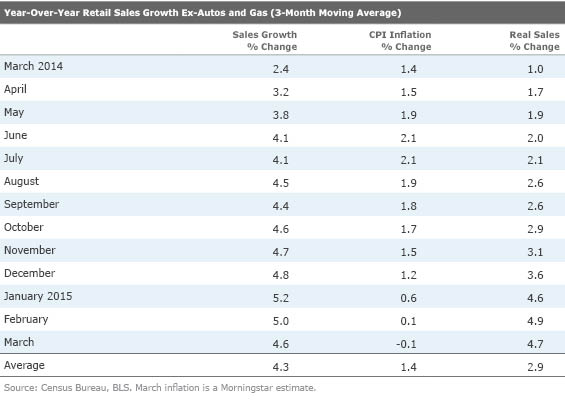
When January 2014 drops out of the mix and the strong rebound months of 2014 come into play, we suspect the year-over-year average will drop back into the 3.5%-4.0% range on an inflation-adjusted basis. The inflation-adjusted data will look better than the 12-month average while the non-inflation-adjusted data will look worse than the averages. These numbers would be consistent with 2.25%-2.75% GDP growth, slightly higher than my current estimate.
I will admit that recent month-to-month retail sales trends have been perplexing. The retail sales numbers were down or soft in December, January, and February. One might have expected some huge acceleration, based on falling gasoline prices. Incomes and wages looked incredibly strong during this period, too, and the savings rate soared. Has the consumer repented and permanently lowered spending levels and raised savings?
Our short answer is no. I think several factors caused the month-to-month slump, including the pattern of the winter weather, adverse effects in oil-producing states, low housing activity (which drives a lot of retail activity), and high utility bills. Not to mention that consumers went on a huge spending spree in October and November when annualized growth in retail sales was over 7%. U.S. consumers might have spent their gasoline savings sooner than later. Everyone remembers the short but temporary fall below $2 in December and January, but prices started moving down way back in August and were down over $0.50 by October. Or maybe the sudden positive shift in the job market fired up the consumer in the late fall months. However, maybe I should just stop looking at the month-to-month data altogether and concentrate on the year-over-year statistics.
Category Data Highlights Weather Issues
I will also say that the month-to-month category data had weather issues stamped all over them. Grocery sales, which did better as people stocked up for storms, collapsed in March, falling an unusually high 0.6% (though as noted later, lower prices also explain some of the decline in retail grocery sales). Meanwhile, restaurant sales bounced sharply, increasing 0.7%. Those sales tend to do better in good weather. And in a true show of weather-related impacts, non-store retailers (mainly
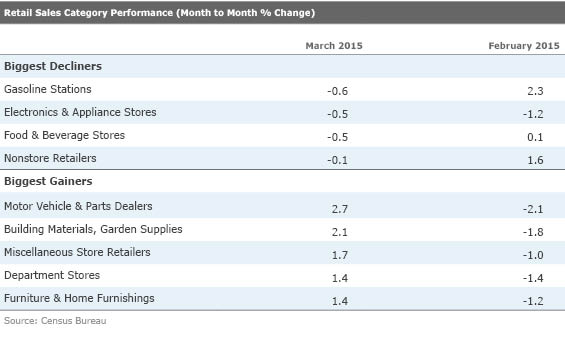
Also worth noting is that gasoline sales in dollars were down between February and March, which seems very odd and is likely to be revised. In that same time, prices were up, so I would have expected dollar volumes to be up, not down. This is a major part of the reason that retail sales overall were up 0.9% in March rather than the expected 1.1%. Excluding gasoline, sales were better than forecast.
Housing Market Fails to Rebound in March Housing data, including starts, permits, and builder sentiment, which all had difficulty in February, failed to bounce back strongly in March when the weather was substantially better. I frequently admit month-to-month data is always a clumsy way to look at any data set. Still, it seems very odd that housing starts, which had been averaging around a million units on an annual rate basis for the previous six months, fell to just 908,000 in February. We all thought maybe it was just weather, but starts in March, reported this week, hardly budged (up from 908,000 to 926,000) when the weather was better. This despite the fact that permits, usually a greater marker for starts, have been over the 1 million mark for nine consecutive months.
The strong new home sales report for February also suggested that new home activity had picked up and it was just a matter of time until it showed up in the starts data. It's one of those reports that just seems too bad to be true, with a potential either for a spectacular monthly reading in the near future or a substantial revision to this data set. The year-over-year averaged data for both starts and permits does look quite a bit better, but I fear that those metrics are being skewed to the upside by incredibly bad weather a year ago.
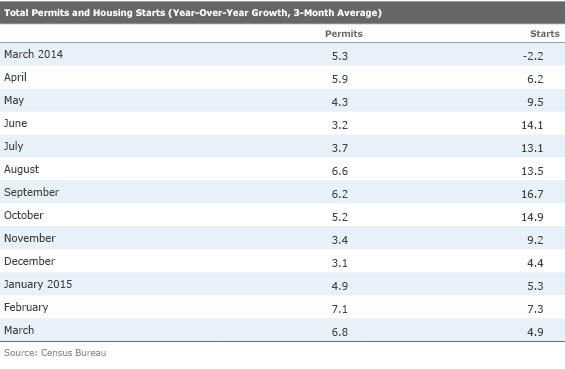
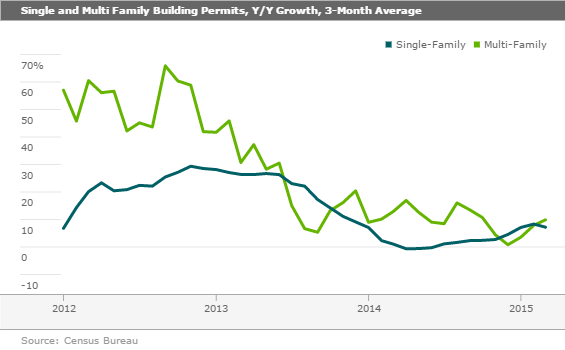
With a modest weather adjustment, it's still hard to argue that the total new home and apartment market is growing much faster than 5% when many economists had hoped for 15%-20% (and our forecast of just over 10%) for the full year of 2015. One piece of good news is that permit growth is now running ahead of starts growth rates and the raw level of starts, which means it is highly likely that starts will continue to accelerate in months ahead.
Somehow the glum starts data and even the slightly better permits data, viewed on a purely statistical basis, just don't seem right. Interest rates are still low, the employment market is better, and builders are learning to offer more value-oriented homes, suggesting that the market should improve more than the starts and permits data did.
Anecdotally, co-workers here at Morningstar are noting clearly more positive real estate conditions. One colleague who had hoped to pick up a fixer-upper at a cheap price gave up on that strategy (too many additional issues discovered during inspections of bargain-priced homes) and is now looking at buying a raw lot and building. I have had more showings in the past two weeks of trying to sell my lake home than I did in a whole season a couple of years ago. Another friend mentioned that his parents' home, which was on the market most of the past year, sold in less than a week when put on the market this spring. And many of the bigger builders, especially
Then there is the new home report for February, released a couple of weeks ago, that was unequivocally bullish. That report measures single-family homes that are sold (whether not started, in progress, or finished) excluding custom homes and excluding builder-occupied homes. Year over year, on a moving-average basis, this measure is up a more plausible 14% (and March to March it is up a stunning but less believable 25%). One can never be sure which report is right. I believe the truth lies between these two measures, but readers should feel free to decide for themselves.
Also, the multifamily market, which was stronger than single-family homes for some time, has cooled considerably even as single-family homes are trending slightly better over the past year (but not the past two months). That is not an all-bad result as the single-family market is bigger than the apartment market and single-family homes utilize more labor and materials.
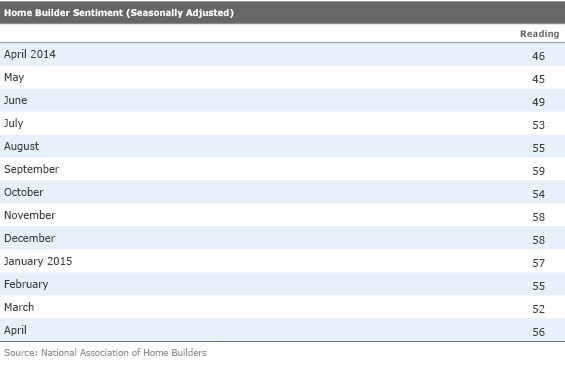
Small-Business Sentiment Slips in March, as It Usually Does As we have mentioned before, we are not huge fans of sentiment reports; we would rather look at hard data and orders. The index for small-business sentiment seems to be a decent concurrent/lagging indicator but has not been tremendously useful in forecasting conditions. Still, we always take a quick glance through the NFIB's Small Business Sentiment Report. And like a lot of indicators, the news recently has indicated a softer economy. After moving from a reading of 94 at the beginning of 2014 to 100 at year-end, the index has been falling back in 2015 and dropped to 95.4 in March.
The NFIB also warned that all 10 segments of the index were down in unison, an unusual occurrence. However, as our colleagues at Capital Economics were quick to point out, this index has fallen in 13 of the past 14 March periods, potentially indicating an issue with NFIB's seasonal adjustment factors.
Looked at March to March, the index increased from 93.4 to 95.2, not an awful state of affairs. We are also comfortably above the recession low of just over 80. Although some employment metrics looked softer month to month, the compensation metrics showed little change from their elevated levels, indicating that labor scarcity is persisting. Again, given some of the seasonal issues, I am not prone to read much positive or negative into the current report.
World Growth Rates Continue to Shift Around The IMF released its latest forecasts of economic growth rates by country this week. Basically, the report showed some convergence since its last forecast, with China and the United States receiving a growth downgrade and the EU and Japan receiving an upgrade, while the overall world growth forecast for 2015 was unchanged.
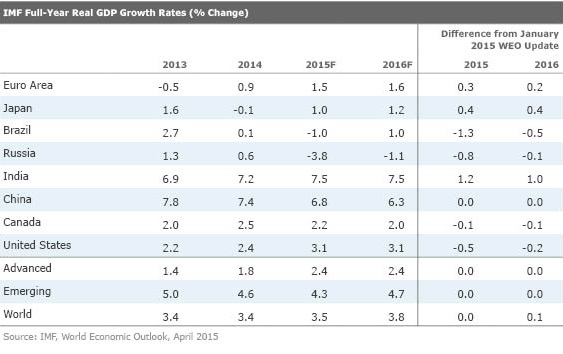
The news doesn't come as a surprise, as we had always thought that the U.S. forecast was too high (and still is) because of a shifting oil situation, weather, and a slowing manufacturing sector. The EU and Japan have seen upgrades as their quantitative easing programs kick in. While there may be a measure of hope in the European forecast, we did note that European industrial production and inflation rates, released this week, have ticked up again with more improvement seeming to be a real possibility.
China was spared any change as the IMF forecast was already below consensus and Chinese official forecasts. However, that may prove to be the most optimistic number of the lot at 6.8% growth for 2015. Though first-quarter Chinese GDP growth hit the official 7% target, retail sales and industrial production for March both came in below plan. We surmise that China is feeling some pressure from a stronger dollar. Given that the Chinese currency is tightly correlated with the dollar, the stronger dollar and Chinese currency have made Chinese goods less competitive with other developing market economies. Brazil is being hurt by falling commodity prices and corruption issues, along with Russia, while India, a huge importer of commodities, is seeing improved growth rates.
U.S. Inflation Still Looking Tame Overall, headline consumer-based inflation increased a modest 0.2% in March, slightly lower than expectations for 0.3% price growth. It marked the second month in a row when prices increased following three months of substantial declines. Wavering gasoline prices are behind both the current CPI increase and the previous large decreases. On a year-over-year basis, total prices are basically unchanged. And until the United States laps the beginning of the decline in gasoline prices in August, it's not likely that year-over-year U.S. inflation rates will be significantly different than zero. However, as we lap the huge gasoline price declines, worldwide demand in general begins to pick up, and labor market shortages continue to evolve and develop, inflation could become more of an issue by year-end and even more so in 2016.
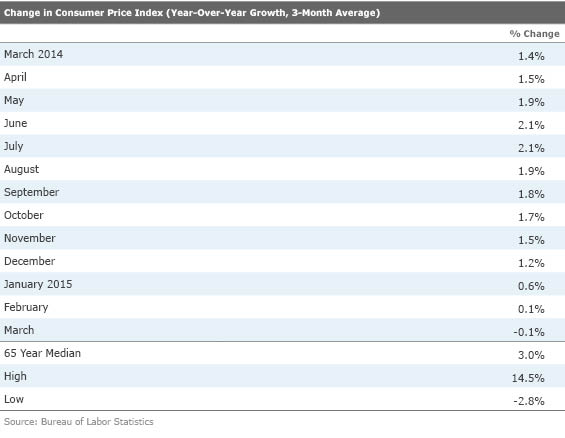
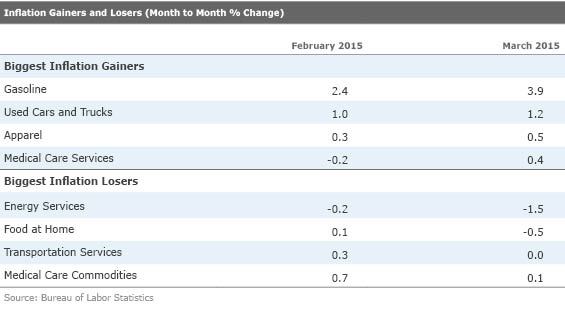
Sector Data Has Good News and Bad News Food prices finally got a big break in March. Food prices in grocery stores fell by 0.5% between February and March, a large move for even this volatile category. Recent short-term declines are now even filtering back into the annual price reports. Year over year, home food prices are now up a more manageable 1.9%. In March, even meat prices were finally down month to month, though they are still up 6% year over year.
We have been waiting for food prices to drop for a long time. Droughts, freezes, and Chinese demand all kept prices higher than I would have ever guessed given the large fall in grain prices from their peaks. Other big inflation losers besides food include utility prices for gas and electric and transportation services, mainly airfares. Still, gasoline prices were up as were used cars, apparel, and medical services. Though not making the "biggest" list, shelter (which includes rent) was up 0.3% or 3.6% annualized. Given that shelter is about a third of the CPI calculation, housing is keeping a real floor under the U.S. CPI inflation rate.
The Manufacturing Sector Remains Under Pressure Headline industrial production was down 0.6% month to month but still up 2.0% year over year, modestly below long-term averages. The utility subindex was the major culprit in the relatively large month-to-month decline in the headline index, as the utility index dropped 5.9%. Utility sales fell sharply as temperatures moderated (creating less demand for natural gas and electricity) in March following an unusually cold February. Fortunately, utilities are mainly an indicator of weather and not economic activity.
The much larger and more meaningful index for manufacturing increased by 0.1% (1.2% annualized) after being flat or down for three consecutive months. The year-over year averaged data for manufacturing showed a growth rate of 3.7%, which is still above the long-term average of 2.6%, but has fallen sharply from its high of 4.9% reached in January. We have been forecasting for some time that manufacturing was more likely to grow at 3% or so in 2015 rather than the unusually high rate of 4.5% in 2014. A slower energy sector, slowing auto growth, and potentially falling exports were the primary reasons for our relative pessimism on the sector. The fact that the more forward-looking purchasing manager surveys continue to fall indicates that even more slowing may be in front of us.
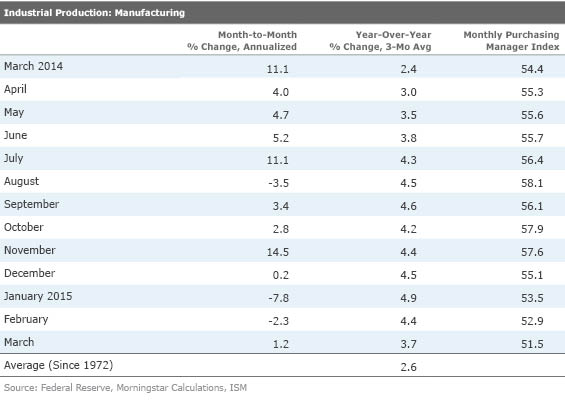
Sector Data Shows That a Quick Bounce in Auto Production Saved the Day for Manufacturing Excluding the motor vehicle segment, the manufacturing sector would have been down 0.1% instead of being up a like amount for the whole manufacturing index. Motor vehicles make up about 5% of the index and were up just over 3% month to month. The majority of other categories were down month to month, and the categories that were up weren't up by all that much, other than the auto sector. Actual oil and gas well drilling was down 17% and managed to reduce manufacturing growth by over 0.2% even though this sector accounts for less than 1% of industrial production. Unfortunately, things in the oil patch are not likely to get better soon.
Housing and Manufacturing Data on Tap for Next Week As we noted above, home sales data has gone flaky on us. Data within the sector has been contradictory while from the field anecdotal evidence seems to indicate a stronger market. Hopefully, some of this data will self-correct with the March housing data to be released next week.
One of the grand mysteries has been why single-family housing permits have been growing in the midsingle digits while new home sales are up in the midteens. Both metrics supposedly measure relatively similar things: single-family homes. The permits data includes custom and builder-occupied homes (about 20% of units) that are not included in the new home data set, which ends up measuring primarily tract home activity. The new home data has been on fire for the past two months while the permits data has just limped along. Certainly some of the discrepancy relates to the relative unpopularity of tract homes, especially those in distant suburbs, but the gap still seems unusually wide.
The consensus forecast is that new home sales for March will drop back from their torrid pace of 539,000 units in February to 500,000 units. That still makes the three-month moving average, year-over-year growth rate 20% versus just 7% growth for single-family permits for the period ended in March. Anecdotal evidence suggests that the new home sales data is closer to the mark, but we shall see more data next week. Besides the raw pace and growth rate, we will be closely looking for any revisions to past months of data.
Existing-home sales have been in a bit of a funk, too, with two consecutive months below the 5-million-unit level. I continue to believe that is a weather-related phenomenon. The consensus is expecting March existing-home sales to jump from 4.88 million units to 5.03 million units based on improved pending home sales data. We believe that the sector could do even better, with unit sales of 5.1 million or more, based on our recent conversations and looking at the pendings data on a year-over-year basis instead of using a month-to-month metric.
Like almost everything else in the manufacturing sector, durable goods orders and most of its variants have looked terrible on a month-to-month basis since late last summer, and even the year-over-year data has been eroding. Things should look better in March with better weather, a resolution of the port strike, and a stronger auto sector. Month-to-month data could be up as much as 0.9%. But don't celebrate too long. The single-month, year-over-year growth rate is likely to fall below zero with the March report. Continued pressure on exports and a slowing energy sector will help keep a lid on the manufacturing sector for several months before an improving housing sector begins to work its magic on the manufacturing sector in the second half.
/cloudfront-us-east-1.images.arcpublishing.com/morningstar/6ZMXY4RCRNEADPDWYQVTTWALWM.jpg)
/cloudfront-us-east-1.images.arcpublishing.com/morningstar/URSWZ2VN4JCXXALUUYEFYMOBIE.png)
/cloudfront-us-east-1.images.arcpublishing.com/morningstar/CGEMAKSOGVCKBCSH32YM7X5FWI.png)