
The Shortfalls of Fed Fortunetelling
Pundits can be exactly right in forecasting Fed actions and perfectly wrong about interest rates.

Until Friday, world stock and bond markets didn't make much progress. Then on Friday afternoon, the eurogroup and Greece agreed to extend Greece's aid program, which helped European and North American stock markets to dash to the upside along with higher interest rates.
I continue to be surprised by how much tiny Greece can move world markets in both directions. I guess that happens when there isn't a lot of other fundamental news. The sudden reversal in bond rates, which had been trending down recently, rebounded, affirming that low U.S. rates are partially a flight to safety maneuver. The 10-year bond rate is now back to 2.13%, up from 2.02% last week and 1.67% at the beginning of February (which in turn was the lowest rate since 2013, when the U.S. Federal Reserve began whispering about ending the bond-buying program).
There was a lot economic data out this week, but no major breakout in recent trends in housing, manufacturing, or Fed policy. Reporters spent hours parsing words in the Fed Open Market Committee meetings. But it seemed to me, the long discussions about how to announce a rate increase when the time comes were the biggest hint that maybe we aren't that far away from a rate hike. I remain convinced that 2015 will be the year the Fed tightens, but the exact month it will occur remains frustratingly elusive. It's a good thing that the date of the first rate hike isn't particularly useful information for long-term investors (but is vitally important to day traders).
Probably the biggest news of the week was
. The news is perhaps the ultimate validation of our labor scarcity theory that we began talking about early last year. More on that in next week's video.
That is great news for workers and, eventually, consumption. It might not be such great news for other companies with very high labor content and low wage rates that will now be forced to pay higher wages. And historically, rapidly rising wages haven't been great news for corporate profits, either.
Fed Governors Continue to Be Patient, but With Their Fingers on the Trigger We usually don't comment on the ins and outs of Federal Reserve policy meetings but thought we would offer up reminders and a few comments this week. First, some of those reminders: Last year we learned that the Fed is not the be-all end-all in world monetary policy. Pundits were exactly right in forecasting what, when, and by how much the Fed would change its bond-buying program in 2014. That didn't help forecast interest rates one iota, and forecasts were perfectly wrong with rates on 10-year bonds falling to under 2% instead of increasing to 3.5% or 4%, as predicted at the beginning of 2014.
Other Central Banks Will Have a Role in U.S. Interest Rates The monetary policies of other world central banks are the source of the disconnect. Many countries adopted easing measures, including Europe and Japan as well as China during 2014. With money being the ultimate fungible, easily moved commodity, money created in these markets found its way back from these regions into the United States, depressing U.S. interest rates. Despite the declines in U.S. rates, the current rates are still well above many other world markets.
Fed Short-Term Moves May Not Push Up Long-Term Rates The Fed might even move up short-term rates, which it can control directly, and see little change in longer-term rates, at least in the short term as money from outside the United States continues to flood in. It will potentially be like the 2004-06 era when the Fed continued to raise short-term rates repeatedly with almost no movement in long-term rates.
Short-Term Rates Do Need to Move Above Inflation Levels Our take has always been that setting short-term rates that far below inflation (well, the gap used to be really wide) was a special measure and could not be sustained forever. It has been sustained a lot longer than we might have expected when implemented over six years ago. The long-lasting nature of the zero interest rate program is probably because of all the excess slack in the economy and tight lending conditions that kept much of that money from ever finding its way into the economy.
Many use a punch bowl analogy to describe Fed actions. It puts out the punch bowl (looser monetary policy) to get the economy moving whenever it slows, then takes away the punch bowl (tight monetary policy) just as the economic party begins to get a little out of hand. This time, the Fed took a slightly different stance on the punch bowl. It put out the punch bowl, which made everyone feel good, but put a fence around that punch bowl so only the most intrepid could get to it. That fence consisted of much higher capital requirements for banks, and extensive audits and tighter mortgage standards for individuals. The punch was there for all to see, but few could actually get a drink.
However, as lending conditions ease, the economy approaches normal levels of unemployment, and the output gap begins to close, the Fed will have to raise rates and tighten or risk higher inflation. The need for higher rates is a question of when and not if. And with employment slotted to drop below 5.5% this year, the time seems to be in 2015.
Fed Action Likely in 2015, but When Is Anyone's Guess Reporters are ripping apart every piece of Fed data and minutes, trying to figure out which meeting it will begin pushing up short-term rates. It's a fool's errand, and long-term investors shouldn't care. Only day traders, who could lose their leveraged shirts, should really be concerned. And the day the Fed does do the deed won't be pretty for either stocks or bonds. However, in a few months' time that's likely to be forgotten, and the markets will track corporate earnings and economic activity. And while short-term rates need to at least cover inflation, we aren't expecting a big bounce in interest rates or inflation. Slow economic growth, a result of the demographics of a rapidly aging world population, is likely to keep a lid on the demand for money and keep rates relatively low for a potentially long period of time, in our opinion.
Current Fed Minutes Seem to Indicate We Are Getting Close to a Rate Hike, but Not Now The minutes released this month were long and contained a lot of procedural issues that extended their normal length. The document was not an easy read. The main solace reporters took from the minutes was that "many" governors were worried about the impact of increased rates on the economy while just "several" were worried about the potential threat of inflation. A lot of people are hanging their hats on that one section.
Most of the other comments in the minutes seemed to indicate that the governors were warming up to a rate increase. One of the sections in the minutes was a long discussion on how the Fed might announce a rate increase and plans for subsequent increases. Why would the governors spend so much time discussing the "how to announce" issue if a rate increase weren't clearly on their minds?
The economic and labor market commentary all seemed to indicate that they believed the economy was picking up a lot of steam with only the housing sector and energy-related industries holding things back. I don't believe the economy is quite as strong as they seem to think (which will become clearer in next week's revised GDP report for the fourth quarter). If their bullishness turns out to be right, rates will go up sooner than later, maybe in June. If I am right and the economy hits a little speed bump related to weather and energy, that rate increase will come later in the year.
Manufacturing: No Boom and No Bust Concerns over the manufacturing sector are one of the primary reasons we are less bullish on the U.S. economy (my forecast of 2.0%-2.5% growth versus a consensus forecast of 3% growth for 2015). Although manufacturing is just less than 10% of U.S. employment, it has an outsize impact on the U.S. economy, partially because of the high hourly wages workers receive for one of the longest available work weeks compared with other sectors.
Industrial production for the manufacturing sector grew a very strong 4.5% in 2014, outpacing the 2.7% average pace of the past 50 years and the U.S. GDP growth rate of 2.4% for all of 2014. I suspect that with slowing exports, declining growth rates in the auto sector, and reduced drilling equipment needs, manufacturing growth will slow in 2015. Some of the slowing is visible in the month-to-month growth figures that showed a gain of just 0.2% (2.4% annualized).
Year-over-year data is a different story. Weather issues a year ago depressed January results, causing a huge year-over-year gain (6.0% for the single-month comparison). The table below captures that dichotomy.
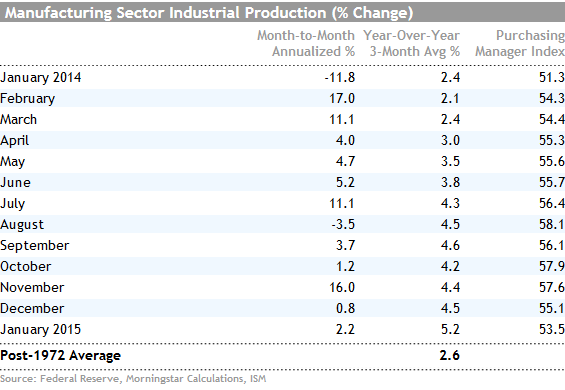
The good news is that even the month-to-month data is in positive territory, which would seem to indicate that the manufacturing sector is not falling apart. Much like the purchasing managers' data and durable goods orders, growth rates in manufacturing businesses in the near-term data are not as robust as they once were, but things aren't collapsing, either.
The sector data is slightly more troubling, with autos, airliners, petroleum products, and furniture showing declines. These were some of the stronger sectors of 2014. Oddly, things that go into those products--primary metals, wood products, and fabricated metals--all showed hefty gains and were some of the best performers in January. Either these improvements are precursors to better end-market production, or these sectors couldn't cut back fast enough. Only time will tell, though it seems odd that the metals-related categories would be doing so well now. On the bright side, computer shipments were also unusually strong, which is unusual for the first month of a quarter. Computer buyers are notorious for buying their machines at the very end of a quarter to extract the best deals from manufacturers.
No New Boom for Housing Just Yet Housing strongly underperformed expectations in 2014 with housing starts at 1.0 million units versus 0.92 million in 2013 and expectations for over 1.1 million units. Larger multifamily projects (big apartment buildings) jumped 17%, while the more economically lucrative single-family market grew at a more anemic 5% rate for all of 2014.
For January, month-to-month starts slipped from a 1.08-million-unit, annualized, seasonally adjusted rate in December to a 1.065-million-rate for January. Not much slippage, especially given the weather, but not a breakout from the trends of recent months, either. The news was slightly worse than the headlines suggested as single-family homes slumped 7% month to month, while large multifamily projects grew 17%. Many of us thought that after a strong single-family month in December the momentum was finally swinging toward the single-family market. January's data dashed those hopes, at least for now.
Permits Data Means the Housing Recovery Is on Hold for Now The more forward-looking, less weather-influenced permits data showed a similar pattern of limited growth and at least a slight bias toward better apartment building growth.
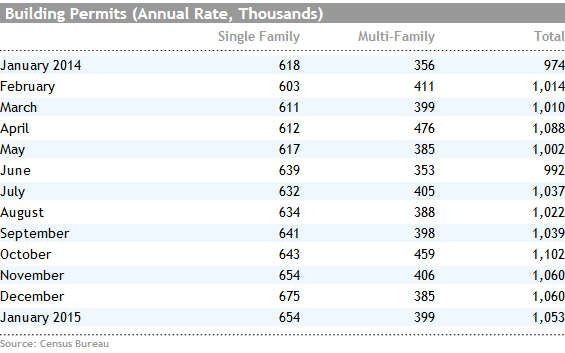
This was discouraging news. The slow permit data as well as terrible February weather suggests that it could be April or even later before the housing market picks up steam, and even longer before it pulls the rest of the economy upward.
Despite falling mortgage rates, affordability just hasn't changed much as prices (which are up) and incomes (which aren't lighting the world on fire) have more than offset falling mortgage rates. Current affordability is still very good relative to long-term trends, but it hasn't gotten any better lately.
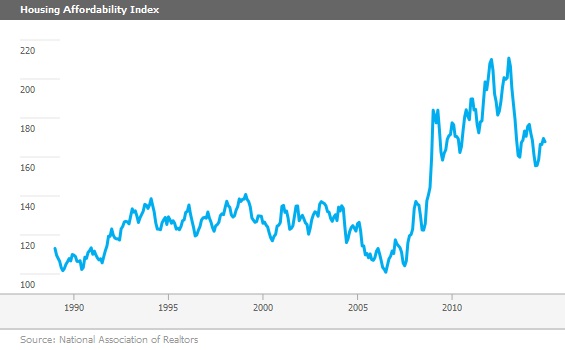
There is no fresh impetus for buying. Paradoxically, if the Fed does move rates up, I wonder if it doesn't create a rush to buy homes again, the same way it did in 2013? That was when we had the taper tantrum--when rates spiked because the Fed hinted it would begin ending its massive bond-buying program--and both rates and home sales jumped.
Builder Sentiment: Half the Indicator It Used to Be (written by Roland Czerniawski) Builder sentiment pulled back from a reading of 57 in January down to 55 in February. The index is derived from three components: current sales conditions, sales conditions over the next six months, and buyer traffic. The third component is particularly important as it attempts to gauge the demand for new homes. Unfortunately, buyer traffic was the component that decreased sharply (pulling back from an already low 44 to an even worse 39), and the other two elements remained little changed.
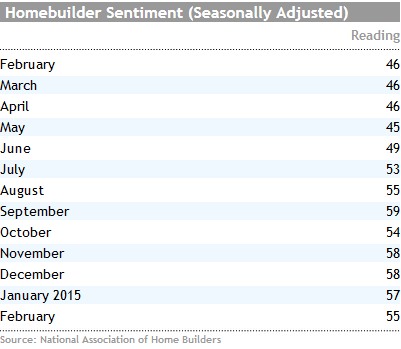
While we comment on the builder sentiment metric on a monthly basis, we also caution that this indicator is no longer what it used to be. Many housing market commentators, including us, have noticed that the rise in builders' optimism did not correspond to proportionally good improvements in the housing market over the past 12 months.
The chart below illustrates this phenomenon more closely. From the plotted dots (dated 2000-14) we can observe that there seem to be two data regimens with two different slopes and magnitudes of correlation. The smaller bottom line of the dots predominately represents the most recent recovery while the upper curve mostly consists of data points from the earlier time period starting in 2000 until 2008.
This picture tells us a powerful story. More recently, an additional point in improved homebuilder sentiment translated into fewer new home sales compared with the historical standards. For example, an extra point in optimism typically resulted, on average, in about 9.1 thousand new homes sold between 2000 and 2008. Since 2008, this number is only 1.8 thousand. This means builders are a very optimistic lot and perhaps better times still lie ahead. Or, it could mean that builders got so banged up in the housing bust that any growth at all is reason for optimism.
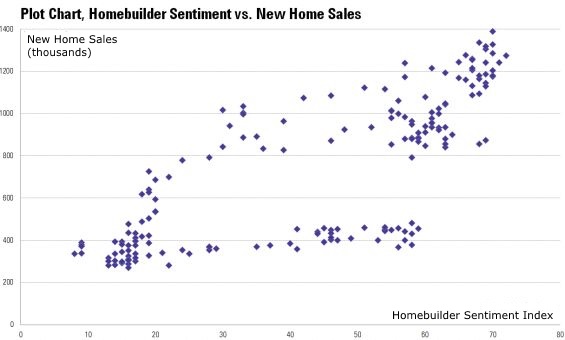
Furthermore, historically, homebuilder optimism and new home sales had the highest point of correlation at about 15 months of lag. This meant that the sentiment was a decent leading indicator and homebuilders' improved moods translated into the sales of new single-family houses a little bit more than a year later. More recently, however, the leading usefulness of the homebuilder sentiment appears to be lost. According to our statistical research, the same lag metric is equal to just one month now. That is why the bottom regimen of the dots on the plot chart appears as a straight line--there is virtually no lag needed to fit the data--it is now virtually a concurrent linear relationship.
Does this mean that we should ignore this metric altogether and never look at it again? The answer is no. Homebuilder sentiment suffers from the same issues that affect most, if not all, sentiment-oriented indicators today, including the famed ISM PMI. They tend to be more telling when they are at either end of their extremes. This means that the homebuilder sentiment, just like the PMI, is a good indicator of tops and bottoms of the business cycle, but is very noisy when the economy, just like now, is fluctuating somewhere in between. That's why the clusters of dots appear to have the highest concentration at the extremes and not so much in the middle. While the pace of the housing recovery remains muted, those who look for signals of accelerated housing growth might need to pay less attention to the sentiment values and more to the underlying market fundamentals such as affordability, availability of credit, and demographic trends.
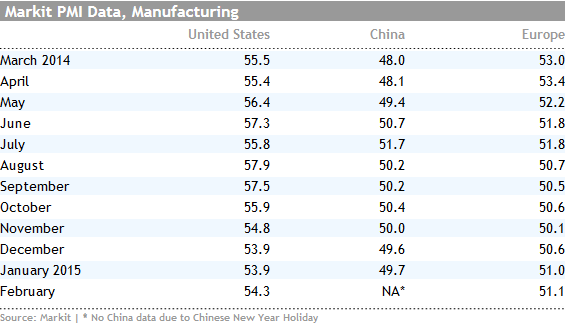
Markit Purchasing Manager Data Little Changed Like so many other indicators this month, the flash Markit PMI manufacturing data for Europe and the United States were little changed from the prior month. I guess the one thing we can say is that the U.S. data has arrested the downward trend that began all the way back in August. Europe was on its third month of recovery and is also now better than at any time since July. However, neither reading is particularly high or very different from any other reading in the back half of 2014. The European data was still disappointing given the ever-weakening euro and that lower oil prices should have already begun to help this forward-looking metric. Chinese data was not available because of the Chinese New Year holiday.
GDP Reduction, Housing Data, and Durable Goods Expected Next Week The GDP news late in the week may turn out to be the most important data point of the week. Because of revised/new data released after the original GDP estimate, economists predict that the originally estimated GDP growth rate of 2.6% is now likely to be reduced to 2% or maybe even less. While this is well known by most economists, I am not so sure the media has figured this out yet. The media was already stirring the pot, noting, almost gleefully, that the fourth-quarter growth was slashed in half from the 5% growth rate of the second quarter. Now it looks like that estimate was too high. Let's see what they do with the new data on Friday.
There is a ton of housing data from existing-home sales, new home sales, pending home sales, and pricing data. I suspect the overall housing data will show little change if not some modest declines for January. Existing-home sales for January are expected to drop from an already poor 5.0 million units to 4.9 million units, based on weather conditions and the lackluster pending home sales data already available. Likewise new home sales are expected to be almost unchanged at 484,000 units because of weather and normal seasonal issues. Even this may prove to be too optimistic as builder sentiment, often a leading indicator of new home sales, took a dip in its latest reading, as noted above. Also, given that new home sales surged almost 9% month to month in December, I would not be at all surprised if new home sales fell back to the 450,000 level. Pending home sales dropped a surprising 4% in the November report (which is why expectations are low for existing-home sales). The 4% drop came out of the blue as the index had been little changed for the prior five months. November weather was not great and was much better in December. That could push those pending home sales up by the same 4% for December, recapturing a lot of what was lost in the unseasonably cool November.
CPI Is Expected to Fall a Near-Record Amount The Consumer Price Index dropped by 0.4% in December and economists are expecting an even faster 0.7% drop for January. This would put the year-over-year, single-month inflation rate into slightly negative territory (negative 0.2%). Even our three-month moving average methodology shows an inflation rate below 1% if the consensus is right. I will say, while deflation is likely to be larger in January than in December, the 0.7% estimate seems a bit extreme. Gasoline will have the same net impact on both months, but gas and other utilities could show bigger downward moves than in December. Still, a near-doubling of the deflation rate seems a bit extreme.
Durable Goods, Looking for a Bottom Durable goods, excluding the volatile transport sector, have been down for three months in a row, with December down 0.8%. The fourth month back in the series wasn't much better with minuscule gain. Economists are expecting a decent increase to 0.5% for January. Manufacturing employment hasn't looked nearly as bleak as the order books, suggesting the managers and sales folks must be hearing rumblings about improvements. Let's hope they are right--we don't want to extend this downward trend in orders to four months.
No Column Next Week I am out all next week, so there will be a labor market video and no regular column.
/cloudfront-us-east-1.images.arcpublishing.com/morningstar/6ZMXY4RCRNEADPDWYQVTTWALWM.jpg)
/cloudfront-us-east-1.images.arcpublishing.com/morningstar/URSWZ2VN4JCXXALUUYEFYMOBIE.png)
/cloudfront-us-east-1.images.arcpublishing.com/morningstar/CGEMAKSOGVCKBCSH32YM7X5FWI.png)