
The Grudging Improvement in Retail Spending
Although recent data suggests we've turned into a nation of savers, the low-gas-price celebration might have actually started last fall.

It was a very good week for equity and commodity markets around the world, even as U.S. bonds continued to falter. Over the past two weeks the U.S. 10-year bond rate increased from 1.65% to 2.02% with a strong employment report, rebounding oil prices, and a tentative agreement in Ukraine. I think that rate could move still higher from here.
You could have thrown darts at various regional world equity markets and have gotten the same basic results. Europe, emerging markets, and the S&P 500 were all up just a touch over 2% for the week. Oil saw another volatile week of trading but managed a gain of about 3%, ending at over $52 a barrel. Unfortunately, that has quickly found its way back into gasoline prices, which have moved up from just under $2 per gallon at its low point to $2.23 currently and rising.
There wasn't much economic news out of the United States, and earnings season continued to wind down, providing little new fuel for large market moves. Perhaps the best news of the week was a report out of Europe showing the sequential quarterly GDP growth rate for the eurozone improved from 0.2% to 0.3% (1.1% annualized). Not a lot to write home about compared with the U.S. growth rate of 2.4%, but at least it is now moving in the right direction. However, the growth wasn't what one might call balanced. Germany, which represents about 30% of the block, grew a faster 1.7% with help from both exports and consumers. France and Italy continued to turn in very sluggish performance. With a lot of European Central Bank stimulus yet to arrive and falling energy prices, market participants are hopeful that Europe may be out of the woods. However, with the lack of reform measures in Italy and France, I'm not so sure.
We viewed the U.S. retail sales report as slightly positive when the data is examined on a year-over-year basis, even though the month-to-month data registered yet another decline. Still, a great deal of the month-to-month decline was related to falling oil prices. (This report is not adjusted for falling prices.) The U.S. budget deficit remained under tight control, which is great for the deficit, not so great for short-term economic growth and job creation.
The job openings report for December was yet another good one, at least if one is an employee. Job openings now stand at over 5 million positions, the highest level of the recovery. There was also more inventory data this week that suggests yet another potential reduction in the GDP report for the fourth quarter, which was originally reported as a 2.4% growth rate. The odds of that report now showing growth of just under 2% are increasing rapidly. Paradoxically, that could make the prospects for 2015 slightly better with inventories now at lower levels.
Retail Sales Data Tricky to Interpret, but Still Clearly on the Mend Volatile gasoline prices and auto unit sales always make this report a little tricky. However, those categories are relatively easy to strip out of the results. Still, looking at month-to-month data, which absolutely must be seasonally adjusted, is complicated by the fact that seasonal patterns are much more volatile than statisticians assume. And common-sense adjustments for unusually bad weather or shifting retailer sale calendars are not allowed (fear of political manipulation of data sets).
Something seems clearly amiss in data that puts retail sales at an out-and-out boom in October and November and then slumping to recession-type levels in December and January. During that period, job growth, consumer sentiment, and total wage growth were relatively strong, though not at what I would call boom levels. This strongly suggests that there wasn't a spurt and collapse as the month-to-month sales data hints.
Our normally reliable year-over-year averaged data is getting an unusually strong boost from weather that was much better in both December and January than those same months a year ago. That poor weather did a real number on several months of retail sales data in late 2013 and early 2014. That in turn makes the year-over-year data for 2015 look too good at the moment (and will begin hurting the data in March). If we could normalize for weather, I would guess that retail sales would be in the 4.5% year-over-year growth rate at the moment, as it was for most of the last half of 2014. The inflation-adjusted data, even adjusting for weather, would likely still show a slowly accelerating pattern.
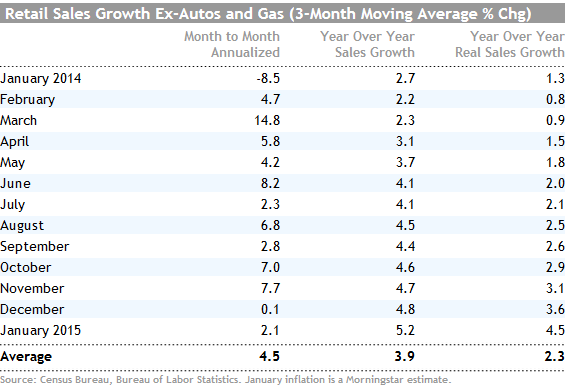
Has the U.S. Really Turned Into a Nation of Savers? Most of the headlines on the retail sales report suggest that we have suddenly turned into a nation of savers, who refuse to spend a dime of the colossal savings they are reaping in gasoline. Besides the flaws noted above, it could be that the gasoline celebration (and some food prices to cheer about, too) may have started earlier, in October and November, with annualized retail sales growth rates of over 7%. Certainly these numbers tend to drop back after huge moves that run above the averages, and we think that is all happening here.
Maybe the closest representation of reality is the weekly shopping center data, which doesn't include some of the more volatile and weather-driven categories of goods.
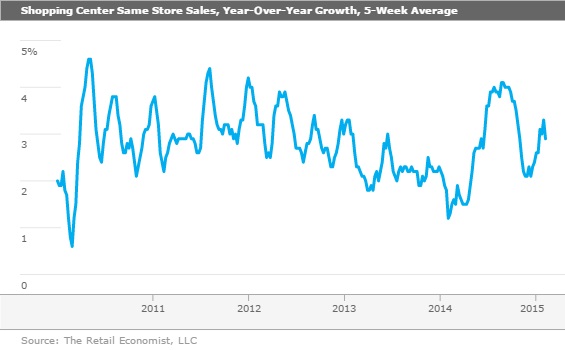
At first this chart seems just as volatile as some of the regular month-to-month numbers. Take a closer look and note the scale. Most of the growth numbers are 2.5% and 3.5% growth for the past four years. The month-to-month numbers ranged from negative 8.5% to positive 8.2%. And the shopping center data catches some of the ups and downs without the up, up, and away optimism that one might get using the weather-addled year-over-year retail sales report.
In 100% complete honesty, the retail sales data can say just about whatever you want it to say because of a highly unusual set of circumstances. The only explanation that seems completely out to lunch is the media's favorite: The consumer has boomed and busted again, and their piggy banks are bursting at the seams.
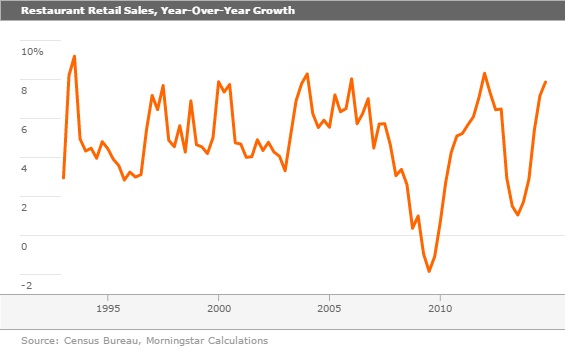
The sector data doesn't add a lot to the discussion. I suppose the huge gap up in restaurant sales is a pretty strong indicator of positive consumer sentiment. And restaurant sales aren't skewed by mix-shift issues between brick-and-mortar outlets and online sales. Year-over-year restaurant sales growth, at 8% or so, is very near its highest growth level dating all the way back to the early 1990s. A better employment market has certainly been a big help. Price increases have also provided a small boost to the recent data set, but that is only a small part of this improving story. The pessimists in the audience can take some solace in the fact that restaurant sales growth levels have always seemed to top out at levels at or even modestly below where we are at the moment.
Volatile auto and gasoline sales are clearly visible in the category data below:
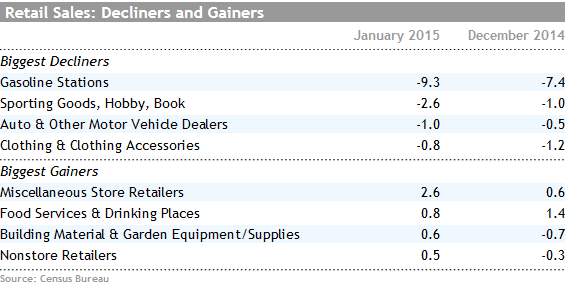
I am not so sure what is happening with clothing sales--they are down meaningfully for the second month in row. Building materials categories just might be benefiting from a rush to buy snowblowers. Nonstore retailers, such as
Budget Deficit Through January Consistent With a Smaller Deficit for Fiscal Year 2015 A couple of weeks ago, the Congressional Budget Office offered up new budget projections through 2025. After incurring an actual deficit of $483 billion in 2014, CBO is projecting a budget deficit of approximately $467 billion for both 2015 (2.6% of GDP) and 2016 (2.5% of GDP).
This week the CBO announced that the deficit for the four months through January and the single month of January. The deficit for the four months increased by $12 billion during that period. Though this might seem inconsistent with plans for an improved deficit in 2015, the first quarter had some of the best budget news of 2014, while the back half of 2014 included several one-time negatives. That means deficits should be larger in the front part of 2015 and small in the back part of the year.
In the first quarter of 2015, payments from Freddie Mac and Fannie Mae were about $30 billion less than a year ago because of a one-time tax benefit payment made in fiscal year 2014. Excluding that special factor, the four-month deficit would have shrunk by about $20 billion. And January and February should be the last months when there were significant Affordable Care Act subsidies in 2015 but not in 2014. There was also a very large special adjustment to spending on student loans in the second half of 2014, which hopefully won't happen again in 2015.
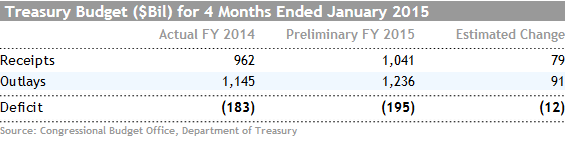
To the naked eye, it may look like spending is surging with an 8% growth rate, compared with just 1% for 2014. That growth rate would look more like 4% or 5% for both years excluding those one-time Freddie and Fannie payments discussed above. And about half of that growth is due to provisions of the Affordable-Care-Act-expanded Medicaid and increased exchange-based health-care subsidies. Even at 4% or 5% federal spending growth before inflation, there isn't much potential for the government sector to help either the GDP report or employment data.
The January data wasn't quite as helpful as I thought it would be. January is a decent month for individual tax collections, and I was hoping that we would see a surge in individual proceeds, just as we had seen in corporate tax payments for December. Unfortunately, proceeds were up just 1.9%. However, with no sequester fights this year, tax refund processing began 10 days earlier, depressing the year-over-year growth rate in "net" collections after refunds paid. Without this shift, individual tax collections would have grown at nearly double the reported 1.9% rate for January. On a more positive note, those nonwithheld tax payments surged 14% in January versus a year ago, potentially reflecting stock market strength and the estimated tax payments due on stock sale proceeds.
JOLTS Report Still Strong, Marks 2014 as the Year of Great Labor Market Improvements (by Roland Czerniawski) This week's Job Openings and Labor Turnover Survey showed 5.0 million new job openings in December, up from the downwardly revised 4.8 million in the prior month. New hires stood at 5.1 million, the highest level since November 2007. The number of quits, which is usually a good indicator of workers' confidence and the overall health of the labor market, increased slightly to 2.7 million. The quits metric was as high as 3.1 million prior to the recession.
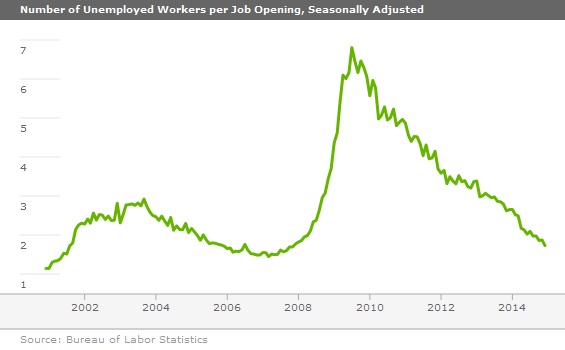
Another statistic that we track is the number of unemployed workers per job opening. It is usually a decent indicator of the level of labor market tightness. This number has been ticking down very consistently since its peak (6.8) in 2009 and is now at an 85-month low of 1.7. This means that, on average, there are fewer than two unemployed candidates for each job opening.
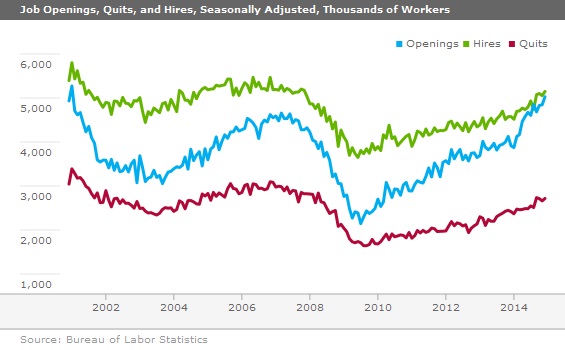
Now that we have the latest piece of data for 2014, let's summarize last year's JOLTS progress. By many measures, 2014 was a great year and perhaps a turning point for the accelerating labor market. Going into the year, the level of openings stood at a mere 3.9 million, but it began to accelerate unexpectedly at a pace not seen since the inception of this report in 2001. Openings took off and increased by a staggering 29% in 2014, landing at 5.0 million in December. The pace of new-hire improvements in the JOLTS report more than doubled, from a modest 5.4% pace in 2013 to 12.5% in 2014. This acceleration in new hires was also confirmed by the employment report, which showed a substantial pickup in 2014 in terms of job creation. Quits, on the other hand, have been trending at a relatively slow-but-steady rate of about 10% year over year for a few years now, and they continued to improve in 2014. The slow pace of quits might be a piece of the slow hourly wage growth puzzle, indicating that despite a tightening labor market, workers' confidence hasn't accelerated enough to push employees to demand higher wages or quit for greener pastures. When and if this measure takes off--just like new hires and openings have--it should contribute to higher wage growth, as switching employers is often one of the most certain methods to increase your pay.
This scenario is becoming increasingly likely as the number of unemployed workers per job opening continues its freefall. Surprisingly, gauging by this statistic, the pace of labor market tightening has been accelerating over the past few years. The drop in the number of unemployed workers per opening was 8.9%, 21.2%, and 34.8% in 2012, 2013, and 2014, respectively. Whether this strong pace will continue remains an open question, but nonetheless it appears that this number is on a path to reach its pre-recession low of 1.5-1.6 sometime in 2015.
We will monitor this statistic closely as labor scarcity becomes a more prominent theme. Due to shifts in demographics and a falling unemployment rate, the U.S. economy might move from not having enough jobs to not having enough workers in the coming years. Industries that rely on specialized, skilled workers with few new young entrants will be the first "victims" of this phenomenon.
Next Week Is All About Housing and Manufacturing Housing was one of the most disappointing sectors in 2014 with existing-home sales declining between 2013 and 2014, and housing-start growth dropping back into single-digit growth rates. In an economy that grew about 2.4% in 2014, housing contributed less than 0.1% of that growth, down from 0.3% in each of the prior two years. Low interest rates, an improving employment market, and perhaps even rising hourly wages could begin to aid the housing market this year.
Next week will bring the first concrete data on the housing market for 2015, with data on builder sentiment, and housing starts and permits. Unfortunately, weather and holiday spending hangovers often make January a very difficult month to judge the health of the housing industry. Builder sentiment is expected to increase from 57 to 58. That would generally be good news; however, it would still be below the recovery high of 59. Builders were overly optimistic about 2014, so readers need to use some caution when interpreting this data. Also, we will be most focused on the traffic metric (how many people walk through model homes), which has run well below the current business conditions and future expectations components of the index.
Housing starts are expected to remain unchanged at 1.09 million units comparing December and January. If the consensus forecast comes anywhere near estimates, it would represent a massive improvement from the weather-afflicted total of just 0.9 million units started in January of a year ago. The 1.09 million forecast for January would be just about in the middle of the 2014 starts of 1.01 million and 2015 forecasts that center around the 1.13-million-unit level. We will be closely watching the single-family component of starts, too, as there was what appeared to be a real breakout in the more lucrative single-family category in December. Hopefully that is sustained in January and the December numbers don't get revised downward.
Worldwide Markit Flash Purchasing Manager data for February will also be released next week, which will give us some window into the world manufacturing environment. This metric has proved to be a real market mover over the past several years. Unfortunately, it is the time of year when the Chinese New Year begins to influence some of the data. (Manufacturers step up production to beat the week-long celebration that falls in February this year.) My best guess is that both China and Europe show at least some improvement as various easing programs kick in and the dollar continues to strengthen. The U.S. metrics are likely to show some deceleration, in my opinion, due to reduced oil field activity and the ever-strengthening dollar.
U.S. industrial production fell in December, but hopes are high that, at least on a sequential basis, things might look better. The consensus is for overall production to move from negative 0.1% in December to a positive 0.3%. However, I caution that a bunch of that improvement is due to low utility usage in a warm December and much higher usage in a colder- and snowier-than-normal January. Without the weather effect, I suspect production will be down yet again on a sequential basis.
/cloudfront-us-east-1.images.arcpublishing.com/morningstar/6ZMXY4RCRNEADPDWYQVTTWALWM.jpg)
/cloudfront-us-east-1.images.arcpublishing.com/morningstar/URSWZ2VN4JCXXALUUYEFYMOBIE.png)
/cloudfront-us-east-1.images.arcpublishing.com/morningstar/CGEMAKSOGVCKBCSH32YM7X5FWI.png)