
Employment Report: More Rearview Mirror Than Window to the Future
We have always said that employment is a lagging indicator and recent results may be real proof of that phenomenon.

At least until Friday's employment report, the markets this week were driven by news from outside the United States. Markets have been on a bit of a roller coaster, moving with the ups and downs of debt negotiations between bigger European nations and Greece. On Thursday, news out of China pushed Greece out of the headlines. Chinese authorities announced they were cutting their reserve requirements for banks and generally easing bank lending requirements, especially in rural areas. Just like when other central banks have eased, the markets soared on the news.
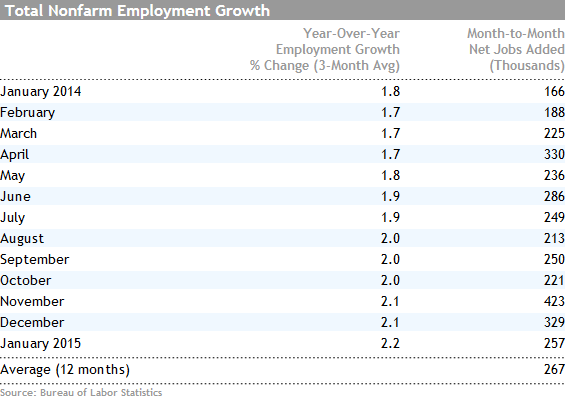
News from Friday's job report was quite bullish for the U.S. economy. With job growth of 257,000 in January, the report beat both expectations and the 12-month average. My glum forecast proved to be too negative yet again. I had thought employment growth could fall to fewer than 200,000 jobs. Recent months were also revised sharply upward. Full-year adjustments and revisions proved to be smaller than usual. Net, the jobs report for the past several months has looked more bullish than a lot of other indicators, which have shown signs of slippage. Good or bad, we always caution that the employment report is a lagging indicator that is highly volatile and often revised. The report is one of many that we use to evaluate the overall health of the labor market. So we wouldn't get too carried away in either direction based on one monthly employment report.
There was some other good U.S. economic news, with auto sales, a key driver of this recovery, exceeding expectations for January. However, that pace is still off December's levels. Still, I don't expect auto-related growth rates to do as well in 2015 as they did in 2014, which will represent a small growth impediment this year. Purchasing manager reports continued to suggest that the manufacturing sector is losing air, but recent results don't represent a catastrophe, either. While news on December consumer spending wasn't great, incomes and savings rates soared during the same time period, providing a little firepower to start off the New Year.
The trade news for the United States was definitely bad, mainly triggered by a more competitive oil market for U.S.-produced energy goods. However, slumping demand for commodities didn't help matters, either. The trade deficit soared from $39 billion in December to $46 billion in January, the worst reading in a year. Surprisingly, exports of capital goods, a category that would normally be hit hard by a strong dollar and weak economies, managed to show a month-to-month improvement. The bad news is that the 2.6% GDP estimate for the fourth quarter will likely prove to be too high, given the worse-than-expected trade report, along with some newly available inventory and construction data. That means the fourth-quarter GDP growth rate will need to be revised down in the next estimate, due at the end of the month.
Overall, I am sticking with my 2.0%-2.5% GDP growth rate for 2015, even though employment data would seem to suggest a somewhat higher growth rate and stronger economy than almost any other economic report we look at. It seems particularly odd that employment had one of its best fourth quarters on record, in a period when there was rapidly slowing GDP growth. Maybe the strong employment data is merely a reflection of the hyperstrong second and third quarters, with employers unable to act on the expanding economy quickly enough. We have always said that employment is a lagging indicator and recent results may be real proof of that phenomenon.
(Note: As Bob was traveling Friday, the following employment sections were written by Roland Czerniawski)
Employment Data Soars, Beating Most Expectations Friday's upbeat employment report probably surprised even the more bullish forecasters. The U.S. economy added 257,000 new jobs in January, showing that the fourth-quarter jobs momentum has continued into 2015.
The consensus predicted that 230,000 new jobs would be added, and we were suspecting that the number could be as low as 200,000. Our skepticism was rooted in an array of decelerating fourth-quarter data--namely manufacturing, Challenger layoffs, December's retail sales, and GDP growth--which is most likely to be revised downward later this month.
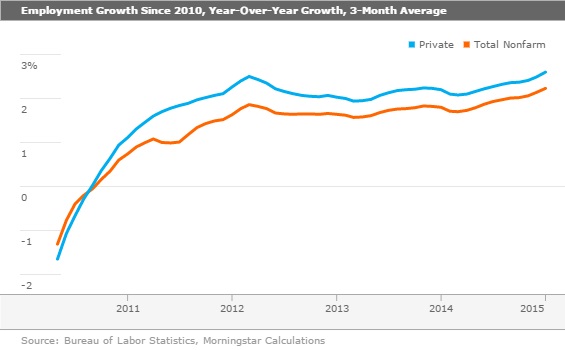
Despite those slowing signals, the year-over-year, three-month average employment growth continues to accelerate. Total nonfarm employment growth now stands at 2.2%–2.3%, while much better performing private-sector employment growth increased to 2.6%. It's not clear yet whether January's bullish employment data is a spillover from the high growth in the second and third quarters or actual proof of a further accelerating U.S. economy. Employment is a lagging indicator, and it appears that we were reminded of it yet again Friday.
Many people pay attention--probably too much--to the headline unemployment number, which is derived from the less-reliable and more volatile household survey. Although the unemployment rate ticked up slightly, it is certainly not a reason for worry. The January report included a substantial revision to the household survey population estimations, which include metrics such as labor force participation, civilian population, and so on. This revision goes back only a few years and makes the data less comparable to the longer-term historical numbers. The increase in the unemployment rate might be more about a change in U.S. Bureau of Labor Statistics population assumptions than a change in the underlying employment situation. As we've mentioned on numerous occasions, the unreliability and volatility of the household survey are reasons to pay more attention to the payroll establishment data instead.
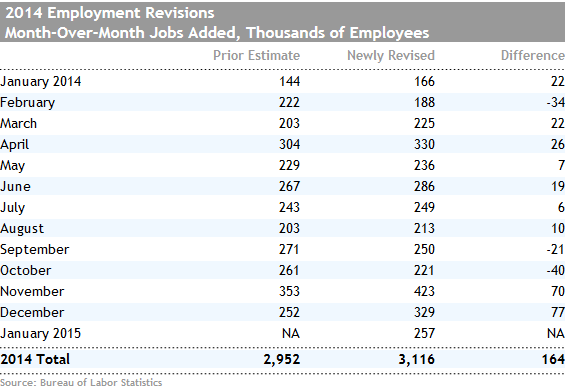
Annual Employment Revisions Modest, but Good Fourth-Quarter Numbers Look Even Better Now The bullishness of Friday's jobs report lay not only in the great January data, but also in the upward revisions that were applied, particularly to the November and December numbers--which were revised up by 70,000 and 77,000 more jobs, respectively. The data now show that there were 752,000 jobs created in those two months alone, and 423,000 new jobs created in November, which is the best single-month result since March 2000. At the same time, looking at 2014 overall, the revisions amounted to only 164,000 more jobs, which by historical standards is not a drastic annual revision.
Finally, the BLS has announced that from now on it will include an additional metric to its employment reports: a three-month moving average. Our readers are very familiar with this metric and its trend-telling power. The volatility of the jobs report has brought unintended trouble to the markets many times before, and it appears that the BLS would like to finally mitigate part of that issue by including a less volatile and less cyclical metric. We congratulate it for finally making that decision.
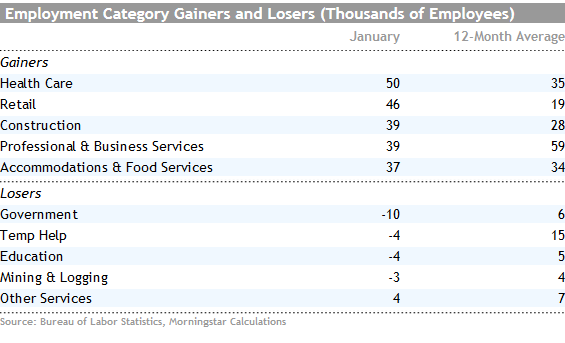
Sector Employment Data Show Balance, More High-Quality Jobs Sector by sector, the employment report was also a positive surprise. Besides the usual gains in low-paying sectors, such as retail and restaurants, we are now seeing more high-paying job creation. Both professional and business services and health care continue to grow, with 39,000 and 50,000 jobs created in January. The surprising part was the construction category, which posted another solid month of gains, adding 39,000 jobs after an unusually high 44,000 jobs added in December. Interestingly, mining and logging, which is a relatively small category that includes workers from oil-related industries, reported a job loss of only 3,000, suggesting that the impact of low oil prices and news about layoffs in the oil industry have not fully crept into the BLS employment data yet.
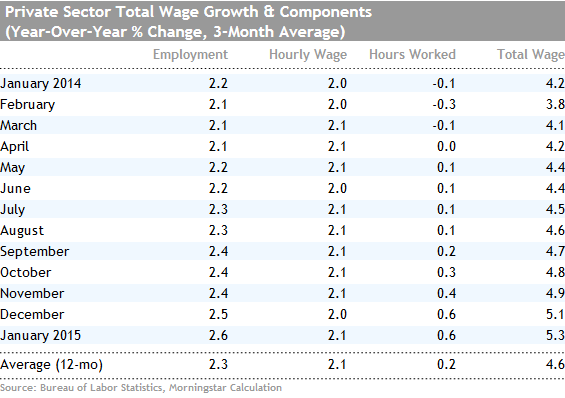
Wages Increase, Hours Stay Flat We're not done with positive surprises from Friday's jobs report just yet. The data also showed that hourly wages increased 0.5% in a single month, after a 0.2% drop in December. Although that is a very good single-month increase, the monthly wage numbers tend to swing wildly, and that's why it's more helpful to look at them on a year-over-year, three-month average basis. That number also looked better, increasing to 2.1%.
It is important to remember that the hourly wage is only one piece of the total wage equation, which also includes hours and number of workers. Private total wage growth has picked up significantly because of rapidly accelerating employment growth and modest help from hourly wages. Adjusting for inflation, the improvement might look even more dramatic, painting a rather rare picture of faster employment and hourly wage growth with a slowing inflation rate.
Year-Over-Year Consumption Growth Stable Despite Accelerating Wage and Income Growth Given consumption is 70% of U.S. GDP, it is one of the more critical factors for detecting the direction of the economy. The income data helps determine if changing spending levels were because of changing attitudes or lack of ability to spend more. Unfortunately, the spending and income data is a little stale by the time it is published; it is often revised and appears incredibly volatile if not examined carefully. For example, personal income grew 0.3% in December compared with November, while spending shrank the same 0.3%; both numbers matched economists' estimates. The numbers were better when adjusted for deflation, which effectively added 0.2% to both growth figures. In other words, incomes were up a stunning 0.5% (6% annualized), while spending showed a modest 0.1% (1.2% annualized) decline. Incomes were up in a broad range of categories including wages, small-business profits, and transfer payments (Social Security). A one-time Social Security payment adjustment added almost $8 billion to the income calculation.
Month to month, consumption numbers have been on a yo-yo, up 0.7% in November then down 0.1% in December. When averaged, that produces a growth rate of 0.3% (3.6% annualized), which is probably a much better representation of reality. An unusually cold November followed by a warm December (shifting the timing of seasonal purchases and utility usage) may be responsible for the most recent bout of volatility. Auto sales, always volatile, have been even more so lately, influenced by sales cycles, weather, and new model schedules. Autos accounted for almost the entire reported decline in month-to-month consumption. In addition, it is very hard to get the seasonal factors exactly right this time of year, further enhancing the already volatile sector data. That jumpiness is evident in the table below.
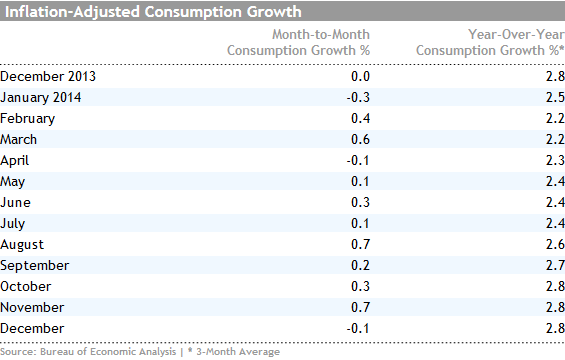
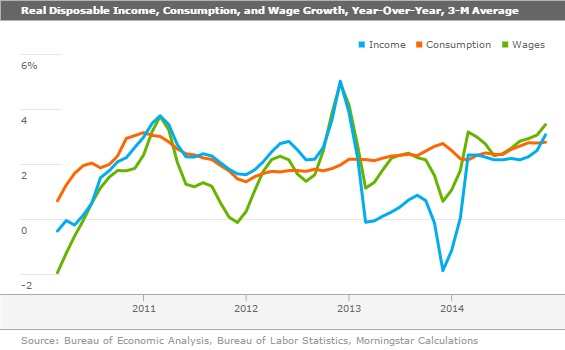
The more reliable year-over-year, averaged data shows a consistent pattern of modest acceleration in consumption growth and nicely accelerating growth in both wages and real disposable income (that is, adjusted for taxes and including rents, dividends, and small-business profits). The data, at least at this moment, suggest that consumers are not spending all of their income gains yet again. Currently, wages are growing at a 3.5% annual rate, real disposable income 3.1%, and consumption slightly lower at 2.8%. The high level of wage growth suggests that there is at least some potential for consumption to improve further in the months ahead. However, remember that government statisticians have often revised away gaps in spending versus incomes in later data releases. I also note that part of the reason for the large jump in disposable income was related to a one-time Social Security payment adjustment that added almost $8 billion to the income calculation. As another point of reference, income has strayed from spending growth because of tax avoidance strategies and Social Security tax changes on several occasions over the past four or five years. Hopefully, those big swings in both directions are behind us, and incomes and spending will continue their recent trend of moving in tandem.
Trade Data Disappoints; Capital Goods a Bright Spot As usual, the trade deficit report for December was exceptionally difficult to analyze. First, let me go through the headline month-to-month numbers on trade (they looked awful) before proceeding to my more nuanced analysis that suggests trade is slowing a bit, but not monumentally so.
First, the November to December data showed the trade deficit increased from $39.8 billion to $46.5 billion. Exports were down 0.8% and imports jumped 2.2%. That's not a totally shocking state of affairs given that the U.S. economy is relatively strong and the rest of the world is slowing. Still, for some reason, it caught forecasters unusually flat-footed. Private economists had expected that the deficit would have remained relatively unchanged month to month and certainly below $40 billion. However, government statisticians did indeed get it right last week when they estimated the trade deficit for December, which is used in the first estimate of the fourth-quarter GDP number. We noted last week that it seemed odd that the statisticians were forecasting more good news on the deficit while government forecasters were saying that it would be, hands down, the worst deficit month of the year. The government experts were almost right. Unfortunately, they weren't quite negative enough, with imports surging above their expectations.
The new trade by itself suggests that the original GDP forecast would be high by at least a couple of tenths of a percent. When including other estimated categories, which have now been released, we now estimate the GDP growth rate for the fourth quarter could fall from 2.6% to just 2.2%. I think a lot of people were hoping that the GDP report would be revised upward in subsequent periods, but this now looks increasingly unlikely. Hope lies mainly in the potential for revised retail sales and a surge in health-care spending. Both are possible, but not likely.
The doom-and-gloomers are characterizing the trade report as the worst monthly deficit since 2012. And they will go on to say that the strong dollar can only make things worse and the U.S. competitive position had eroded badly. Both the month-to-month category data and the year-over-year data suggest that things aren't so bad and that changing oil markets are behind a lot of the apparent deterioration.
The category data is very interesting. The biggest month-to-month declines were in oil and commodity-related categories. Autos and capital goods, two categories that you might have thought would be killed by a higher dollar, showed nicely increasing exports. Exports in the categories of food and other were virtually unchanged. Industrial supplies, which includes oil and a lot of other commodities, was the real export killer on a month-to-month basis. So far the impact of a rising dollar has yet to really show up in the data.
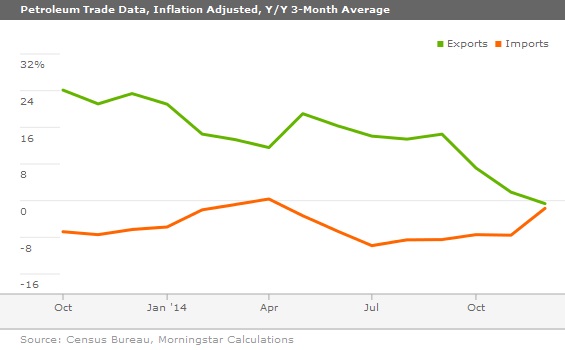
Year-over-year nonpetroleum export growth may have plateaued, but it hasn't really deteriorated just yet, as shown by the relatively flat line at about a 4% rate--see below. If anything, exports have shown a slight upward bias from the beginning of the year. Nonpetroleum imports are also relatively stable at 6% or so, though that has trended up a little. My guess is the job actions at the West Coast ports kept some imports out this fall and then rebounded as shippers found ways around the bottlenecks.
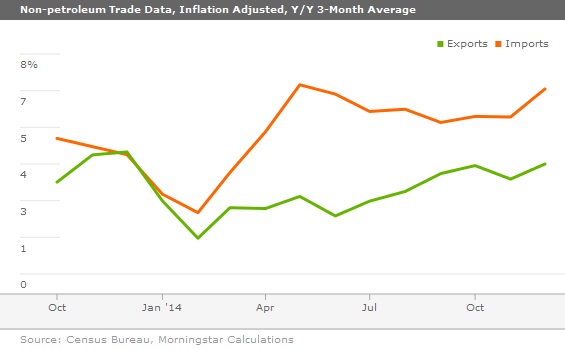
The situation doesn't look nearly as good on the petroleum front. Oil imports have stopped shrinking and exports have stopped falling. These charts are adjusted for price changes, so it's not a change in price effect. Instead, I would suggest the United States is no longer the only supplier of cheap oil, dimming the prospects for U.S. exports. Slower world economies aren't helping the export market for U.S. petroleum-based products. Higher U.S. economic activity could also drive up oil imports, too.
Autos: a Good Month, Not a Great Month It was an OK month for auto sales as reported by Morningstar's senior auto analyst David Whiston, CFA, CPA, CFE:
"On Feb. 3 automakers reported good January U.S. new light vehicle sales with deliveries to consumers rising year over year by 13.7% to 1.15 million. The seasonally adjusted annualized selling rate, according to Automotive News, totaled 16.7 million (versus a consensus estimate of 16.5 million units and December sales of 16.9 million cars), which was the best January SAAR since 17.63 million in 2006 and a healthy improvement from January 2014's 15.29 million. These numbers are impressive but it is important to note the year-over-year percent changes are likely to moderate considerably, starting with March sales, because of the first two months of last year having significant disruptions from severe winter weather. We see no reason to change our expectation of 2015 light-vehicle sales in the 16.9 million-17.1 million unit range or change fair value estimates and moat ratings on January sales news. Barring a major macroeconomic headwind having an impact on U.S. consumer confidence, we expect the industry to continue to recover from the massive contraction during the financial crisis resulting in 2009 sales of just 10.4 million."
The table below shows the up-down cycles last year and the dramatic effect of weather on the early months of 2014, making for the exceptionally easy comparisons. The numbers below are BEA data, which usually run 0.1 million units below the Automotive News data that Whiston cited above.
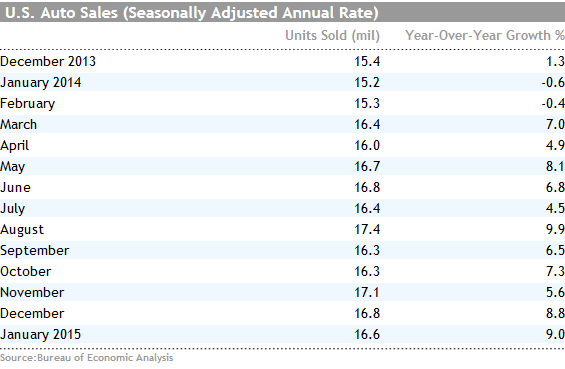
As we surmised, auto sales fell between December and January, whereas light truck sales (including crossovers and vans) were up between the two months on a seasonally adjusted basis. Light truck sales are benefiting from lower gasoline prices. Sales of light trucks generally help the Big Three automakers, which derive a greater portion of their sales and especially their profits from the light trucks category compared with other manufacturers. Vehicles manufactured outside of the United States represented 26% of unit auto sales and just 11% of truck sales in January, according to the U.S. Bureau of Economic Analysis.
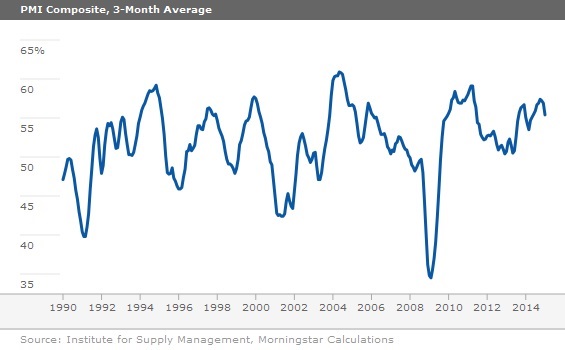
PMI Data Point to Pending Slowdown in Manufacturing Purchasing manager data for January dropped more than expected, according to the Institute for Supply Management. The composite index fell from 55.1 to 53.5. The index has now fallen from a high of 59 this fall to its current reading of 53.5. That's nothing to really panic over, but it indicates a loss of momentum just as last week's poor durable goods order report did.
The graph below, which is a three-month average--not the single-point reading--is nowhere near its danger zone, which is close to 45. Trying to make economywide forecasts based on small jiggles in this index is not a great idea. This indicator is at its best when it drops sharply and definitively below 50, or even worse. Otherwise it just provides a lot of noise, as shown below. Still, with autos not growing so fast, the housing market stuck in the mud, and exports not looking the best, it's hard to imagine that 2015 will be a great year for manufacturing.
Next Week's Economic Calendar Thin; Retail Sales the Biggest News Autos and tumbling gasoline prices have complicated the analysis of the retail sales report, which is usually a halfway decent economic indicator. Gasoline sales, which are not adjusted for inflation, make the headline numbers look a little silly. Retail sales were down 0.9% in December and are now expected to be down 0.7% in January, due mainly, but not entirely, to slumping dollar sales of gasoline. Gasoline represents more than 10% of retail sales, excluding autos. However, even excluding autos and gas, retail sales were down 0.3% between November and December.
I am optimistic, based on weekly retail sales data that month-to-month retail sales, ex-autos and gasoline, should be back in the black in January. The year-over-year data will potentially look amazing given that last year's weather-induced retail disaster makes for a very easy comparison.
Also due next week is the National Federation of Independent Business's report on small-business confidence, which absolutely soared last month. Although I am not a huge fan of this report, I will be looking at the hard-to-fill-jobs category, along with employment and wage intentions. The U.S. Treasury is also due to report on the January budget deficit. The numbers so far in fiscal year 2015 (September) have looked very good, with low spending growth and soaring corporate tax collections. This month will show if consumer tax payments are also moving up sharply. Estimated payments were due in mid-January. The job openings report, which was a very early indicator of the recent surge in new jobs, is also expected next week. It will tend to confirm or contradict this week's jobs report.
/cloudfront-us-east-1.images.arcpublishing.com/morningstar/6ZMXY4RCRNEADPDWYQVTTWALWM.jpg)
/cloudfront-us-east-1.images.arcpublishing.com/morningstar/URSWZ2VN4JCXXALUUYEFYMOBIE.png)
/cloudfront-us-east-1.images.arcpublishing.com/morningstar/CGEMAKSOGVCKBCSH32YM7X5FWI.png)