
From Fear of an Overheating U.S. Economy to Doom and Gloom in One Easy Week
As the eyes of the world turn to the ECB, some are beginning to worry about the strength of the U.S. economy.

On the back of a strong employment report and all the consumer benefits of falling gas prices last week, economists were racing to up their 2015 GDP forecasts that were now up to over 3%. Even I was getting increasingly nervous that my 2.0%-2.5% U.S. GDP forecast was at least a tad too low. My nervousness was misplaced, as was the Street's optimism. This week, a much weaker-than-expected retail sales number, a reduced world GDP growth forecast from the World Bank, and the sudden realization that falling oil prices could hurt significant portions of the U.S. economy, all spooked investors. That's not to mention that initial unemployment claims moved higher, too. Everyone was so excited about falling oil prices that they missed the fact that a lot sectors/regions could suffer. Texas, which represents over 8% of U.S. GDP, grew by 3.7% in 2013 versus 2.3% for the rest of the United States. That Texas growth rate could slow to less than U.S. averages in 2015 if oil prices continue to scrape along the bottom. I suspect that a large portion of the gains we wrote about for pickup trucks just last week was probably due to sales to oil patch workers, many now facing layoffs that have already begun.
This week the U.S. market was the worst-performing of the sectors, with developed markets, emerging markets, and European markets all posting positive results while the S&P 500 was down over 1%. Even broad commodities markets did better than the U.S. stock market. Investors seemed to believe that the U.S. was about to join the rest of the world in its economic quagmire. That (along with the European central bank meeting on quantitative easing next week) caused bond rates to decline around the world too, in some cases negative rates. Just when everyone thought U.S. interest rates couldn't possibly go any lower, the U.S. 10-year bond fell to a yield of 1.82%. There is now even some questioning if a Fed rate hike is in the cards for 2015 at all. I wouldn't be taking that to the bank just yet, but it appears that some participants are entertaining that thought.
There was more to worry about, too. The sudden unpegging of the Swiss franc and the euro shocked the financial world, causing the franc to soar by almost 20%. In the face of potential ECB quantitative easing, it became too costly for the Swiss to continue to support the euro. This caught some traders flat-footed, which is likely to lead to more than one trading firm failing. I also learned from my co-author Roland Czerniawski that many Eastern European mortgages were denominated in the now much more expensive Swiss franc. Yikes--just what Europe needed.
To add insult to injury, the fourth-quarter earnings season got off to a rough start with three of the four largest banks reporting this week, and offering some kind of disappointment. Tepid loan growth, regulatory expenses, and fixed-income trading losses certainly didn't help matters. The bank news is on top of already low fourth-quarter expectations due to falling energy earnings. It now looks fourth-quarter 2014 over fourth-quarter 2013 growth in S&P 500 earnings is likely to come in at less than 1% versus the 6%-8% rate that analysts were projecting just three months ago, according to FactSet. Much, but not all, of that is due to declining oil-related profits.
I wouldn't despair too much about the state of the U.S. economy or short-term corporate earnings. Overall, U.S. growth rates should remain quite good and much better than in many other parts of the world. Too, a lot of this week's poorly received economic reports, especially the retail sales report, weren’t as bad as some of the short-term, headline numbers suggested. Next week, if the ECB pulls through with some form of meaningful QE, markets may be greatly relieved. If they don't, writing this column next week will not be a lot of fun and I may be typing it from underneath my desk.
Monthly Retail Sales Shake up Markets, but no Cause for Alarm Markets reacted badly to news that total retail sales declined by 0.9% instead of the consensus forecast of a 0.2% decline. That compared with a sharply lowered November retail sales growth rate of 0.4%. The news ex-autos and gasoline (which are volatile and measured more accurately in other reports) declined 0.4% from November to December versus an also downwardly revised growth rate of 0.6% in November. I caution that the month-to-month numbers are truly dangerous to use this time of year because they are so dependent on weather. Furthermore, retailer decisions on when to hold their biggest sales also make a difference in which month of retail sales looks better. More sales and more seasonal hiring seemed to be taking place earlier and earlier, to the point where October was now really a holiday month, too. This year November looked particularly good, but December wasn't good at all. Retailers already seemed to know this as retail hiring in December was almost nonexistent.
Therefore, the year-over-year data might provide a more meaningful comparison, especially if we average three months of data together.
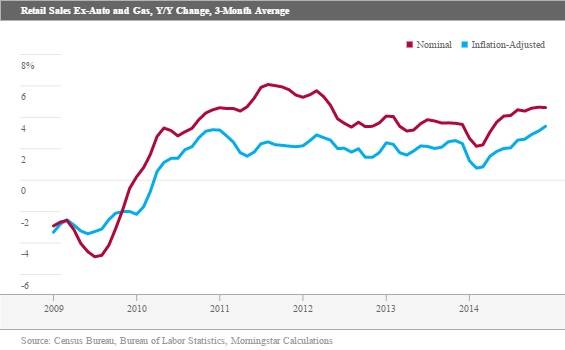
The red line above, which reflects noninflation-adjusted data, shows that retail sales have remained relatively stable at around 4% since 2012, with a brief dip around the first quarter of 2014 that was clearly weather-related. However, the data does seem to show that retail sales growth has stopped accelerating. The blue line above, which adjusts for inflation, seems to indicate that retail sales are continuing to improve. In fact, inflation-adjusted retail sales have improved each and every month all the way back to February, improving from just 0.8% to 3.4% currently. Not a bad performance all. Though, one would have never guessed that given the stock market's reaction to the report on Wednesday that sent the Dow Jones industrial average down by almost 300 points at one point on Wednesday.
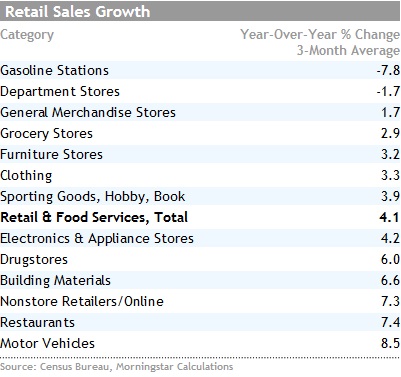
Autos, Nonstore Retailers, and Restaurants Trample Conventional Brick-and-Mortar Retailers This week, we are also examining our retail sector data on a year-over-year averaged basis instead of our usual table of month-to-month winners and losers. While there is some clustering of sector reports in the 3%- 4% annual growth rate range, the span of performance looks unusually large. Even tossing out gasoline stations, growth ranged from negative 1.7% for department stores to 8.5% for autos while the all-inclusive retail and food service average over the past year was up 4.1%. Businesses that we typically think of as retailers did particularly poorly. We surmised that 2014 would be a difficult year for conventional brick-and-mortar retailers, and it was. Autos, restaurants, and nonstore retailers (such as Amazon) did very well, but at the expense of conventional retailers. Autos benefited from the high age of the fleet, new models, and attractive financing packages. I don't think I would quite pop some auto sales bubbly just yet, but it seems like growth is likely to drop back in 2015. Restaurant sales have benefited from better employment data and the consumers' desire to spend money on experiences over things. And with poor weather in 2014 online retailers, such as Amazon, made easy pickings of conventional retailers. That said, with better weather and conventional retailers fighting back harder, including a greater Web presence of their own, 2015 may not be quite as robust for the online folks.
Anecdotally, it feels like more consumers are beginning to opt for higher rents either by moving out of their parents’ basements or choosing more expensive but better located apartments. This is leaving a little less money for conventional shopping. And with at least some of the population, especially at both ends of the age spectrum, opting for smaller but better located properties, there is less room for junk to accumulate.
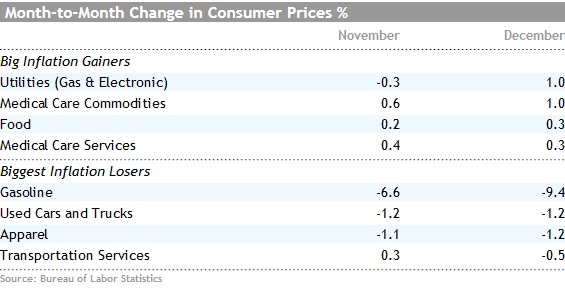
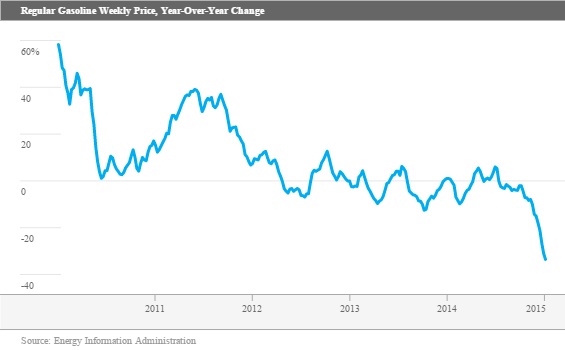
Overall Prices Decline Yet Again (Nonseasonally Adjusted), but not for Everyone Between November and December overall prices fell 0.4%, driven largely by a fall in gasoline prices of over 9%. One might think that gasoline, at just 4.4% of the CPI, might not make much of a difference. However, prices would have increased by 0.1% if gasoline is tossed out of the equation. Still there were a lot of other prices that were in decline, too, most related to falling energy prices or a strong dollar. Apparel, new cars, used cars, and transportation services (mainly airline tickets) also declined. We were glad to see airline ticket prices decline almost 5% as ticket prices had been continuing to increase, despite earlier declines in oil prices.
Still, the good news ends here as there was some surprisingly bad news, too. If one is a big eater, needs a lot of medical care, and doesn't own a car, December was pretty much a disaster. Drug prices were up over 1%, food was up 0.3%, and a lot of the big price declines were related to autos. The health care news was particularly disturbing because we had hoped that the long-term trend of higher and higher prices had been broken. According to Morningstar healthcare team leader Damien Conover, a combination of higher prices from the consolidated generics industry, fewer drugs going off patent, and more specialty drugs (many of which are seeing double-digit price increases) have caused the recent string of increases. That trend may be hard to break. Food prices were also troubling, not just in December, but for the full year. Food prices were up 3.4% in 2014, and food has twice the weighting of gasoline in the index. Beef and veal prices were up a stunning 18% in 2014, offsetting at least some of the excitement centering on gasoline prices.
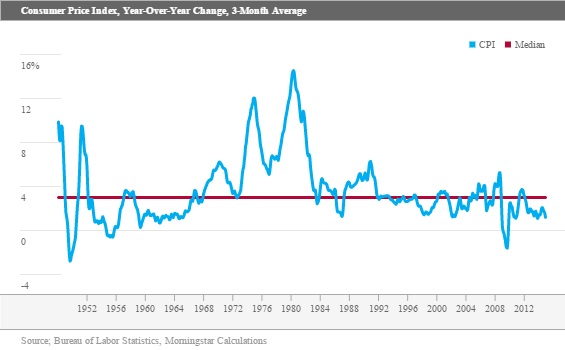
Year-Over-Year Inflation at 0.8%, Destined to Go Negative in January Comparing December 2014 to December 2013 prices increased just 0.8%. Even on my more conservative three-month average basis, the index was up just 1.2%. That is an unusually low number given the long-term average is about 4% and the median about 3%.
In January, it is highly likely that the single-month, year-over-year CPI figure will turn negative and stay there for at least a few months. Prices were surprisingly high last year and were up considerably between December and March. Gasoline prices may be down as much as 40% in some of the months ahead. Even with a 4.4% weighting, gasoline could single-handedly take 1.8% off of the CPI calculation.
Ex-Food and Energy, Prices Have Been Incredibly Stable I have preached for years about not looking at CPI without food and energy (because they are the most visible and hardest-to-evade price changes and they make up almost 20% of the index). However, inflation without these categories has been surprisingly stable, between 1.6% and 2.0% for each month of 2014 and very similar to the 1.7% rate for all of 2013. For 2015, core CPI growth could move slightly higher as health care prices continue to go up in addition to probable increases in rents. These could move core inflation rates up to the 1.8%- 2.0% range. The total CPI figure for 2015 will be by driven food prices, which are likely to be lower, and energy prices, which are anybody's guess. Still, energy prices are unlikely to fall as fast as they did in 2014 and may even by higher by year-end. Interestingly, if gasoline prices grow just 20% in 2015 (or to about $2.75 per gallon), food inflation slows to just 1% and core inflation moves up 1.8%-2.0%, combined headline inflation could be as high as 2.8%-3.0% by next December.
Small Businesses Finally Feeling Good Small businesses have not had a good recovery at all. A clampdown on using credit cards and home equity loans as a funding source for small businesses has certainly hurt this sector particularly hard. Ongoing consolidation in areas like office supplies, sporting goods, and clothing has also dramatically reduced the number of small businesses in these sectors. I would also surmise that a decent portion of small businesses were housing-related, and that sector has had a relatively slow recovery, too. According to ADP data, small and medium-size businesses have grown employment by about 9.5% during this recovery while the large businesses category, (those with a 1000 or more workers) has grown by a more impressive 12.3%.
Overall Small Business Index Finally Returns to Long-Term Average Many economic indicators (with the possible exception of housing metrics) returned to their prerecession highs years ago. Even the poorly performing job market recovered all of its lost ground in early 2014. However, small-business confidence has been pulling up the rear for some time. Now confidence has finally matched its long-term average after showing little or no real improvement between 2010 and 2014. The linked graph from the National Federation of Independent Business shows each of these moves.
Technically, the index is still below its 2005 high but we don't really want to quibble. The December index reading saw one of its best single months of improvement, moving up 2.3 points to 100.4, its best reading since October 2006. This follows a very nice improvement in November. However, the November increase was concentrated in two categories while eight of 10 categories improved in December. We were particularly glad to see companies reporting that it was difficult to fill at least one position, increased from 24% to 25%, validating our labor shortage thesis.
Turning to compensation, the percentage of small businesses increasing compensation recently moved from 19% last December to 25% currently. Plans to raise compensation over the next three months moved from 13% to 17% year to year. Eventually these increases will need to show up in the hourly wage report that has been relatively lackluster over the past year.
It is great to finally see small business, the biggest sector by employment, finally looking up. Unfortunately, the Small Business Index is a little more of a lagging than a leading indicator, perhaps indicating that the U.S. recovery is moving into middle age.
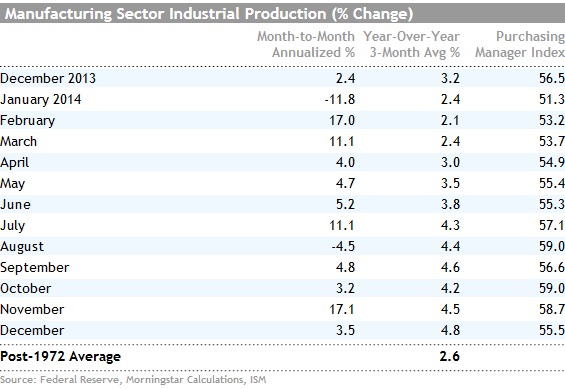
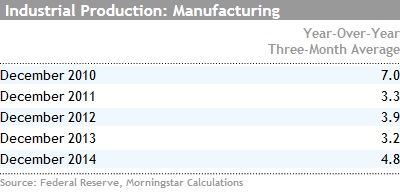
Manufacturing Data Still Looks Good, the Other Shoe may Fall Shortly While headline industrial production was down 0.1% the manufacturing-only component that includes mining and utilities (which were down big because of warm weather) was up 0.3%. Even better, the year-over-year growth rate managed to eke out another improvement.
Manufacturing Sector Data Shows a Changing of the Guard The leader board for manufacturing showed some extreme changes from longer-term trends in December. Autos, aerospace, and heavy machinery all registered large declines and these have typically been leading categories. Meanwhile, growth in computers, apparel, and primary metals more than offset the weakness. Growth in petroleum products and chemicals, while still high, were trending down in December.
The month-to-month data capped one of the best years for manufacturing in some time, especially this far into a recovery (the first year of a recovery always looks spectacular).
This May Be the End of the Road for Strong Manufacturing Growth Although I am not expecting a cliff-diving fall for the U.S. manufacturing economy, I would expect manufacturing to return to something like its long term growth rate of just 2.6% from current levels that are pushing 5%. 2014 was an exceptionally good year for autos that represent an important part of the manufacturing sector. The defense portion of aerospace will likely remain anemic and even the commercial aircraft portion is slowing as the 787 is now at full production. Any equipment to process commodities is likely to be soft as well, with oil-related equipment declines likely to accelerate that process in 2015. Some of the PMI data and orders data have been softer lately and these are likely to show up as slowing growth rates in 2015. That is, unless housing accelerates sharply, which could
JOLTS Suggests Workers' Scarcity Very Possible in 2015 (Written by Roland Czerniawski) There were 5 million job openings in November, an increase of 142,000 from the prior month, according to the Bureau of Labor Statistics. That is the second-highest month in terms of openings in the history of the JOLTS report, right behind January 2001 when 5.2 million openings were reported. The number of jobs available has rapidly accelerated in 2014. The level of net openings has increased by over a million between December 2013 and November 2014, or more than 20%. By contrast, during the same period two years ago, only 268,000 net openings were added. The number of new hires remained virtually unchanged at 5 million between November and December, while the number of quits ticked down just slightly to 2.6 million. The number of unemployed workers per job opening hit a recovery low of 1.8.
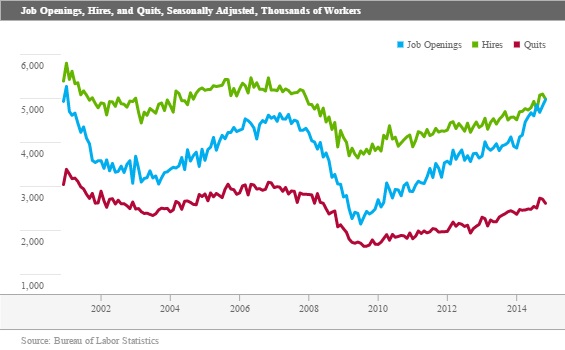
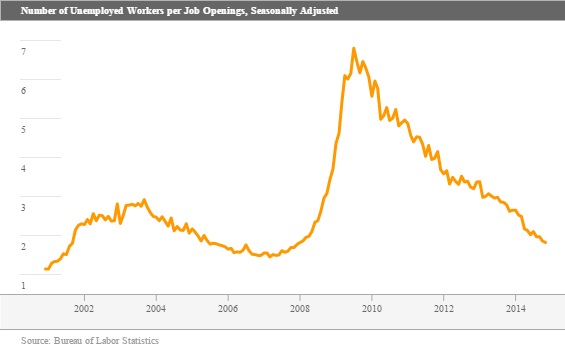
November’s JOLTS report only reinforces our thesis that the labor market continues to tighten, and that the ratio between unemployed workers and job openings will continue to decline. We believe that 2015 will be a particularly interesting year for the labor market, as rapidly growing job openings and a lower unemployment rate will contribute to workers’ scarcity in many industries, especially those that require skilled and experienced workers.
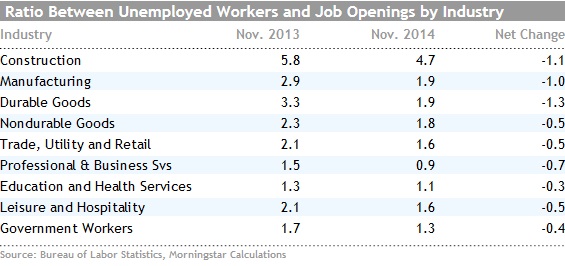
Based on the numbers reported in the Employment Situation report and Job Openings and Labor Turnover Survey, we calculated the relative level of labor market “tightness” in each of the nine core industries for which such data was available. The results are mixed. First of all, what stands out is that the construction sector has the highest number of unemployed workers per job opening. That is a little baffling if we consider anecdotal concerns that many construction employers are still scrambling to find skilled workers. On the other hand, it might just mean that there are still plenty of less-skilled construction workers who remain unemployed.
Second, the data suggests that as of November that the professional and business services category is the only industry, among the ones that we studied, that now experiences an actual shortage of labor, meaning that there is less than one unemployed worker per each job opening. While the exact interpretation of the small number of unemployed to opening is uncertain, there is now doubt that the professional and business services category has been one of the top hiring sectors this year, and the number of unemployed in this category is now much lower than it was a year ago. Better yet, this is one of the better paying longer hours categories of the employment report.
Nonetheless, because of many potential problems with the data, I would caution against taking those numbers literally, especially since unemployment numbers used in those calculations come from the less reliable household survey component of the jobs report. Perhaps it is more important to focus on the change trends within the entire universe of industries instead of the actual levels and magnitudes. On that basis, we see that all sectors tightened considerably. While some job industries, especially the ones that are heavily weighted toward unskilled and less experienced labor, might take much longer to experience actual workers’ scarcity, we have no doubt that employers will have to work harder to fill positions in 2015 than they did in 2014. This is one of the reasons we believe that 2015 will be a year when workers will have significantly more bargaining power for negotiating higher wages.
U.S. Budget Deficit Continues to Make Remarkable Improvement Despite some relatively dramatic headwinds, the U.S budget deficit managed an impressive improvement in the first fiscal quarter of 2015.
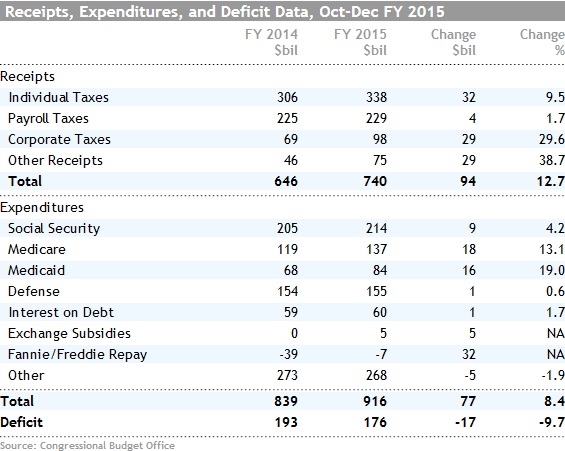
The three-month deficit improved (shrank) by $17 billion despite the fact that there was a significantly smaller payback from Freddie (a $32 billion headwind). Too, November included a large, hopefully one-time, adjustment for Medicare drug payments. Though, receipts were probably inflated some as quarterly corporate tax payments made in December were made on the assumption that the R&D tax credit would not be extended. As it turns out, the credit was reinstated shortly after the tax payments were due. So receipts might look a little lighter next quarter when adjustments are made for the credit.
It looks to me like the deficit could fall to as low as $420 billion (2.5% of GDP) for fiscal year 2015, a substantially better result than CBO forecast this summer. Better employment-related taxes, smaller unemployment payments, lower fuel prices, and constrained defense spending will help the deficit data more than expected. Longer term, the rising health care bill and retirement could drive the deficit higher after 2023. Still, lower inflation and lower interest rates just might help curb some of the more dire deficit forecasts.
ECB Quantitative Easing Is the Only Report that Really Matters Next Week Next week the European Central Bank is scheduled to meet with quantitative easing on the agenda. Markets have priced in some of easing for several months at least. Enough that even the Swiss blinked and acted proactively this week to unpeg itself from the euro before the euro sinks even further (as it is likely to do if QE program is announced). I am still a little unsure exactly what and how the ECB will take action, but this time it needs to be more than the verbal easing of the past that has produced few tangible and successful programs, but lots of words. While there seems to be broad agreement among members that something must be done, I still think there is more disagreement on tactics that could delay implementation. The world will be watching next week.
Markit World PMI data (flash report for January) is also due next week and this is normally market-moving. This time should be no exception. These reports are always hard to predict, but markets will not be happy if production activity around the world continues to erode.
The other three key data points for next week are housing-related with builder sentiment, housing starts, and existing home sales all occurring in the same week. It’s hard to get too excited about housing data in January that is influenced by weather and holiday hangovers. The market is expecting no change in builders' sentiment or in housing starts. Existing sales are expected to bounce back from an unexpected fall in November (which didn't square with some other housing reports). Sales are expected to move up from 4.93 million units in November to 5.04 million units in December. That's better but still worse than each of the previous five months. Lower rates, cheaper gas, and more jobs in 2015 might just be the tonic to get housing off dead-center.
/cloudfront-us-east-1.images.arcpublishing.com/morningstar/6ZMXY4RCRNEADPDWYQVTTWALWM.jpg)
/cloudfront-us-east-1.images.arcpublishing.com/morningstar/URSWZ2VN4JCXXALUUYEFYMOBIE.png)
/cloudfront-us-east-1.images.arcpublishing.com/morningstar/CGEMAKSOGVCKBCSH32YM7X5FWI.png)